S&P 500 Outlook: SPX
The S&P500 Index is under pressure ahead of the Federal Reserve interest rate decision on tap for March 20, but the pullback in US equities may end up short lived should the index continue to track the positive slope in the 50-Day SMA (4971).
S&P500 Forecast: SPX Holds Above 50-Day SMA Ahead of Fed Rate Decision
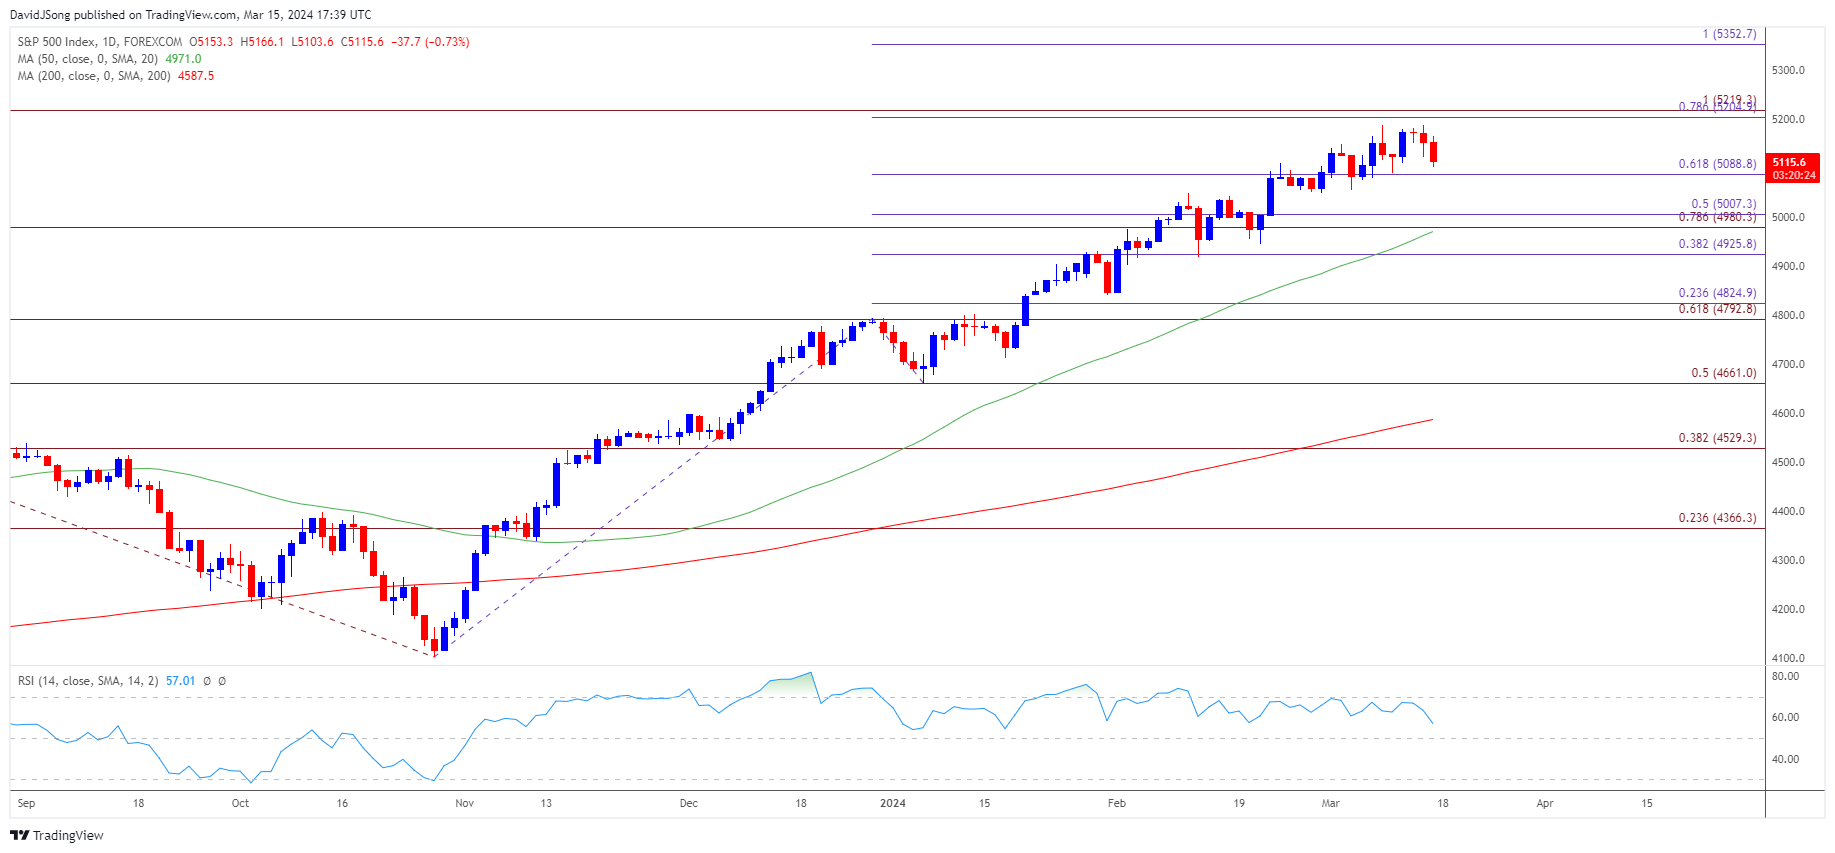
The S&P500 falls towards the weekly low (5091) to keep the Relative Strength Index (RSI) below 70, and the oscillator may continue to show the bullish momentum abating should it continue to move away from overbought territory.
Join David Song for the Weekly Fundamental Market Outlook webinar. David provides a market overview and takes questions in real-time. Register Here
US Economic Calendar

Looking ahead, the fresh forecasts coming out of the Fed may sway financial markets as the central bank is widely expected to keep US interest rates on hold, and it remains to be seen if the Federal Open Market Committee (FOMC) will continue to combat inflation amid the stickiness in the US Consumer Price Index (CPI).
In turn, the update to the Summary of Economic Projections (SEP) may produce headwinds for the S&P500 if the FOMC shows a greater willingness to keep US interest rates higher for longer, but hints of a looming change in regime may prop up equity prices as Chairman Jerome Powell tells US lawmakers that ‘it will likely be appropriate to begin dialing back policy restraint at some point this year.’
With that said, the S&P500 may consolidate ahead of the Fed rate decision amid the failed attempt to clear the monthly high (5189), but the index may track the positive slope in the 50-Day SMA (4971) as it continues to hold above the moving average.
S&P500 Price Chart – Daily

Chart Prepared by David Song, Strategist; S&P500 on TradingView
- The S&P500 approaches the weekly low (5091) after failing to clear the monthly high (5189), with the recent decline in the index keeping the Relative Strength Index (RSI) below 70.
- The RSI may continue to show the bullish momentum abating as it moves away from overbought territory, with a break/close below 5090 (61.8% Fibonacci extension) raising the scope for a move towards the 4980 (78.6% Fibonacci extension) to 5010 (50% Fibonacci extension) region.
- Next area of interest comes in around 4930 (38.2% Fibonacci extension), but the S&P500 may track the positive slope in the 50-Day SMA (4971) as it continues to hold above the moving average.
- Need a break above the monthly high (5189) to bring the 5210 (78.6% Fibonacci extension) to 5220 (100% Fibonacci extension) area on the radar, with the next region of interest coming in around 5350 (100% Fibonacci extension).
Additional Market Outlooks
US Dollar Forecast USD/JPY Attempts to Climb Back Above 50-Day SMA
US Dollar Forecast: GBP/USD Slips Below Former Resistance Zone
--- Written by David Song, Strategist
Follow on Twitter at @DavidJSong


