
S&P 500, Nasdaq, Dow Jones Talking Points:
- It was another strong week for stocks even with some headwind. There was a sizable pullback on Wednesday around the FOMC rate decision, and another on Friday after the really strong NFP report, which equities quickly shrugged off.
- While the FOMC may not yet be ready to cut rates, there’s been a tendency towards dovish Fed-speak and members of the FOMC are free to opine with the blackout being lifted after the recent rate decision. This could serve as some element of support in the event that pullbacks appear.
- Given the recent run in stocks it can be both difficult to chase near all-time-highs and also challenging to fade; but the potential for pullbacks remain.
If you could rewind to a week ago and tell a trader that the Fed would err on the hawkish side and then NFP would be a blow out with +353k jobs added in January, they would probably be very surprised to see indices in the green. But that’s what we have, and this illustrates the aggressive risk-on behavior that started to take over in late-October and then enveloped global markets in November and December. This is also a nod towards sentiment, where hopes for rate cuts brought bulls back to the table in Q4, and they still haven’t left despite the mounting evidence that they may not be nearby.
U.S. equities are very near all-time-highs. The unemployment rate in this morning’s Non-farm Payrolls report was at 3.7%, well below the natural rate of unemployment in the U.S. Inflation remains above target on an annualized basis and if investigating this collection of factors, one might think that rate hikes are on the way to buffer some of that demand. But that’s not the case, instead we’re talking about how many rate cuts the Fed might push this year and the big news item this week was that FOMC Chair Jerome Powell does not think that it’ll happen in March.
Of course, it’s the very premise of rate cuts that showed in the Fed’s projections last year, even as the Fed was hiking, that started to get the risk-on crowd excited. Forward guidance is relatively new in the grand scheme, as this came as a response to the Financial Collapse in 2008 and we haven’t really had a full rate hike cycle that’s transitioned into cuts. We did have a flare of hikes through 2018 that led to cuts in 2019; but that then led into the Covid pandemic when rates were jerked back to the floor. So in some ways, we’re still seeing how markets operate around a Fed pivot when given an abundance, and perhaps even an over-abundance, of guidance from Central Bankers.
The less-dovish Powell on Wednesday delivered a jolt to equity markets with indices spiraling into the close. But that didn’t last for long, as strong earnings reports from Amazon and Meta helped to drive the bullish theme into the end of the week, propelling the S&P 500 to another all-time-high into Friday trade. Meta has put in a whopping 21% more so far in early Friday trade and this isn’t for some small cap company, as their market cap has passed $1 Trillion; so we’re talking about hundreds of billions of dollars in freshly added market cap for a large-cap company. That’s not the type of behavior that you see in a bear market.
META Weekly Chart: 444.33% Trough-to-Peak in 15 Months
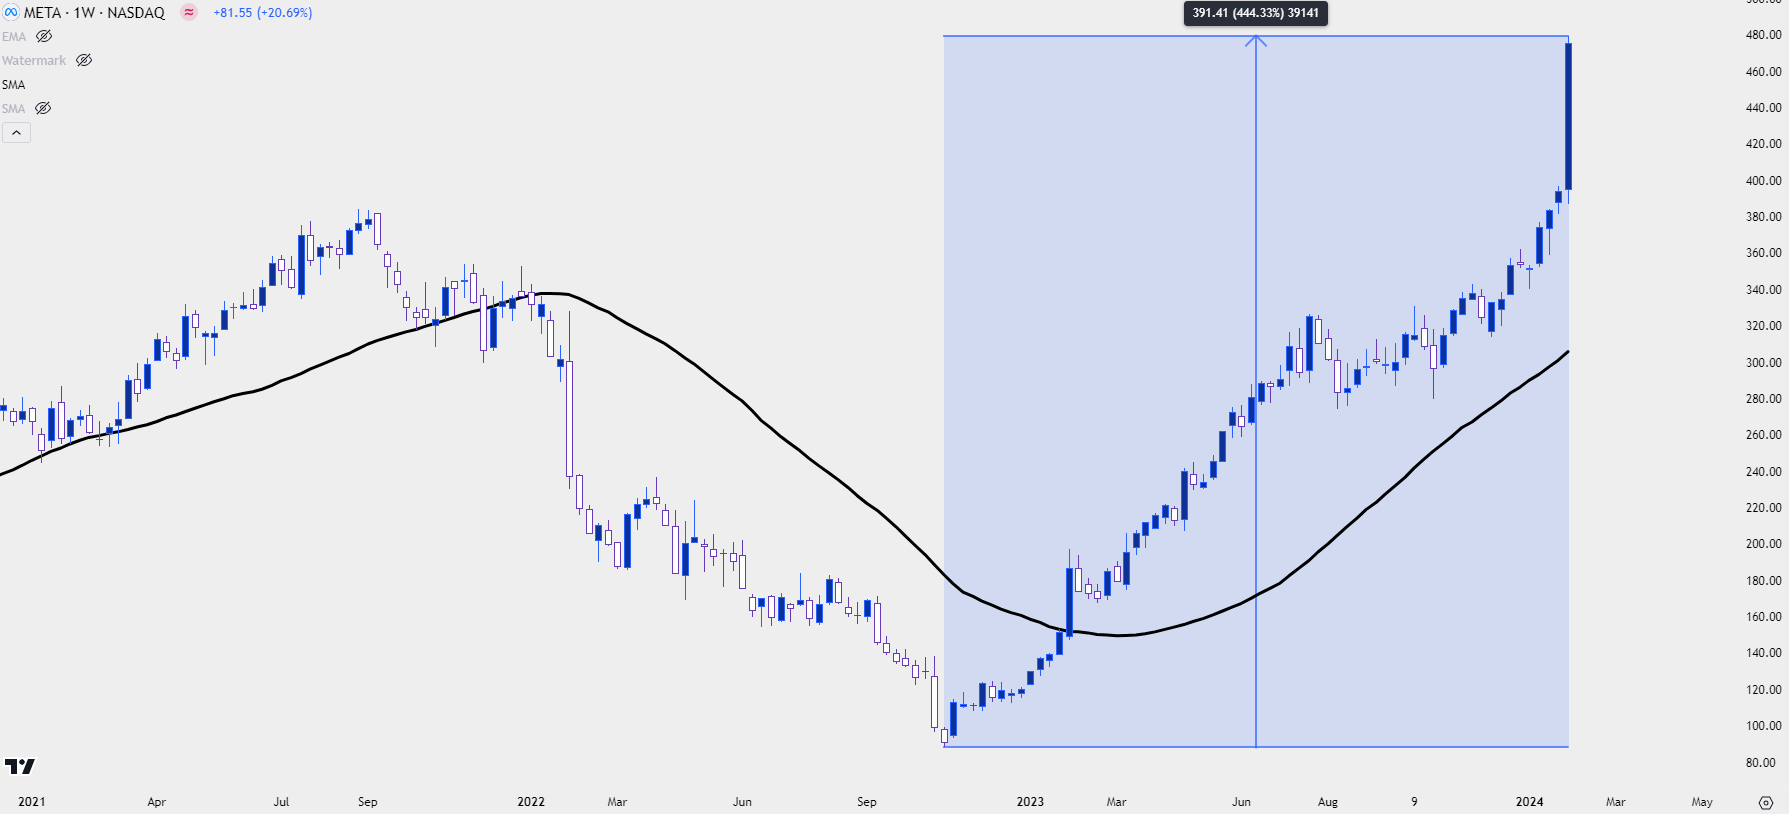 Chart prepared by James Stanley; data derived from Tradingview
As noted in the talking points this is a difficult to market environment to work with, largely because the move-higher has been so linear. Chasing presents challenge as we’re so far away from nearby supports that risk management is a challenge. And fading is difficult because this has been a freight-train chugging higher and it seems that the Fed is okay with that.
There could be scope for pullback, however. The RSI indicator has pushed back into overbought territory on S&P 500 futures on the weekly chart, and when this happened in the end of 2023 it led to a week of pullback. Now RSI is even more overbought and price has pushed deeper into all-time-high territory.
S&P 500 Futures - Weekly Price Chart
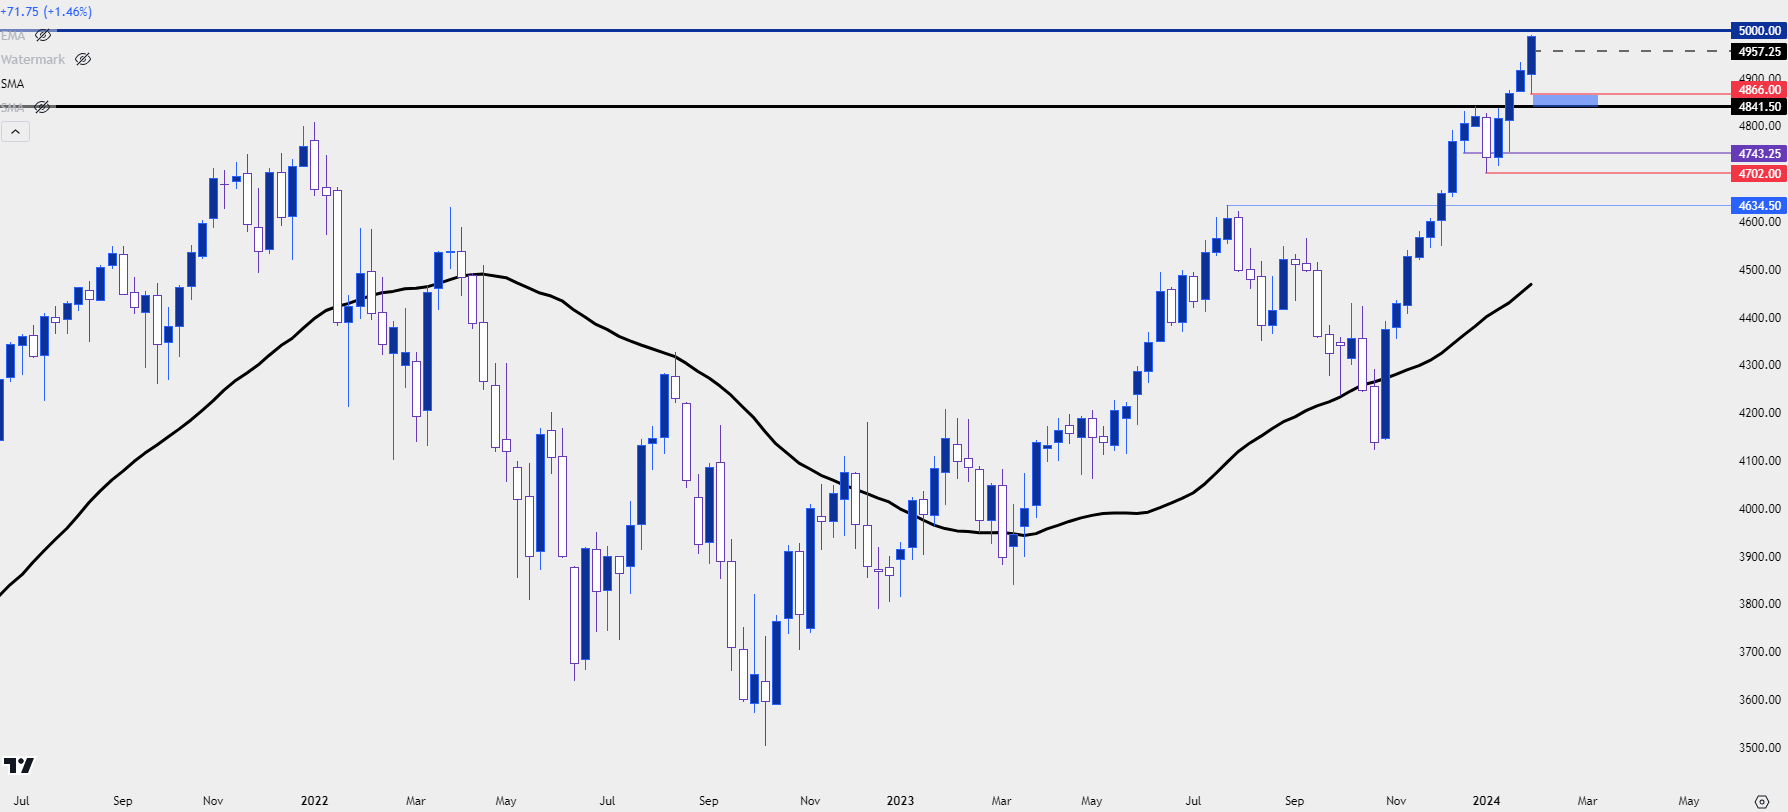 Chart prepared by James Stanley; data derived from Tradingview
From the daily chart we can gain a bit more perspective. Bulls are making a fast charge towards the 5k psychological level, as of this writing, and that could produce a pause point in the trend. Combine that with the fact that RSI has been diverging and that illustrates how a deeper pullback seems overdue.
The big question at that point is where a pullback might find support. This week’s low printed at 4866 and that can be synced down to the prior high at 4841.50 to create a support zone of note. That would be the spot that bulls would want to hold for themes of bullish continuation. Below that, there are swings at 4746 and 4702, with the former having a bit more reference given two swings produced at that level as opposed to the touch-and-go move at 4702 around NFP Friday last month.
S&P 500 Futures - Daily Price Chart
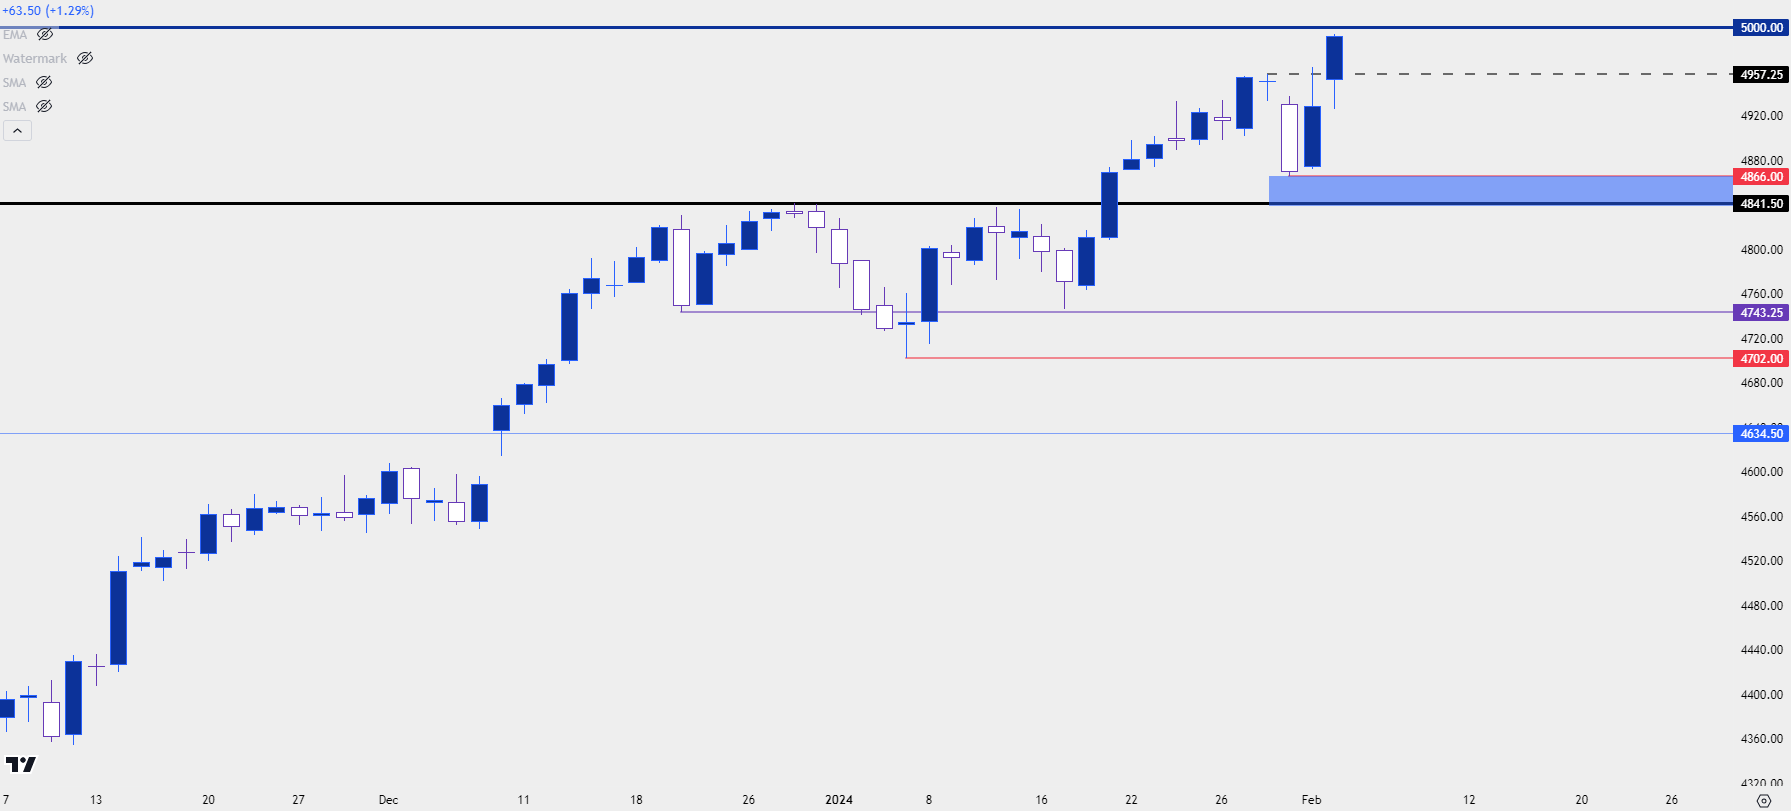 Chart prepared by James Stanley; data derived from Tradingview
Nasdaq 100
There’s a very similar feel in the Nasdaq 100 with the caveat that the strength showing here has been even more aggressive into last week. Given the tech-led rally and the outperformance of the Mag 7, this makes sense. But similarly, it sets up a challenge for traders as the immediate option set doesn’t appear to be great: Either chase a well-developed rally or try to fade what’s been a supercharged market.
With that being said, there’s been slightly greater respect of resistance at the highs in late-week Nasdaq futures trade, and that can similarly keep the door open for pullback potential.
There’s also some reference for possible resistance overhead that hasn’t yet traded. In the S&P 500 it’s the 5k handle and in the Nasdaq 100 it’s 18k, a mere ~1.2% above the prior high. For pullbacks, where bulls step in to hold the lows will be telling for the next phase of the trend. If buyers step in at the swing around 17,409, that would be an aggressive show of support. A bit deeper is a prior swing-high at 17,055 and that’s followed by a spot at 16,758 which is currently confluent with the 50-day moving average. A hold of support at any of those three areas could keep the door open for bullish continuation.
Nasdaq 100 Futures - Daily Price Chart
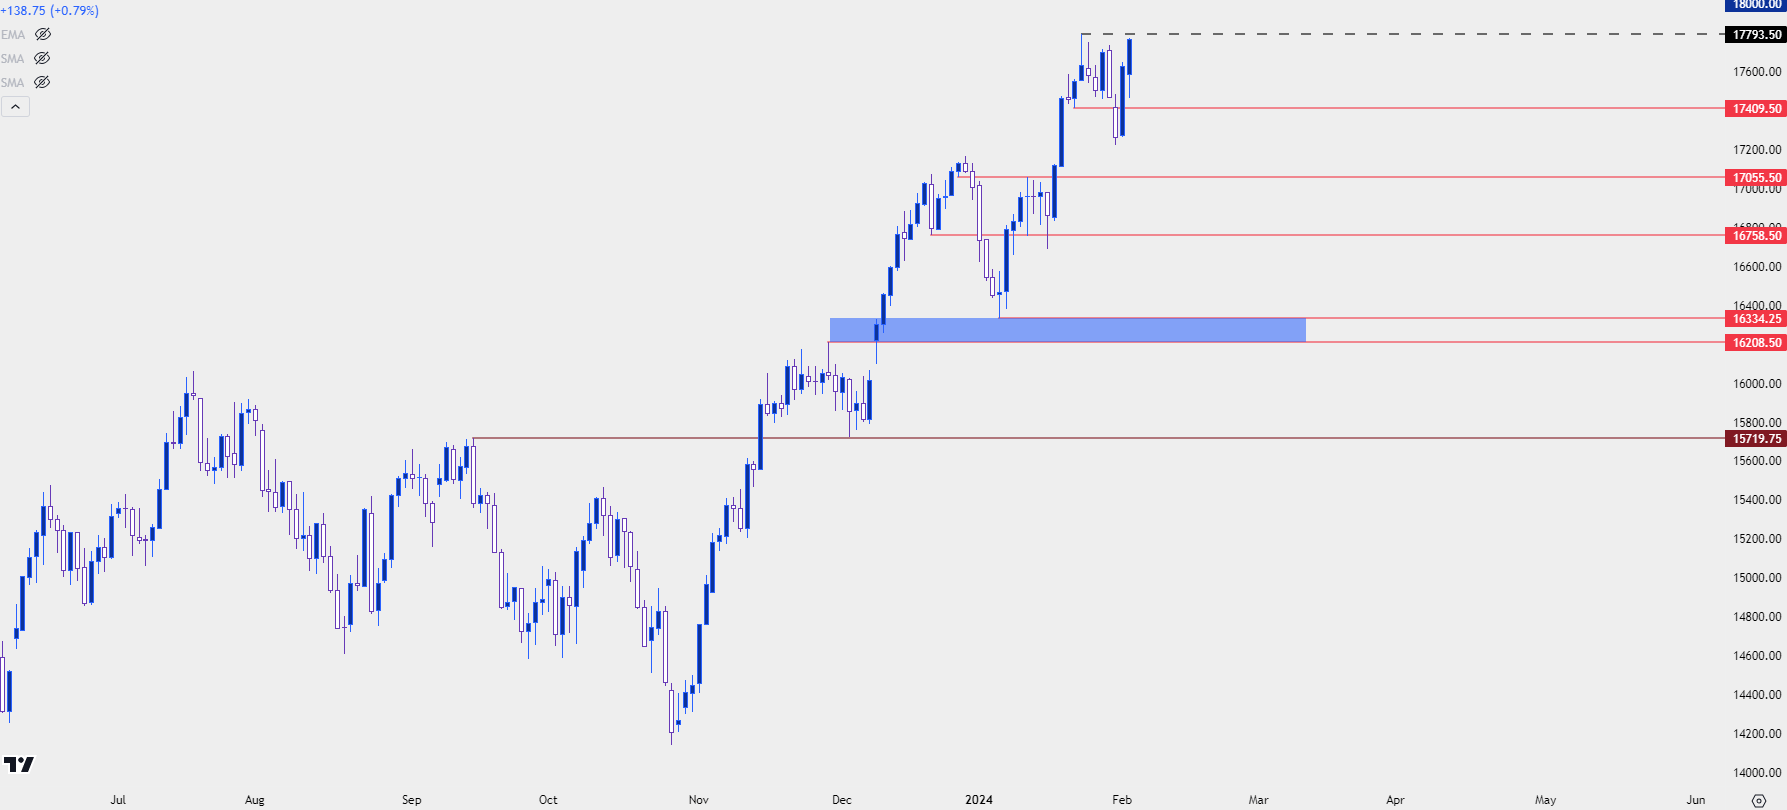 Chart prepared by James Stanley; data derived from Tradingview
Dow Jones
For those that are looking for a deeper pullback in equities, there could be scope for such in the Dow. Similarly, the index has marched up to fresh all-time-highs but there’s also been the build of a rising wedge formation. Those are usually approached with aim of bearish reversal, but the lower trendline needs to first break to open the door for such.
That was close last week. The trendline projection produced by the October and January swing lows came into play to hold support on Thursday morning, which led to another push up to fresh ATHs. The price where that took place remains important, as that was a spot of resistance-turned-support, and it plots at 38,253 in Dow futures.
Below that is another prior resistance swing turned support and that plots just below the 38k level at 37,946. And below that is a support swing that’s held two tests thus far, and that’s at 37,390. That’s approximately 3.68% from current price, so even a pullback there could keep the argument open for bulls to continue the broader trend. But, in that case the big question is whether the Dow is the optimal vehicle for a continued equity strength play, while the Nasdaq and S&P 500 could both make a stronger case for continuation.
Dow Jones Futures - Daily Price Chart
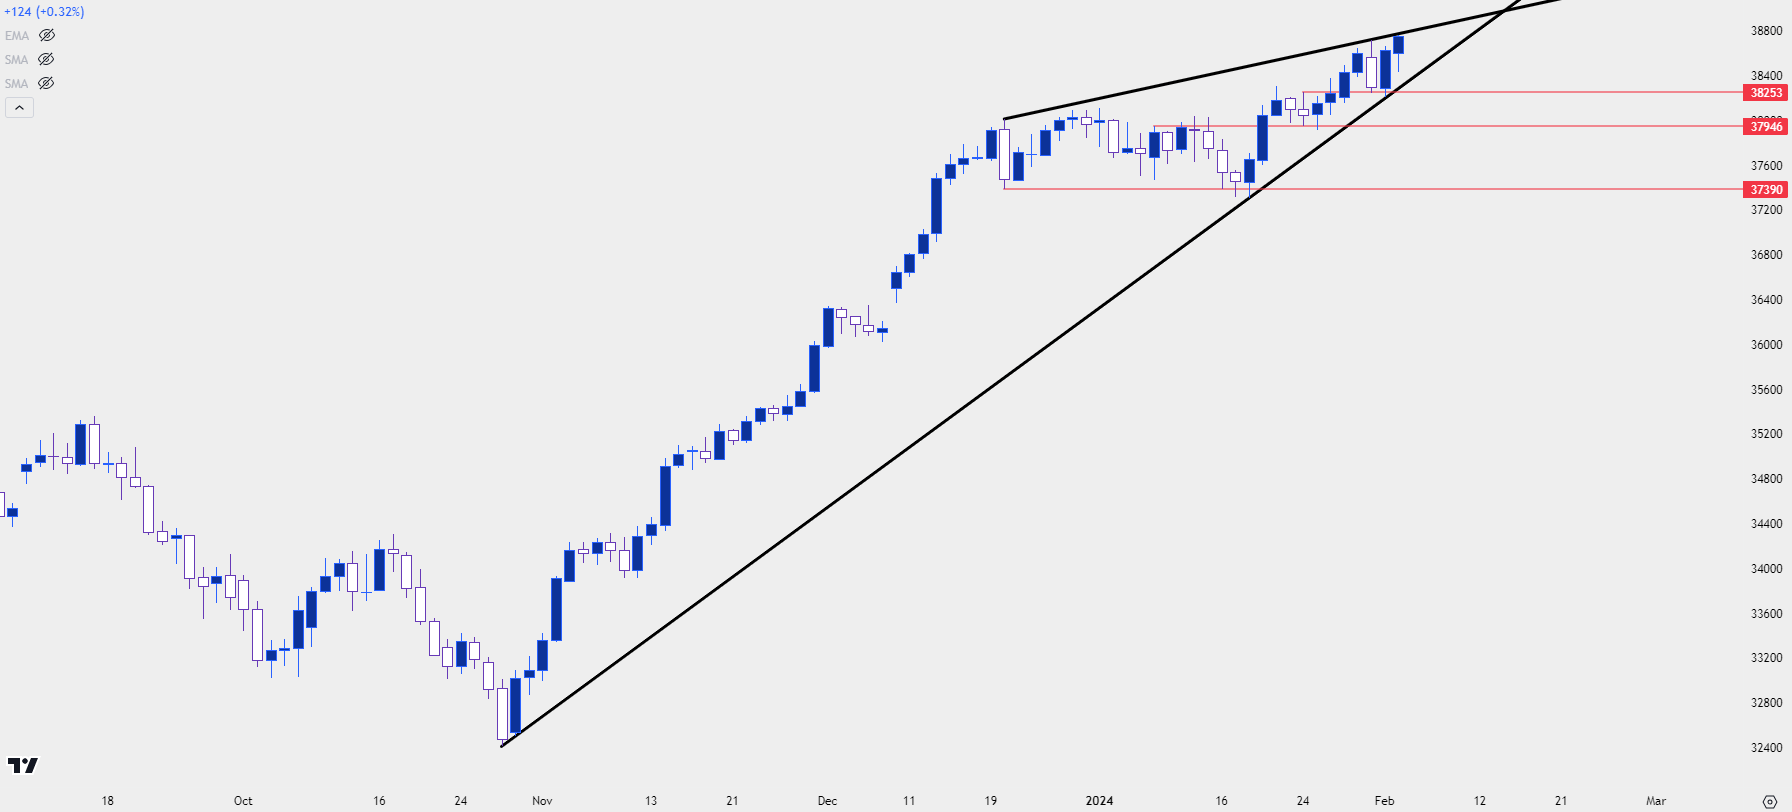 Chart prepared by James Stanley; data derived from Tradingview
--- written by James Stanley, Senior Strategist


