S&P 500 Technical Outlook: SPX500 Short-term Trade Levels
- S&P 500 breaks 2023 uptrend support, threatens deeper correction
- SPX500 near-term recovery vulnerable- risk for topside exhaustion / price inflection
- SPX resistance 4474, 4506/12 (key), 4544– support 4390, 4347, 4299-4308 (key)
The S&P 500 broke below uptrend support last week and while the index is up more than 3% off the lows, the SPX500 remains vulnerable to a deeper correction in the days ahead. A gap into the open today has been quickly faded and threatens to end the recent reprieve. These are the updated targets and invalidation levels that matter on the SPX500 short-term technical charts.
Review my latest Weekly Strategy Webinar for an in-depth breakdown of this SPX and more. Join live on Monday’s at 8:30am EST.
S&P 500 Price Chart – SPX500 Daily

Chart Prepared by Michael Boutros, Sr. Technical Strategist; SPX500 on TradingView
Technical Outlook: The S&P 500 broke below uptrend support on August 15th with an outside-reversal candle fueling a sell-off into the 23.6% retracement of the 2022 advance at 4347. A rebound of more than 3% off those lows is looking vulnerable here and the threat / focus is on possible topside exhaustion in the days ahead.
S&P 500 Price Chart – SPX500 240min

Chart Prepared by Michael Boutros, Sr. Technical Strategist: SPX500 on TradingView
Notes: A closer look at the index shows the SPX500 trading within the confines of a near-term ascending channel off the lows with price turning from the 50% retracement today at 4474. Confluent resistance is eyed just higher at 4506/12- rallies should be capped by this threshold IF price is heading lower on this stretch. Ultimately, a breach / close above the high-day close at 4544 is needed to mark resumption of the broader uptrend.
Initial support is eyed at 4416 (June high-day close / July low-day close) and is backed by the 61.8% Fibonacci retracement of the recent advance at 4390. A break / daily close below this threshold would threaten resumption of the monthly downtrend towards 4347 and the next major confluent support zone at 4299-4308- a region defined by the 38.2% retracement of the yearly range and the August high-day close. Look for a larger reaction there IF reached.
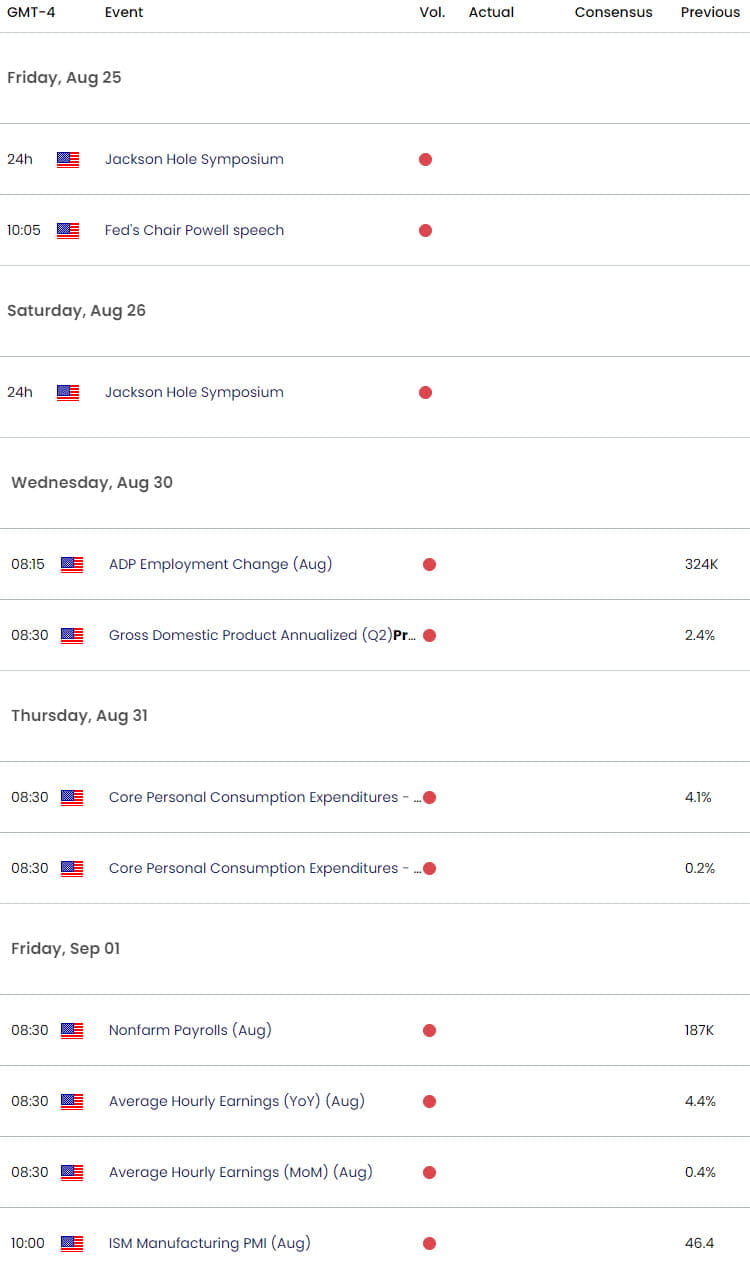
Bottom line: The S&P 500 has broken yearly uptrend support and this recovery remains vulnerable while below that slope (blue). From at trading standpoint, rallies should be limited to 4512 IF price is heading lower with a close below 4390 needed to mark resumption – look to reduce short-exposure / lower protective stops on a stretch towards 4300. Keep in mind, Fed Chair Powell is slated to speak tomorrow at the Jackson Hole Economic Symposium with key inflation data and Non-Farm Payrolls on tap next week- expect volatility and watch the weekly closes here.
Key Economic Data Releases

Economic Calendar - latest economic developments and upcoming event risk.
Active Short-term Technical Charts
- Crude Oil Short-term Outlook: Oil Spill Searches for Support
- Gold Price Short-term Outlook: XAU/USD Searches Support Sub-1900
- US Dollar Short-term Outlook: USD Rally Set to Snap
- British Pound Short-Term Outlook: GBP/USD Breakout Imminent
- Euro Short-term Outlook: EUR/USD Poised for August Breakout
- Canadian Dollar Short-term Outlook: USD/CAD Set to Snap 2023
--- Written by Michael Boutros, Sr Technical Strategist with FOREX.com
Follow Michael on Twitter @MBForex


