
It continues to be a challenging period for the silver market in the short term, as the precious metal remains under pressure and keeps posting new lows on a consistent basis. Over the last five trading sessions alone, silver has fallen nearly 12%, a move that has highlighted a strong bearish bias not seen in the market for several months. For now, this selling pressure appears to be driven by silver’s growing sensitivity to alternative markets that have become increasingly attractive to investors. As other assets continue to offer more favorable conditions, bearish momentum has strengthened steadily, a dynamic that could continue to weigh on silver prices over the coming sessions.

Is Demand Struggling to Remain Stable?
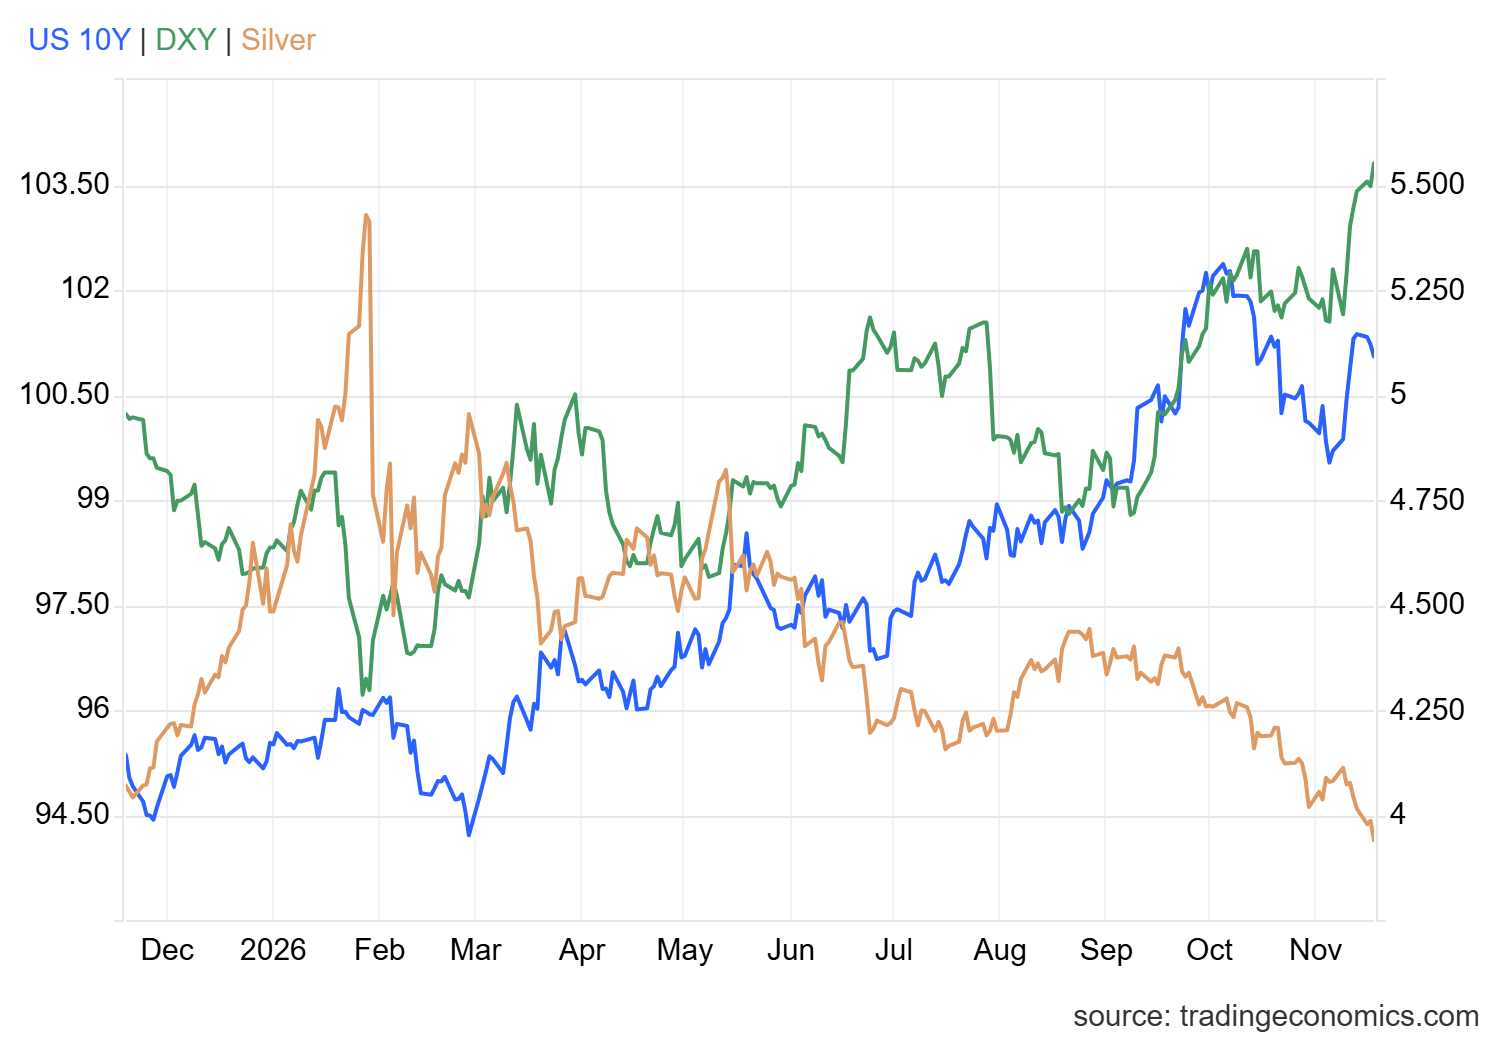
One of the most important developments in recent sessions has been the performance of the U.S. dollar and the bond market, two assets that often compete with silver within the safe-haven space. Both markets have become increasingly attractive as investors continue to price in the possibility of a more aggressive Federal Reserve heading into year-end, with interest rates potentially remaining elevated for longer than previously expected.
This dynamic has been reflected in U.S. 10-year Treasury yields, which continue to hold above the 5.0% level, as well as in the strength of the DXY Index, which has climbed above 103 points and continues to post fresh highs for 2026. Taken together, these developments suggest that both the bond market and the U.S. dollar continue to maintain an important relative appeal in the near term.
Source: TradingEconomics
This backdrop is particularly relevant for silver because the metal does not generate interest or dividend income. As bond yields remain elevated, the opportunity cost of holding silver increases relative to other assets. In addition, because silver is priced in U.S. dollars, a stronger dollar can make the metal more expensive for buyers using other currencies, a factor that may also be limiting demand. As a result, silver has continued to display a fairly clear inverse relationship with the strength seen in these markets over recent weeks.
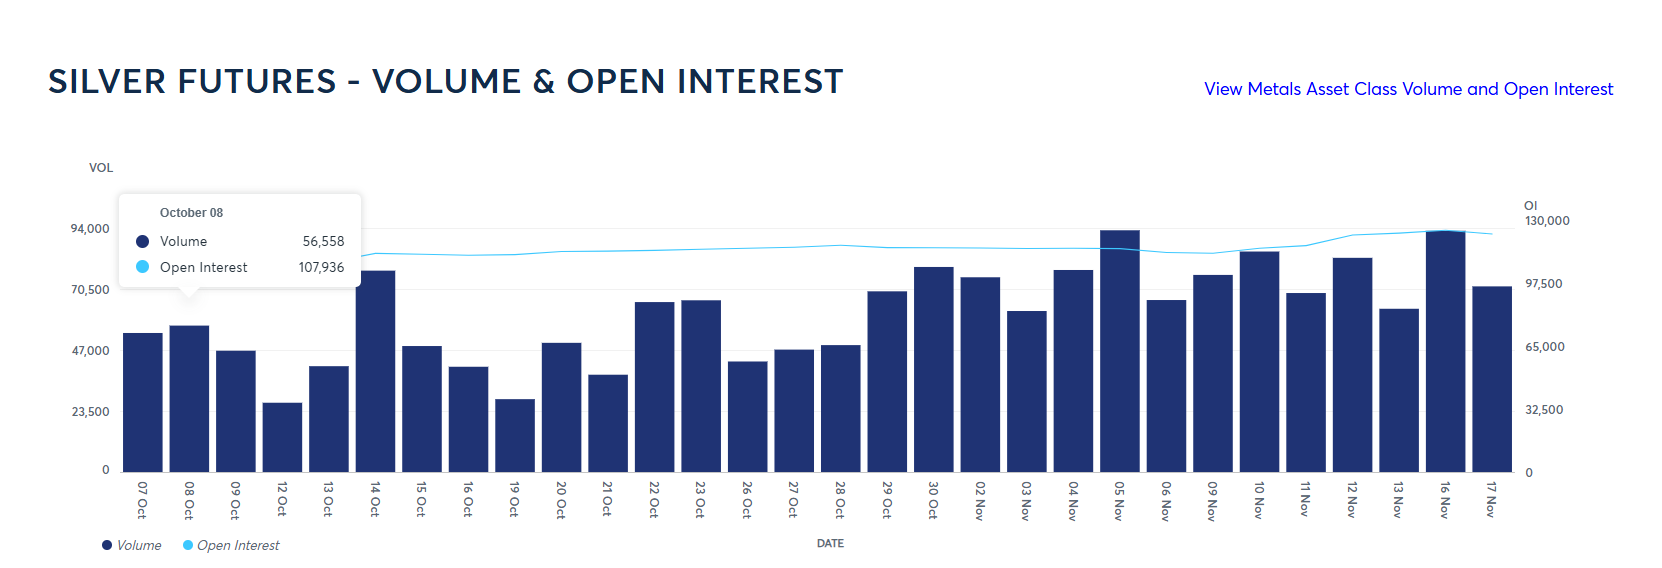
This pressure has also begun to show up in futures market activity. Average daily trading volume in silver futures has remained above 70,000 contracts, comfortably exceeding the levels observed in mid-October. However, the most striking development continues to be the behavior of the Open Interest indicator, which has now risen to nearly 123,000 contracts, reaching its highest level in several months.
The recent increase in Open Interest, combined with the sustained decline in silver prices, suggests that new short positions are continuing to enter the market. This situation highlights the metal's growing sensitivity to the current macroeconomic environment and to the possibility of a more restrictive Fed before the end of the year.
Source: CMEGROUP
With all of this in mind, the release of the latest Federal Reserve meeting minutes will be one of the key events of the session. If markets continue to reinforce expectations of a more aggressive central bank and this further supports the U.S. dollar and bond yields, silver could continue facing difficulties in regaining ground consistently. As a result, selling pressure in XAG/USD may remain a key feature of the market over the coming sessions.
Silver Technical Forecast
Source: StoneX, Tradingview
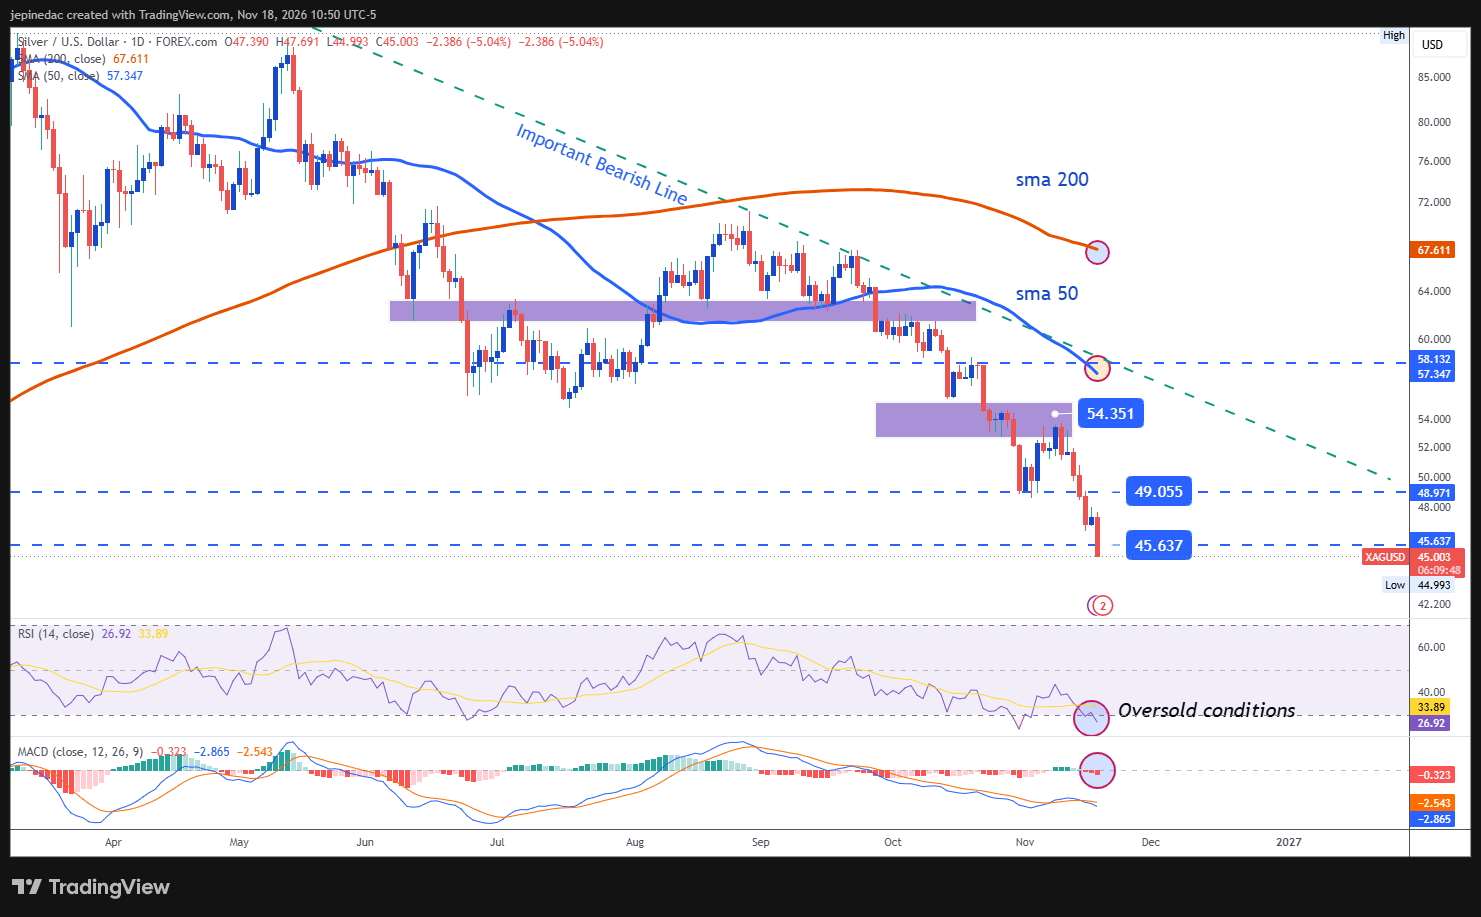
- The bearish trendline continues to gain relevance: Since the first months of 2026, silver has developed a relatively consistent bearish structure that has allowed a major long-term downward trendline to form. So far, no meaningful recovery has emerged to challenge this structure, leaving the trendline as the most important technical pattern on the chart. In fact, prices are already challenging key downside levels and, if selling pressure remains firmly in place, an even steeper bearish trend could begin to develop in the weeks ahead.
- MACD: Now, the MACD histogram continues to move deeper below the indicator’s zero line. This suggests that bearish momentum remains increasingly relevant across short-term moving averages, highlighting that the bearish bias continues to dominate and could remain important over the coming sessions.
- RSI: The RSI is showing a similar reading, remaining below the neutral 50 level. However, the indicator is now approaching the 30 oversold threshold, a situation that could warn of excessive recent selling pressure and potentially open the door to bullish corrective moves over the next few trading sessions.
Key Levels to Watch:
- $54 - Critical Resistance: This level corresponds to the highs reached in previous weeks and is located near the 50-period simple moving average. Price action returning to this area could begin to highlight a broader lack of direction and potentially open the door to a more significant period of consolidation during the coming weeks, a scenario that could even challenge the current long-term bearish trend.
- $49 - Nearby Barrier: This area represents recent pullback levels and remains one of the most relevant short-term references on the chart. It could become the key level to monitor should bullish corrective moves begin to develop in the coming sessions.
- $45 - Critical Support: This level corresponds to lows not seen since October 2025 and currently stands as the most important downside barrier on the chart. Price action that manages to establish itself consistently below this level could significantly reinforce bearish control and favor a further extension of the downtrend in the weeks ahead. It could also open the door to a more accelerated bearish phase in the short term.
Written by Julian Pineda, CFA, CMT – Market Analyst
Follow him on: @julianpineda25