
US Dollar Talking Points:
- The US Dollar has traded higher in Q2: April was strong but May retraced almost the entirety of that move, helped along by cooling CPI. But strength re-appeared in June with a boost around Non-farm Payrolls and then another at the FOMC rate decision a week later.
- The big question for Q3 remains rate cuts: When will the Fed be able to start them and how aggressive can they get? Will Europe go for another before the Fed? And how will the Bank of Japan handle the quagmire that’s enveloped the Japanese Yen? At this point U.S. data remains relatively strong and this has continued to bring to question rate cut timing.
- Markets are currently expecting cuts to begin in September, so this is a question to be answered in Q3 as we move towards the U.S. Presidential Election in Q4.
Another quarter has come and gone and there’s been no rate cuts from the Fed yet. U.S. data has remained incredibly resilient, all factors considered, and this has kept the Fed from loosening policy to this point. We did see rate cuts kick off in Europe, but that came with an evasive posture towards future moves and that’s constrained volatility in the EUR/USD pair. But as we move into the second-half of the year politics becomes a primary driver as we’re nearing elections in the Euro-Zone and then later in the year, another general election in the United States.
Fed dovishness had a large impact on the US Dollar in Q4 of last year; but so far this year strength has been the name of the game as five of the first six months have finished in the green. The notable exception was the month of May, where lower-than-expected CPI and a dovish FOMC meeting at the beginning of the month pushed DXY back down to support. This essentially made the first two months of Q2 a ‘null’ in DXY, but strength returned in June, with a boost on NFP and then from a hawkish twist at the FOMC meeting a week later.
From the monthly chart, we can see that confluent support that held the lows in Q2 after showing as resistance in Q1.
US Dollar Monthly Price Chart
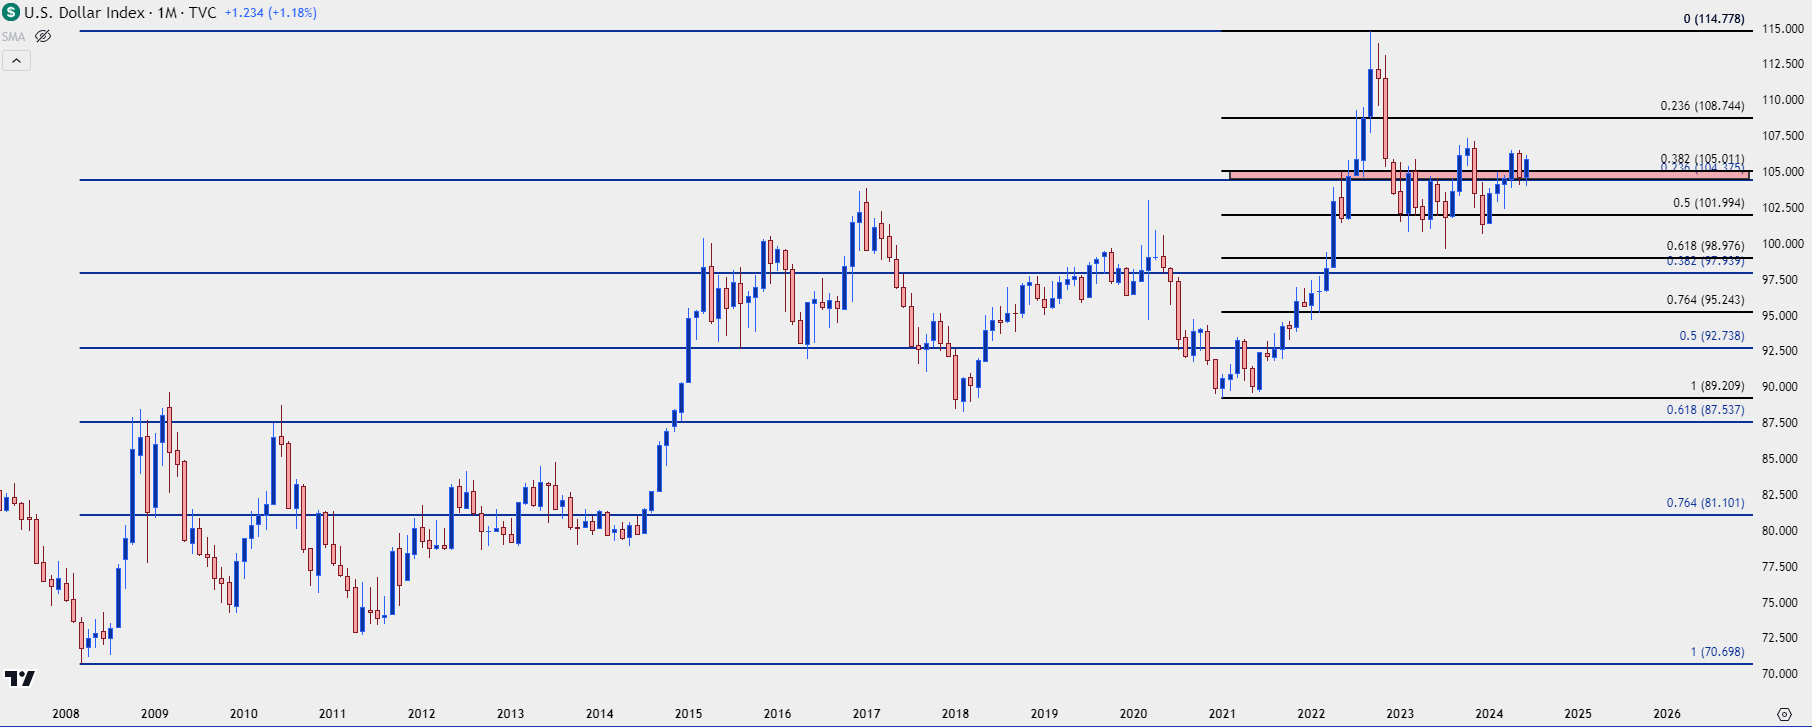 Chart prepared by James Stanley; data derived from Tradingview
USD Weekly
From the weekly chart we can get a bit more perspective on the pullback in the month of May as there were a couple of different technical items of note.
The FOMC rate decision was on the first day of the month, and that’s when the USD was threatening breakout of the 106.50 level that had held the highs in April, coming into play a few days after the April CPI report. The Fed sounded dovish at that meeting and the USD responded by snapping back. At that point, there was a double top formation given the two holds at 106.50, and that filled in and completed after the May CPI report finally showed some softening in Core CPI.
But, as you can see from the chart, bears couldn’t sustain a breach of the 200-day moving average, which then went on to hold support for five consecutive weeks. What finally helped to push price off of that support was the FOMC rate decision in June, and that meeting was a quarterly rate decision, so it came along with projections. In the dot plot matrix, the Fed cut their forecast for cuts this year, looking for one to two against the prior expectation of two to three that was shared in March.
That helped to boost the Greenback as prices made a run back to the 106.00 handle. This retails bullish potential in the USD as we move into the second-half of the year; but as always, we have to look to counterparts for trend potential as the US Dollar is simply a composite of underlying currencies.
US Dollar Weekly Price Chart
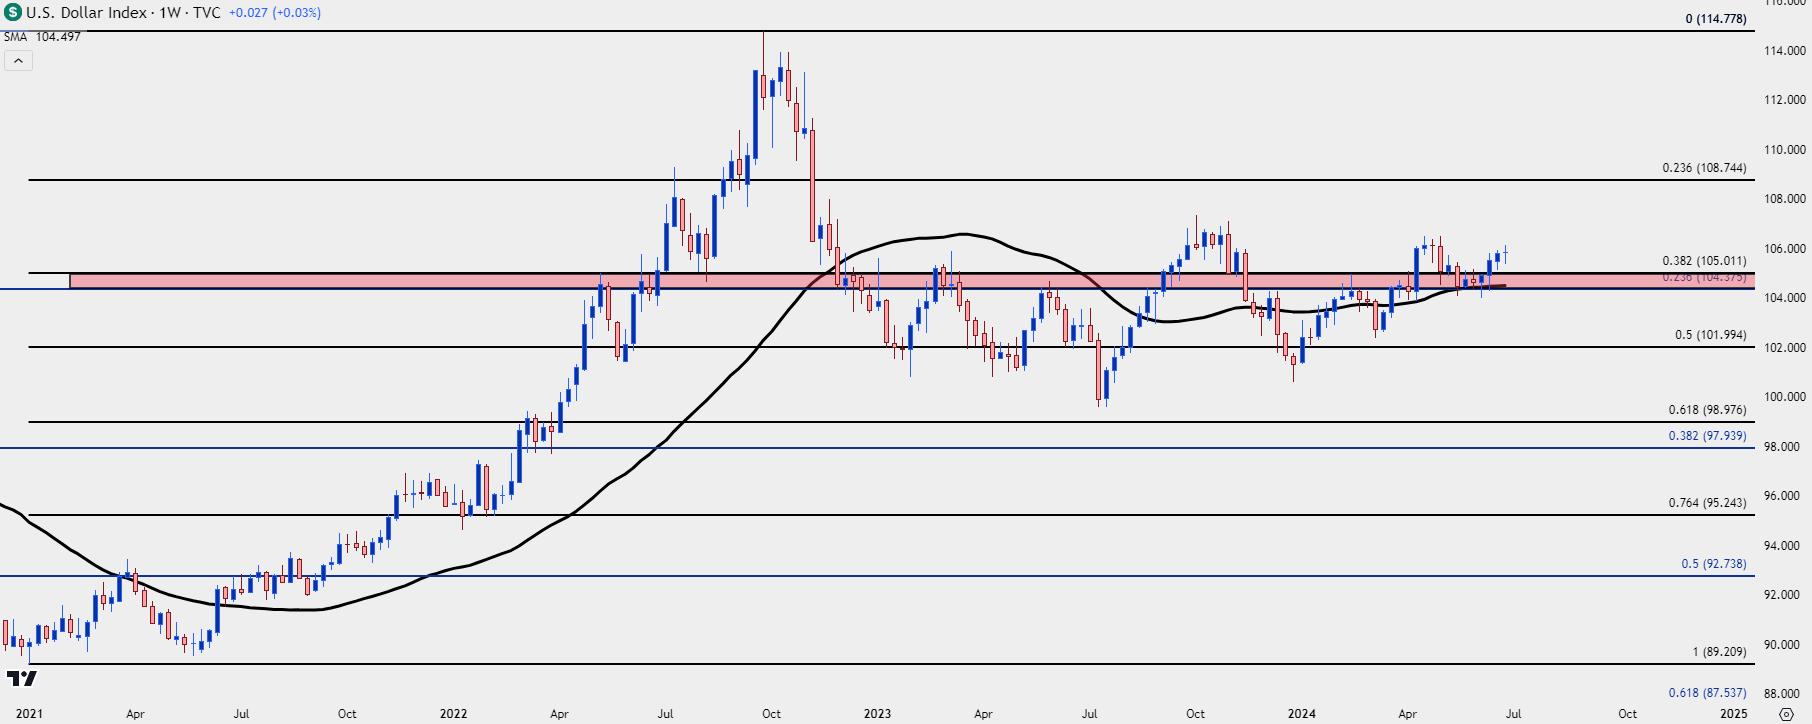 Chart prepared by James Stanley; data derived from Tradingview
USD Daily
From the daily chart the bigger picture range becomes more evident and this is a matter of importance for Q3, and this is also something that speaks to the current backdrop in EUR/USD.
I wrote about this in yesterday’s article on EUR/USD, along with some history and background as to why we may be seeing this range. The Euro is a 57.6% allocation into the US Dollar, so it’s difficult for EUR/USD to trend without at least some participation from the US Dollar (and vice versa). And if we’re in a backdrop of aggressive trend in either, there can be consequence for both economies, such as we saw in 2021 and 2022 when EUR/USD was falling fast to and through the parity level.
As the Euro weakened, Euro-zone inflation heated up, forcing the ECB to hike rates more aggressively which then endangers growth in the bloc. Far more desirable for central bankers is an element of stability in the currency pair and ever since the ECB responded to that sub-parity test with a spate of rate hikes, that’s what we’ve had. Both EUR/USD and USD have been range bound for 18 months now.
And, interestingly, each time DXY has pushed towards resistance, such as last November or this May, the Fed has sounded very dovish which has helped to push the currency back down while continuing the range. That remains an issue for Q3 as the USD nears-retest of the bearish trendline taken from those two highs: Can the USD force a breakout and push into a bigger-picture trend?
Again, this will probably need some participation from the Euro, which I’ll look at next.
US Dollar Daily Price Chart
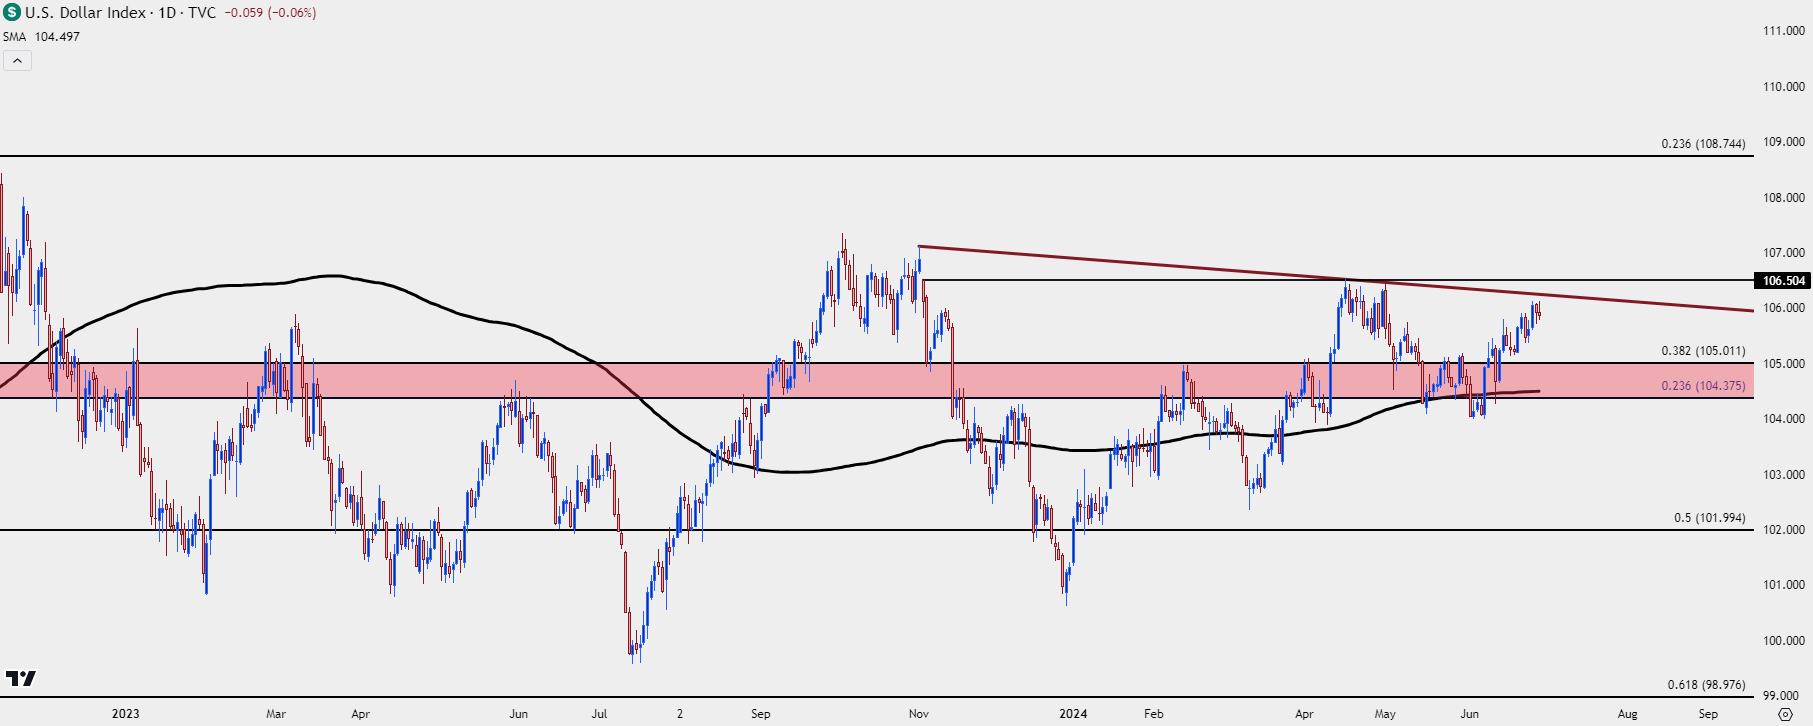 Chart prepared by James Stanley; data derived from Tradingview
EUR/USD
EUR/USD spent pretty much all of last year in a range. There was hope for breakout, however, with the early-July breakout that ended up quickly being faded. That’s when the USD struck a streak of 11 consecutive weekly gains, which is somewhat rare.
But – after EUR/USD put in a test at the 1.0500 handle, the sell-off was over and there were no weekly closes below that big figure last year as it remained well-defended. That led to a bullish move that lasted into the end of 2023, after which USD-strength and Euro weakness took back over.
There was a general sense of weakness in the pair and in the Euro for the first three-and-a-half months of the year. But, as price moved closer to that range support the selling slowed, with the Fibonacci level at 1.0611 helping to set the low for Q2 trade.
So far this year, not only as EUR/USD been range-bound, but it’s also been showing compression within the range with price coiling tighter and tighter, showing both lower highs and higher lows. This is the type of setup that can lead to breakout.
EUR/USD Weekly Price Chart
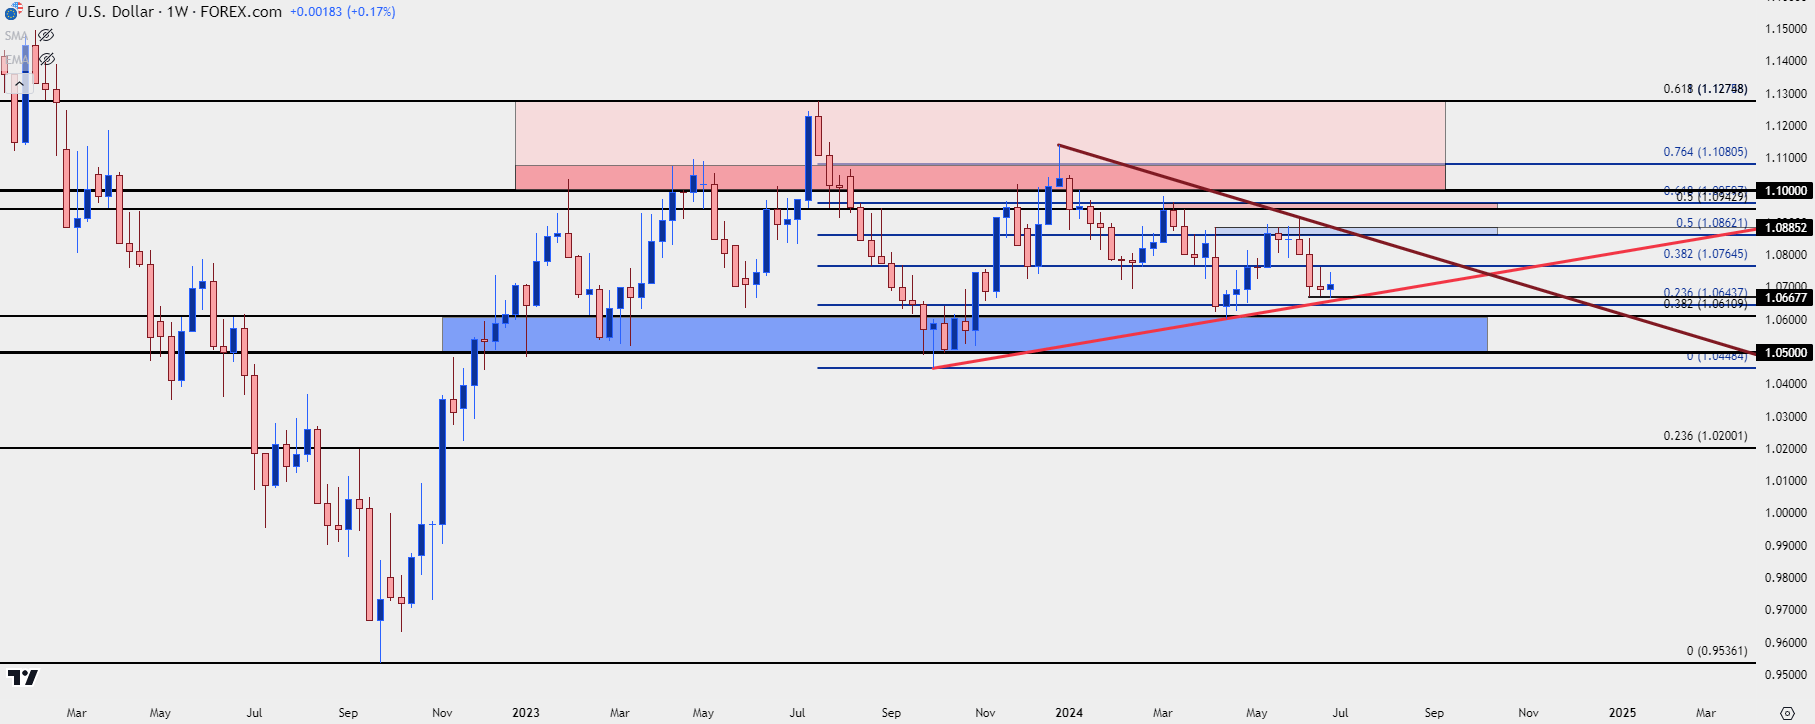 Chart prepared by James Stanley, EUR/USD on Tradingview
EUR/USD Daily
At this point there’s been a few different cases of divergent data between the US and Europe. But central banks in both have appeared to be on the same page, with the ECB sounding slightly hawkish as the Fed sounded dovish and vice-versa. That’s helped to build that range over the past 18 months and ever since the ECB came to the table with 75 bp hikes in late-2022, EUR/USD has struggled to hold below the 1.0500 handle.
If there is a break to be had, it’s probably going to need to come from something other than divergent central banks. Data could do it, and politics possibly could, too, as we’re nearing a pensive part of the political cycle in Europe with elections on the horizon.
But, from a price action perspective, structure must be respected until the market gives reason otherwise, and for now we have range compression. Key supports to track for Q3 are initially the 1.0668 support that held the lows in late-June, with Fibonacci levels at 1.0643 and 1.0611 below that. The Q2 low plots right at 1.0601 and below that is the psychological level of 1.0500.
For resistance, there’s a Fibonacci level overhead at 1.0765 and the 200-day moving average remains of consideration, as that functioned as both resistance and support in Q2 and that currently plots at 1.0787. The 1.0862-1.0885 zone plots above that and this was a difficult spot for bulls for almost a full month, coming into play after the May US CPI report and remaining in-play until the June NFP report.
EUR/USD Daily Price Chart
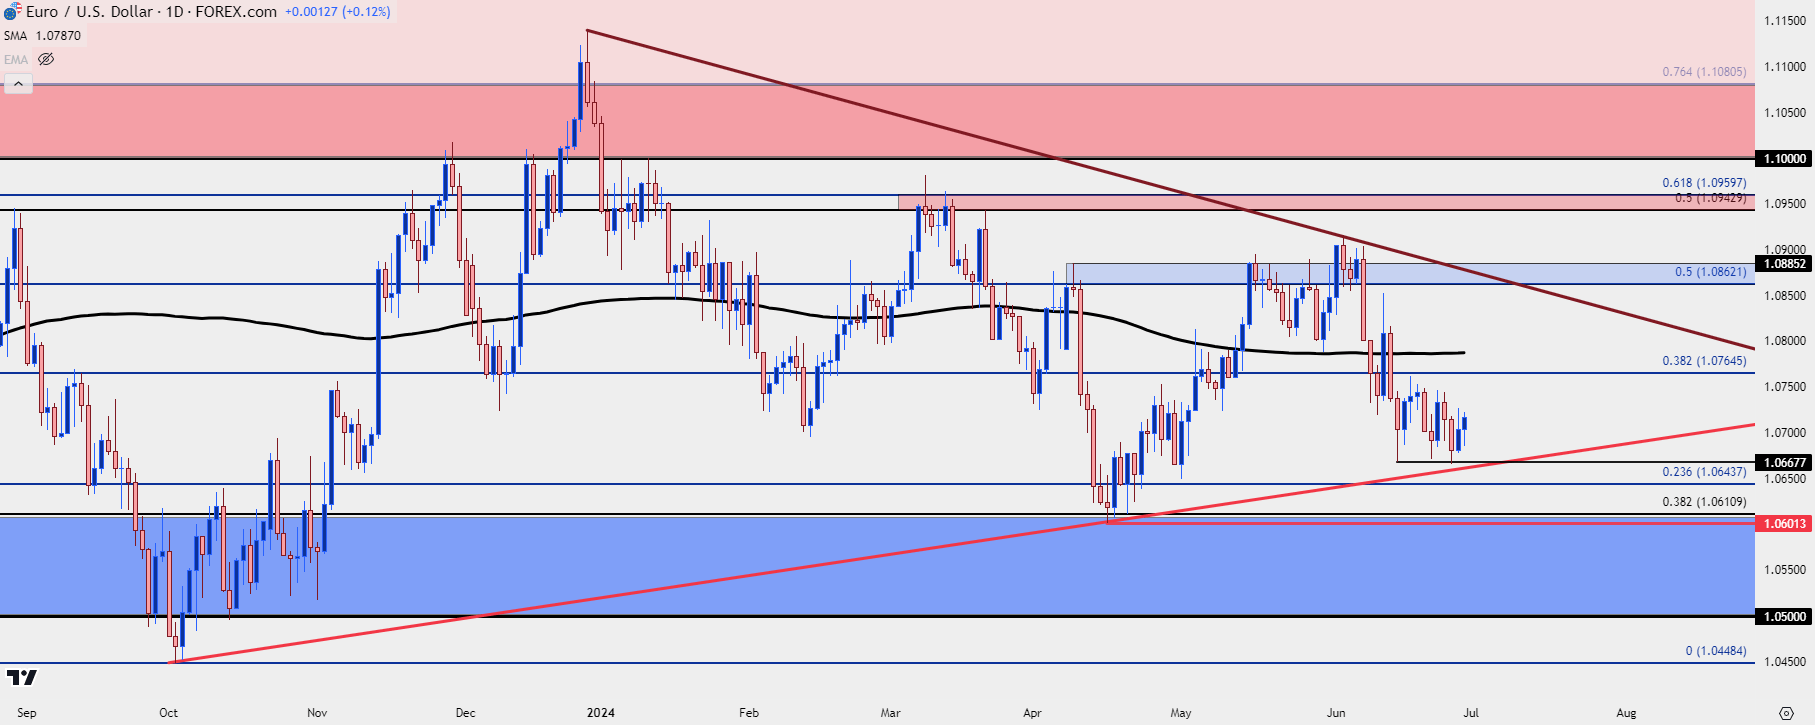 Chart prepared by James Stanley, EUR/USD on Tradingview
USD/JPY
The big FX story from Q2 was USD/JPY. And that story isn’t over yet as the drama extends into Q3 and H2 of 2024.
The Bank of Japan hiked rates for the first time since 2007 in March, just ahead of the Q2 open. And the currency pair did not sell-off, instead sticking very close to the 152.00 handle that the BoJ had previously defended.
And as I wrote at the time, given the very clear resistance that had, to that point, remained defended, there were likely a plethora of stops sitting overhead. Stops on short positions are ‘buy to cover’ logic, and often set up to execute ‘at best.’ This means if there’s a fast market and there’s no sellers sitting on the other side to offer liquidity, price could continue to stretch until, eventually, somebody steps in to sell.
This is a common mechanism for breakouts, and this is also a culprit behind slippage. The design of the order is to get out, even if at a worse price.
That’s what hit on April 10th, just after the US CPI report. Prices tested a fresh high after the data printed as USD-positive, and that started a breakout that didn’t slow down until later in the month when the 160.00 handle came into play. And even that was an exogenous item as it was the Bank of Japan stepping in to intervene that finally stalled the move and cauterized some resistance that could hold.
USD/JPY Weekly Price Chart
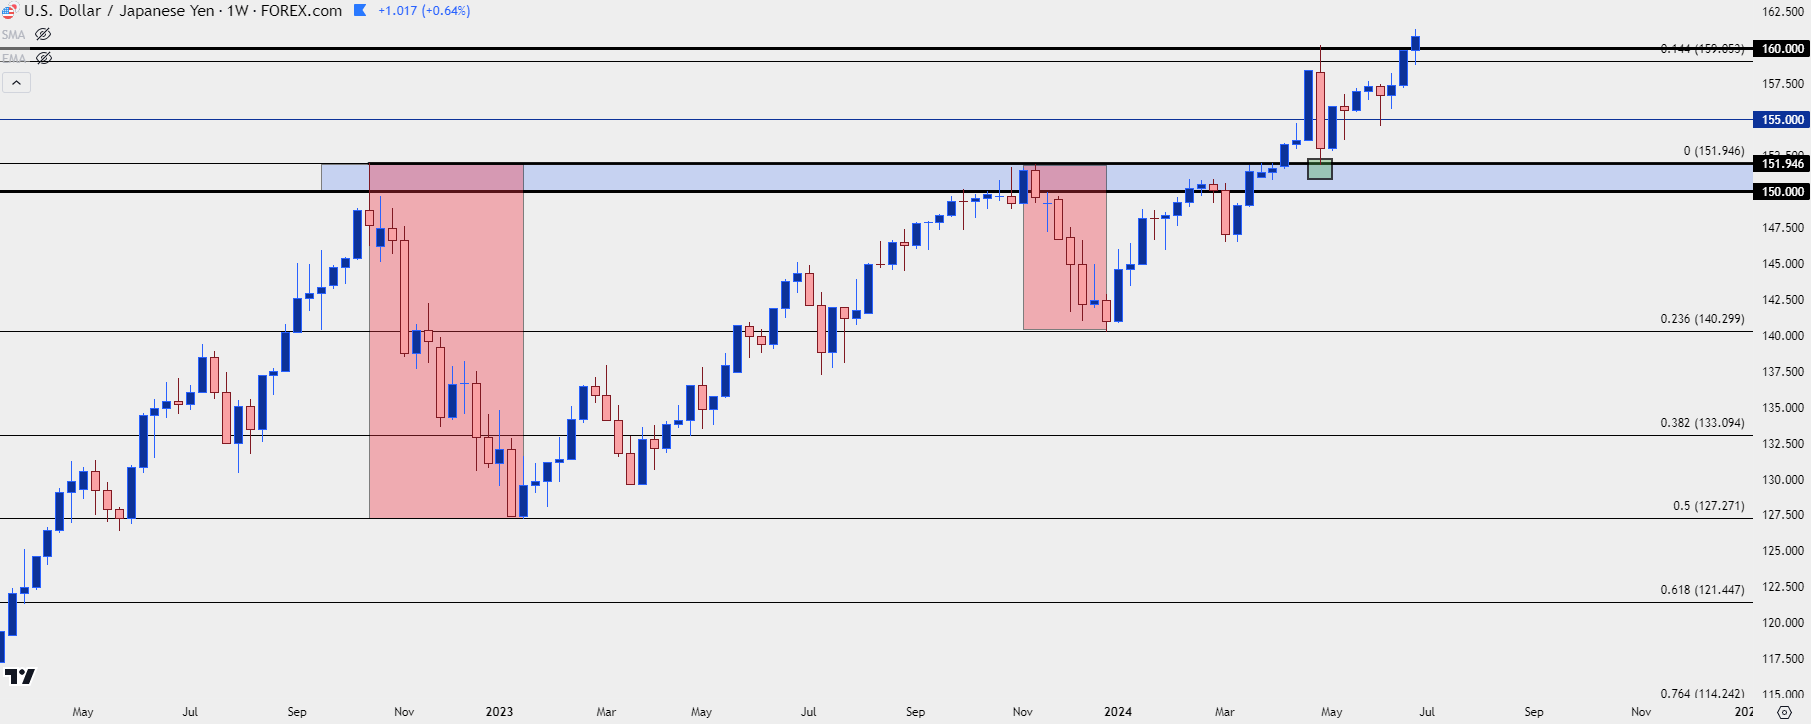 Chart prepared by James Stanley, USD/JPY on Tradingview
USD/JPY Daily
At this point, it’s safe to say that the BoJ’s April intervention was a failure. They burned $62 billion in finite FX reserves to buy down a currency that their own policy was pushing lower. This seems like eating a bag of potato chips while running on the treadmill…
That weakness in the pair could only last for a week, with support showing at prior resistance on the morning of NFP in May, and bulls then returned to push price right back to the 160.00 handle before the end of the month.
The carry remains positive on the long side of the pair and negative on the short side of the pair, so there remains incentive for bulls while bears are disincentivized from holding, and as long as that remains the case there’s an argument for a bullish bias. The way to address the situation would appear to be modifying monetary policy so that deviation wasn’t so wide, but there’s consequence to that, too, as the Bank of Japan has built a massive portfolio of Japanese Government Bonds after their years of yield curve control.
The fact that the BoJ hasn’t addressed this yet makes me think that they’re not as bothered by the falling Yen as many expect. Currency weakness can be a benefit for an export-heavy economy as it can help to bring economic growth, and for a country with the demographic conundrum such as Japan, that might be the lesser evil.
What could ultimately prod a reversal is a shift in the USD which would likely need to be accompanied by softening US data and a higher probability of near-term rate cuts. That could start to soften the carry which could then compel those that have ridden the trend on the back of the carry to second-guess their positions.
As a case in point, the two larger pullbacks in the trend over the past few years came along with USD-weakness as pushed by below-expectation CPI reports in November of each of the past two years.
If there is another intervention, it seems as though it would be another pullback setup until something on the monetary front shifts. If we do see weakness show in the USD in Q3 on the back of data and FOMC expectations, carry unwind can be aggressive as we saw with the 2,400+ pip pullback in 2022 and the 1,000+ pip sell-off in 2023.
USD/JPY Daily Price Chart
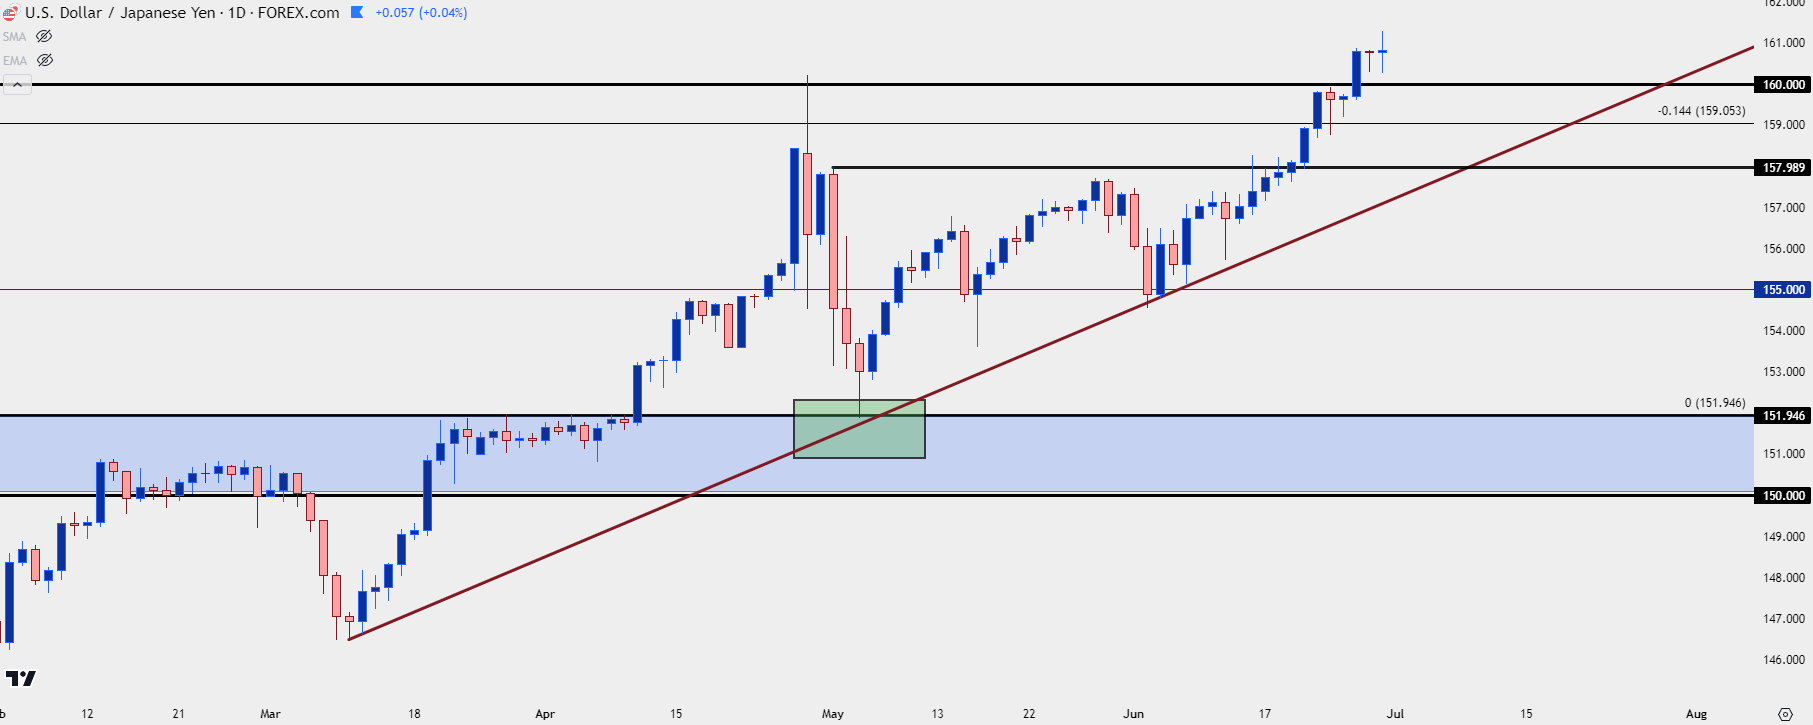 Chart prepared by James Stanley, USD/JPY on Tradingview
Gold
It’s been a range-bound quarter for Gold. The metal put in a significant jump in March, finally leaving behind the $2,075 resistance that had helped to hold highs for the three-and-a-half years prior.
There was an attempted breakout in December, which failed. The pullback from that held support at the $2k psychological level and as the Fed said that they were looking for two to three cuts in 2024, Gold prices held on to a major breakout that pushed through $2,300 and eventually $2,400. But price was unable to hold above the latter level and that showed in both April and May, exposing wide upper wicks on the monthly bars below. June has been tamer, with price showing considerable indecision; but a key observation is the fact that $2,300 has so far held support and despite those wide upper wicks, bears have so far been unable to muster a deeper pullback scenario.
Gold (XAU/USD) Monthly Price Chart
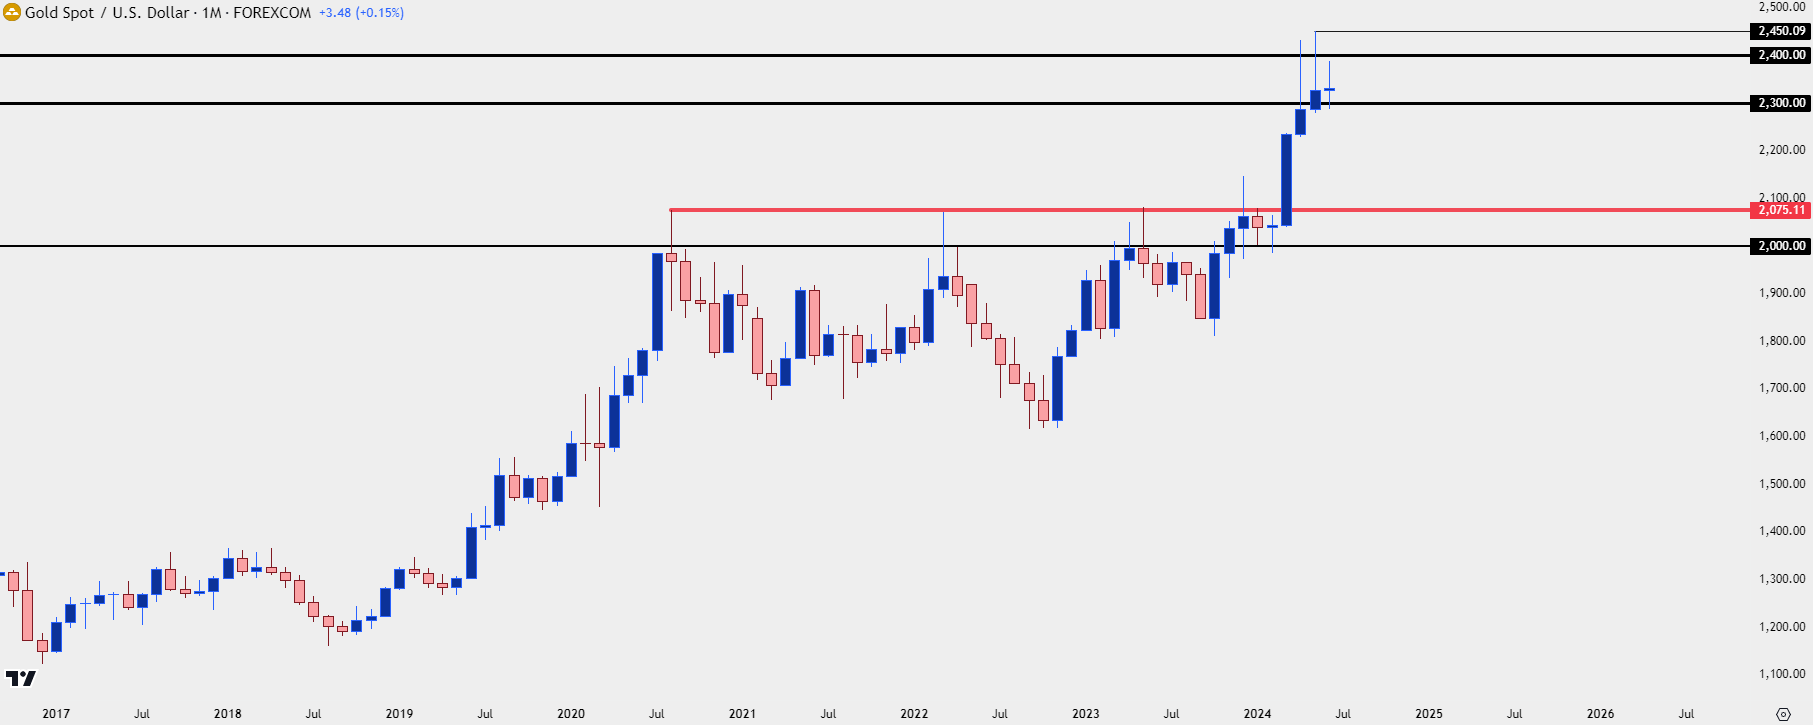 Chart prepared by James Stanley, Gold on Tradingview
Gold Weekly
From the weekly chart we can get a better view of that range that held for pretty much all of Q2 trade. Given the above setup on the monthly, where bulls have continued to shy away from highs, normally that’s opening a backdrop for a deeper pullback, and that remains into Q3 trade.
But, at this point, bulls have continued to defend support around the $2,300 level with a bullish trendline holding the swing lows of April, May and June. As long as that remains – bulls have a shot at a push up to $2,500. But if price starts to slip below support, there could soon be another theme to entertain in Q3 that I’ll touch on in a moment.
Gold (XAU/USD) Weekly Price Chart
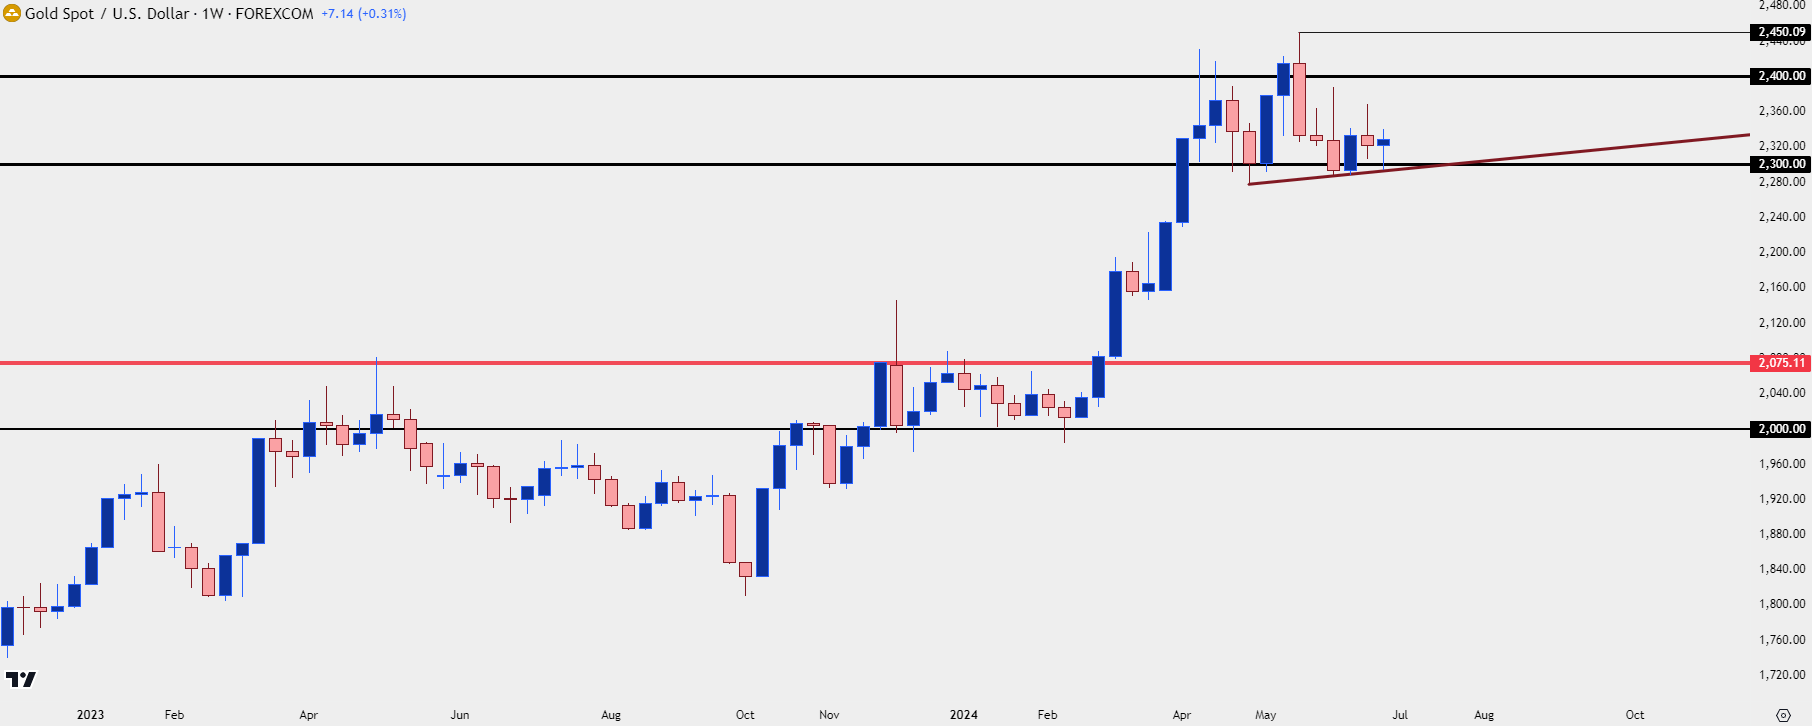 Chart prepared by James Stanley, Gold on Tradingview
Gold Daily
From the daily chart we can see that continued defense but, also notable is the diminishing marginal impact of support from that trendline. The trendline bounce in May stretched all the way up to $2,450. But the bounce in June was more moderate, topping out just inside of the $2,370 level. That type of bearish anticipation could lead to an eventual break and from the below chart, there can even be an argument made that we’re looking at a head and shoulders pattern brewing. Those formations are often approached with aim of bearish breakout, but regardless of the context, the focal point for those formations is the neckline of support.
If bears can start to take control in Q3, this highlights support potential at prior resistance of $2,195 after which the $2,075 level comes into play. And in the counter-scenario, if bulls can retain control and continue to defend higher-lows at or around the $2,300 level, the next major spot of possible resistance overhead is the $2,500 psychological level.
As we can see from Q2, those round number levels can provide massive inflection points and if bulls are able to stretch up to $2,500, I’d expect a fight and that could bring possible reversal scenarios, depending on how aggressively buyers make the push.
Gold (XAU/USD) Daily Price Chart
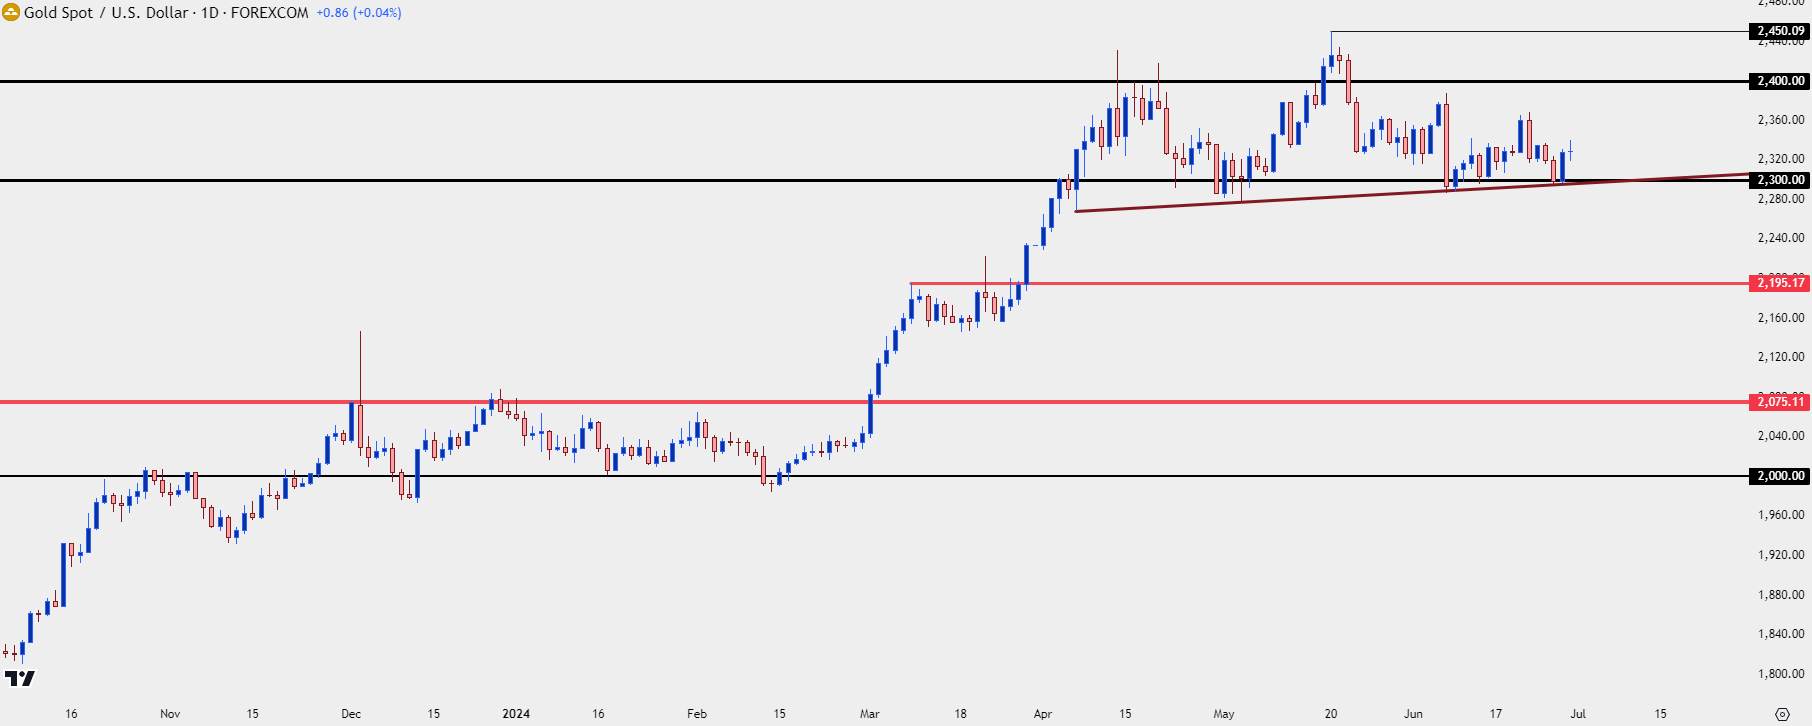 Chart prepared by James Stanley, Gold on Tradingview
--- written by James Stanley, Senior Strategist


