Price Action Talking Points:
- This is an article on the topic of price action, which we had introduced in last week’s article on Price Action Trends. In today’s piece, we start looking at support and resistance by using prior market structure as shown via price action.
- As looked at in prior installment, up-trends will often show as a series of higher-highs and higher-lows while down-trends can build in a series of lower-lows and lower-highs. Using prior resistance as new support (or prior support as fresh resistance) is a way of incorporating that market structure into a trader’s analysis.
- If you’re looking to learn more on price action, FOREX.com has just launched the Trader’s Course and the first three installments are completely open. This covers fundamental analysis, technical analysis and the third installment covers price action. This is available from the following link: The Trader's Course, with FOREX.com
In the last price action installment, we looked at how traders can analyze a chart without any indicators, focusing solely on a market’s price structure to help with trading analysis and decisions. As shared there, trading in the direction of the trend can be helpful, as the future remains uncertain at all points in time, but one of the two tenets taught in the Trader’s Course regarding technical analysis is that trends exist, there’s often a reason for them, and that reason may continue to drive. The other tenet we had touched on only briefly in the last article, but we’ll begin getting more in tune with that today by investigating support and resistance as taken from price action.
While trends are helpful as they highlight a recent bias, support and resistance is crucial as that helps with risk management. And in an uncertain future, you will probably never control price, which can lead to chaotic results if simply playing the ‘guessing game.’ But – you can control yourself, and your approach, and your risk outlay while taking a realistic vantage point into the market that your ability to predict will always be a challenge. Trading trends can allow the trader to employ a simple ‘if-then’ statement, saying, ‘if the trend continues and the market respects the price structure of this trend, my stop can remain unfettered. But – if something changes, I want to get out of the trade with the aim of loss mitigation before a stronger reversal appears.’
Of course, this will not always be perfect as there will be episodes where the stop will get triggered and the prior trend will continue; but this, again, speaks to the non-predictability of markets which is something that often drives traders to price action in the first place, and this will be a constant for as long as you’re a trader: The future will always remain as uncertain regardless of how great your analysis becomes. But, rather than trying to ‘predict,’ traders can instead look to react with aim of instituting strong risk-reward ratios, as touched on in the risk management portion of The Trader’s Course. And for that, price action can help to deliver a clean picture of the present.
Before we go deeper into today’s topic, we’ve recently released a new educational course and price action is front-and-center. The core of the content is a focus on risk management and that’s addressed in the first few slides of the curriculum, during the topic on fundamental analysis. The third installment in the course is dedicated to price action and you’re more than welcome to view that in the video player below:
The Trader Course: Part 3- Price Action
Price Action Support and Resistance
The candlestick can be a great reference for market behavior, particularly from time frames such as the daily chart. During an individual day of trade, a market may dip, rip and settle somewhere in-between, but the levels or prices at which those inflections take place can be an important variable in forward-looking strategy. And they may have some relationship to the bigger-picture context of that market.
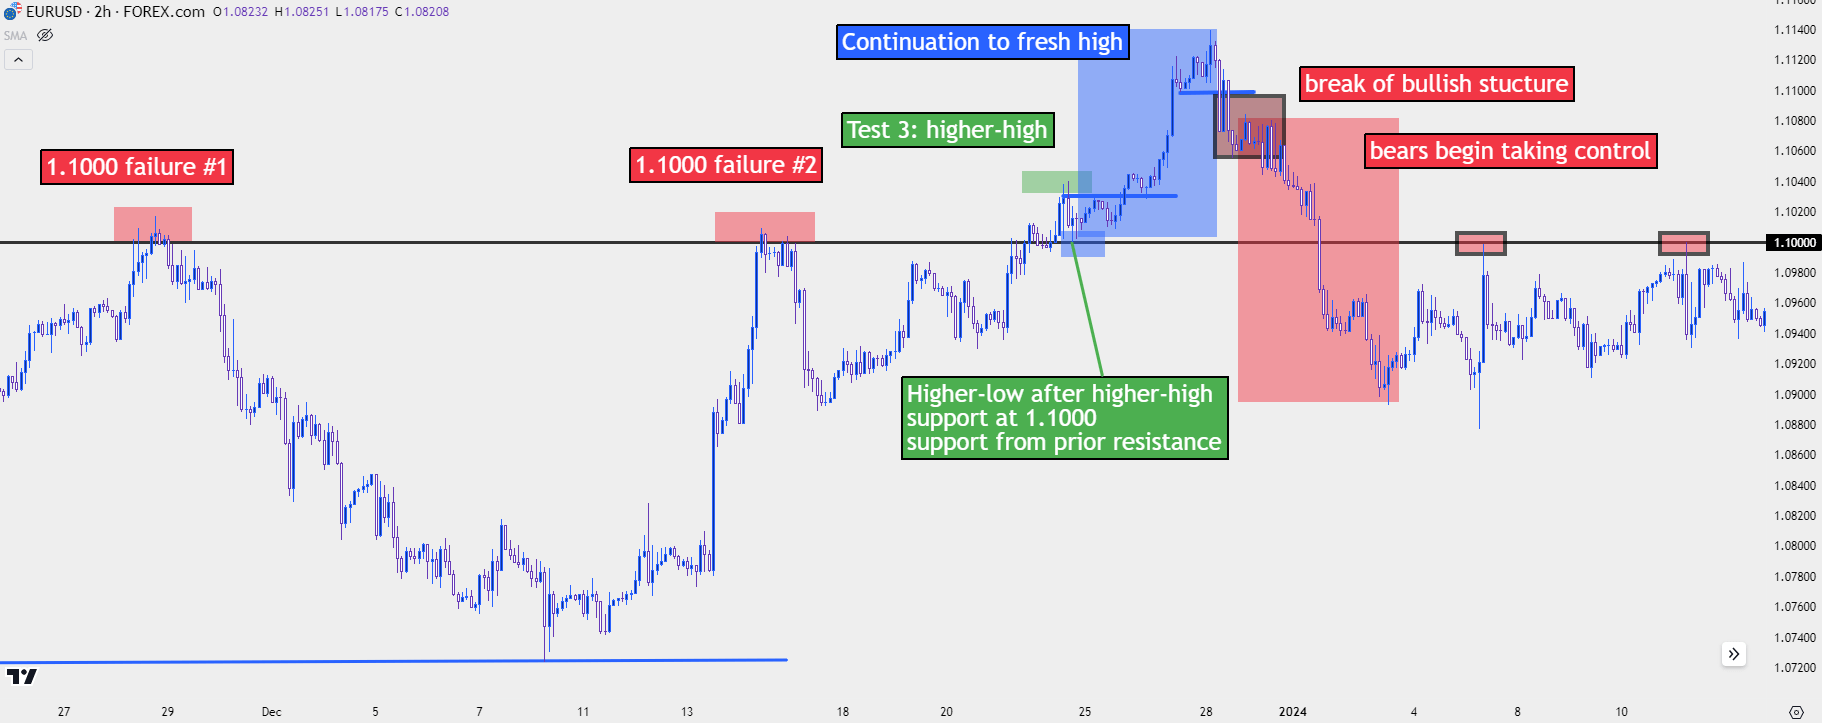
For a trend to build, traders need to be willing to break that prior structure, and from that a message can be delivered. Let’s say, for instance, that EUR/USD is finding resistance at the 1.1000 level. Each time it trades at 1.1000, it falls, and this is a sign that sellers are offering the pair at that price. There’s no acceptance of the market at prices above the 1.1000 handle and thus, this comes in as resistance. But, if the next attempt at 1.1000 suddenly breaks through, and rises to 1.1025, then there may be a break in the impasse as that seller defense of 1.1000 is no longer showing; bulls had to outnumber sellers to allow for the bullish breakout.
There may be a new bullish trend to work with, based on that higher-high. If you think about it, this makes sense as there were trades taking place at 1.1001, 1.1002, 1.1003, etc., and that shows bulls’ willingness to take on exposure even at a fresh high as price is breaking out. Conversely, this is also opportunity for bears to sell at a higher price, and they’re also incentivized to take exposure if they want to enforce that bearish view. But if price keeps moving higher than we are seeing demand outstrip supply and this is a sign of bulls gaining control. This could be an early sign that buyers are getting more aggressive, and this can help to make that bullish trend more attractive to other buyers as there’s a fresh bullish breakout to work with.
The big test is what happens after a pullback, and this is what was talked about in the Price Action Trends article. Given that there was a prior build of resistance at 1.1000 and prices are now trading higher, longs can now be incentivized by the prospect of profit taking, while bears are incentivized to sell at a new higher price. Those that had bought pullbacks at 1.0980 or 1.0990 are now sitting on an unrealized profit, and if the motivation to take profits is great enough, then that brings selling supply to the market which can allow for pullback.
It's what happens after that pullback that can highlight trending potential. If buyers remain excited and anticipatory of continued strength, the pullback from fresh highs can be an attractive time to come into the market, and this is what helps to build higher-lows. And, if this new support is taking place at a spot of prior resistance, the build of that bullish structure can be clear.
EUR/USD Two-Hour Chart: Nov 22, 2023-Jan 10, 2024
 Chart prepared by James Stanley, EUR/USD on Tradingview
On the above chart I used some assistance from the 1.1000 level. That’s considered to be a ‘psychological level’ as it’s an even, rounded price that tends to get attention from traders and thus, can help to create support and/or resistance. But the reality is that price action structure can build without any additional assistance from other support/resistance mechanisms.
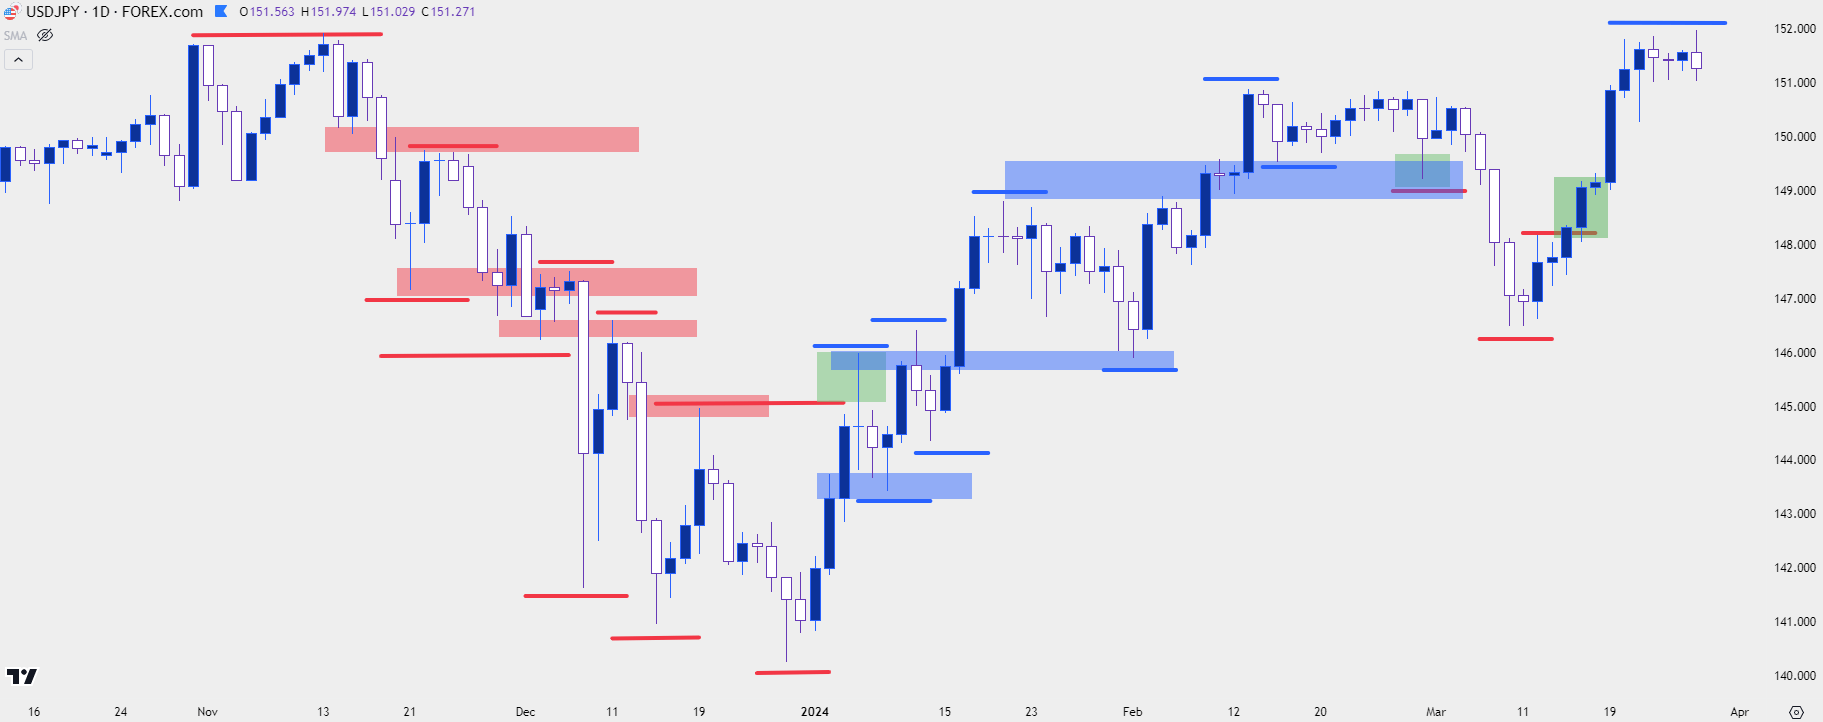
In our last article, I used USD/JPY to illustrate price action trend dynamics. Below, I have that same chart, but this time I’ve added boxes around instances of support becoming resistance in down-trends, or resistance becoming support in up-trends. I’ve also added a green box on the right side of the chart to illustrate a concept that we’ll talk about after the next chart. You’ll notice that the wicks are important to track for these instances as that’s what shows intra-bar dynamics, and we’ll dig deeper into that in a moment.
USD/JPY Daily Price Chart: Oct, 2023-March, 2024
 Chart prepared by James Stanley, USD/JPY on Tradingview
When Trends Don’t Continue, When Moves Reverse
The green box on the right side of the chart illustrates a bearish trend that could not continue. The red line illustrates a possible lower-high, but that was quickly broken-through by bulls as the prior trend came back quickly.
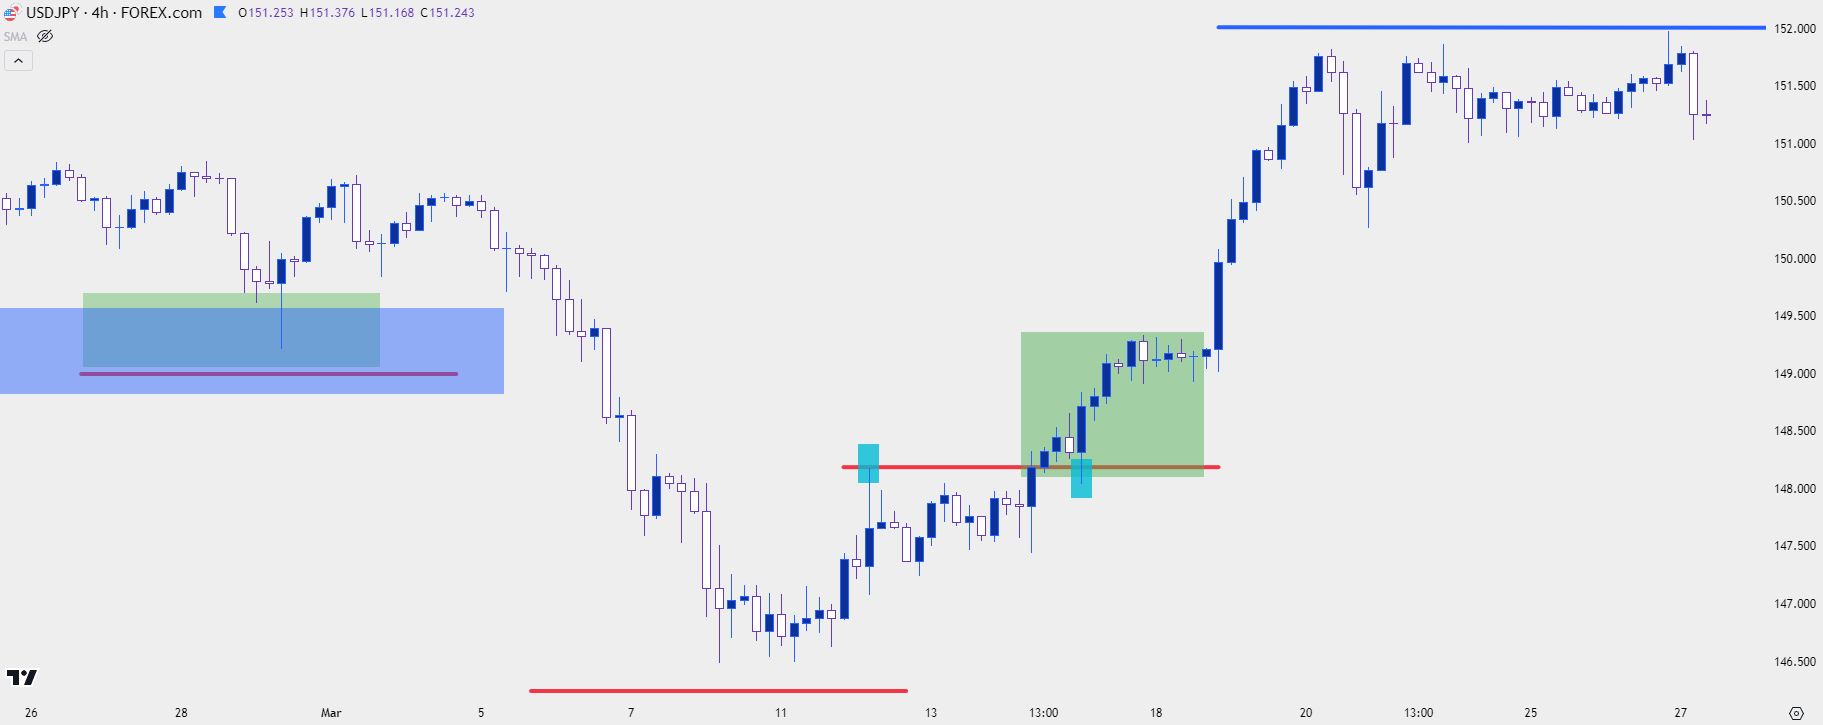
So, for bears that had sold at that lower-high, the aim would be loss mitigation because, as we can see from the above chart, that bullish trend kept going and the unrealized loss for shorts could be daunting. But, also of interest is how that bullish move began to build, and by looking at the four-hour chart below, we can see that it started with a pullback and support test right at that prior lower-high.
I also want to draw your attention to each individual candle from both resistance and support, which I’ve marked below in aqua. You’ll notice an extended wick for both, and that highlights the intra-bar reaction illustrating both sellers pushing prices down as resistance, and then buyers jumping in to buy after a test below that prior level.
For the trader watching on the four-hour chart, they would have an indication that the trend was reversing after that illustration of a support response at the prior spot of resistance. But, more importantly, to the bear that was looking for the prior short-side trend to continue, they could’ve mitigated risk by taking a stop on the break of the lower-high.
USD/JPY Four-Hour Price Chart: February 26, 2024 – March 27, 2024
 Chart prepared by James Stanley, USD/JPY on Tradingview
Seeing the Big Picture
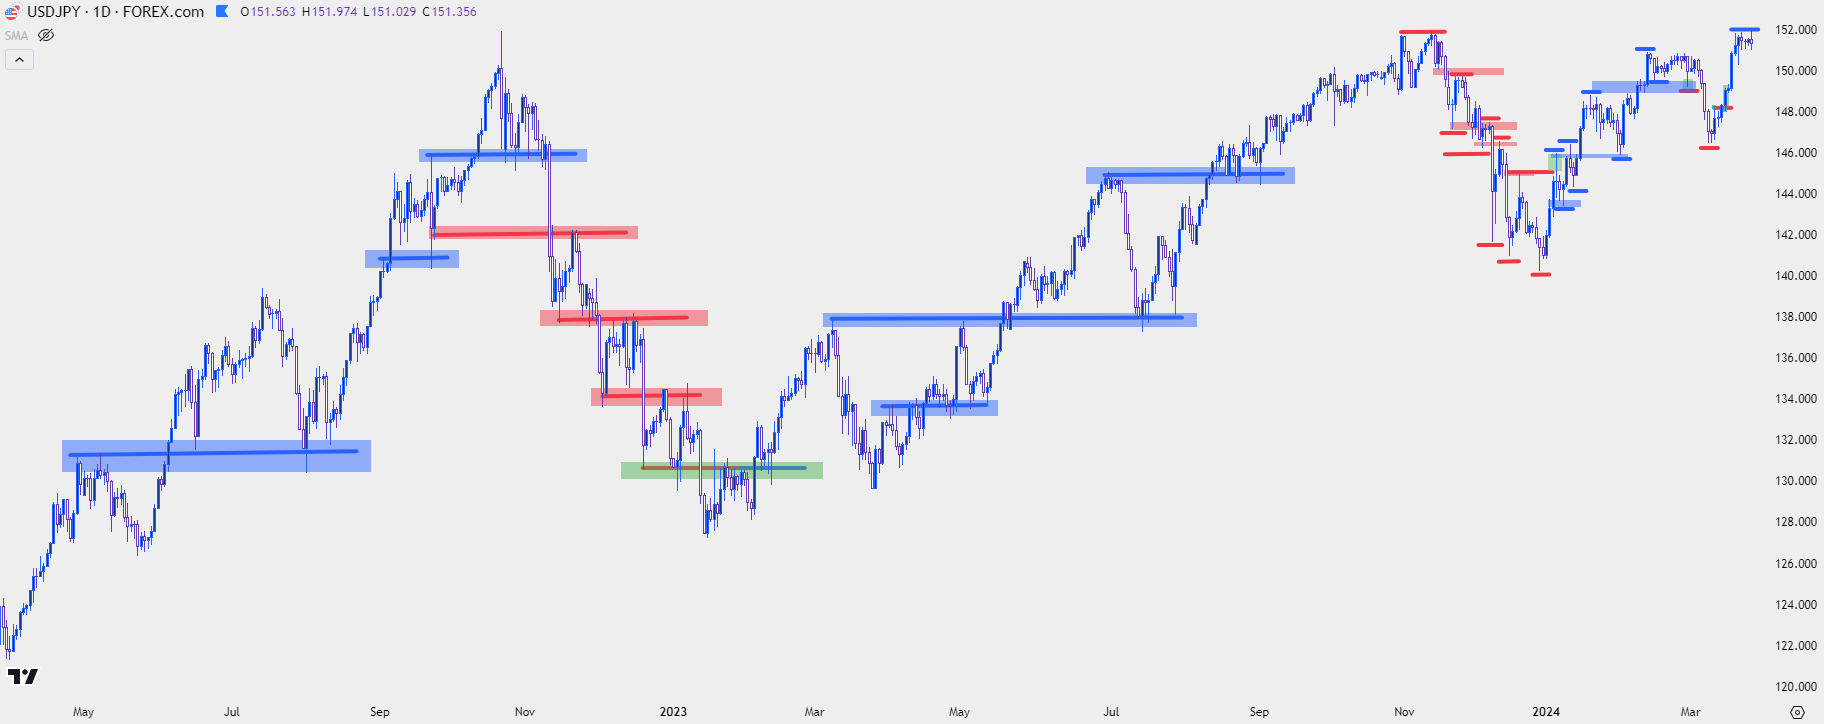
If we take a step back, we can see this dynamic at work in multiple instances and in a few different ways. Below, I’m going back two full years on USD/JPY’s daily chart to highlight several instances of support coming from prior resistance, or resistance coming from prior support. This time, I’m highlighting the clearer instances in aim of illustration.
The large attraction here is the potential for winning trades to run for longer than losing trades: If wrong, the trader can take a relatively quick stop but, if right, the trader can allow the trend to continue to develop.
USD/JPY Daily Price Chart: April, 2022 – March, 2024
 Chart prepared by James Stanley, USD/JPY on Tradingview
The Power of Wicks and the Messages of Price
An entire article can (and will) be dedicated to candlestick wicks but for today’s topic, it’s important to point out the importance of candlestick wicks for support and resistance tests.
Short-term price action can be chaotic, especially during news events. Therefore, short-term traders focusing on news can witness many false breakouts: Price will run excitedly as the new data is getting priced-in, but whether that leads into any long-term connotations will remain to be seen. The big question is how other traders are responding to those stimuli. Some breakouts will continue to drive, others will fail and, unfortunately, it’s impossible to know which will be which until it’s already too late. It’s when a counter-trend breakout fails that matters become interesting, because there may now be an opportunity to join that trend at a recent higher-low.
It’s that prospect of intra-bar failure that’s of interest to the price action trader focusing on trends. Because if a market breaks out on a short-term basis, and then quickly reverses in the direction of the prior, dominant trend, that may be a sign of bigger-picture continuation. And, if on the right side of the trade, the trader can seek out two, three or four times their initial risk amount as a profit target.
But, also of interest is the grouping of wicks over multiple bars at a similar price level. This can also be illustrating a hold of support or resistance as there’s now multiple reactions at a similar price zone to illustrate that market sentiment.
This will be a focal point in a future article. But the takeaway for candlestick wicks is that a wick shows a reaction. The more elongated the wick, the larger the reaction; and those reactions may be something that can be instituted into a trend trader’s approach, particularly if the wick reactions point in the direction of the broader trend of that market.
--- written by James Stanley, Senior Strategist


