
US Dollar Talking Points:
- It’s been a busy start to the week and, as of this writing, we haven’t even encountered the big drivers yet. That begins after the bell today with Microsoft and AMD earnings calls, which leads into the Bank of Japan rate decision overnight. Tomorrow brings the Fed and META earnings are reported after the bell on Wednesday. Then a Bank of England rate decision for Thursday morning, followed by Amazon and Apple earnings. Friday closes the week with Non-farm Payrolls, so a busy backdrop is ahead of us.
- During the webinar a report came out from incoming Japanese Finance Minister Atsushi Mimura, titled ‘Japan’s New FX Chief Says Weak Yen Doing More Harm Than Good for Economy.’ This led to a jolt in a number of markets that were already skittish about possible rate hike talk from the BoJ. I’ll elaborate further below.
- This is an archived webinar and you’re welcome to join the next installment: Click here to register.
We’re getting into the thick of this week’s calendar and already an unexpected driver has appeared. It was during this webinar that a report began to circulate from Bloomberg that’s relevant to the Japanese Yen. It was quoting incoming Finance Minister Atsushi Mimura, highlighting how he’s not certain that Yen-weakness has been a positive for the Japanese economy.
Given the BoJ rate decision on the cards for later tonight, markets were already somewhat jumpy around the USD/JPY carry theme, which has shown some links to Mag 7 tech stocks. The release of that report gave additional reason for traders to square up ahead of the announcement and this has led to a quick push of JPY strength.
The bigger question is whether this report was released as a buffer to tonight’s rate decision – or as a warning. As I shared in the webinar there’s consequence for Japanese markets on such a reshuffling as the Nikkei has been down by as much as -11.35% since the Finance Ministry ordered the BoJ to intervene on July 11th.
And, of note, there’s a difference between the Finance Ministry that was spoken of in the article and the Bank of Japan: The MoF monitors the Yen while the BoJ monitors monetary policy. Whether the BoJ echoes that sentiment about Yen-weakness remains to be seen but, if they do, then reasonably there could be a bearish driver in Japanese equities and this may even span over to US equities, as well.
At this point, USD/JPY has retreated to support around the 153 handle.
USD/JPY Four-Hour Price Chart
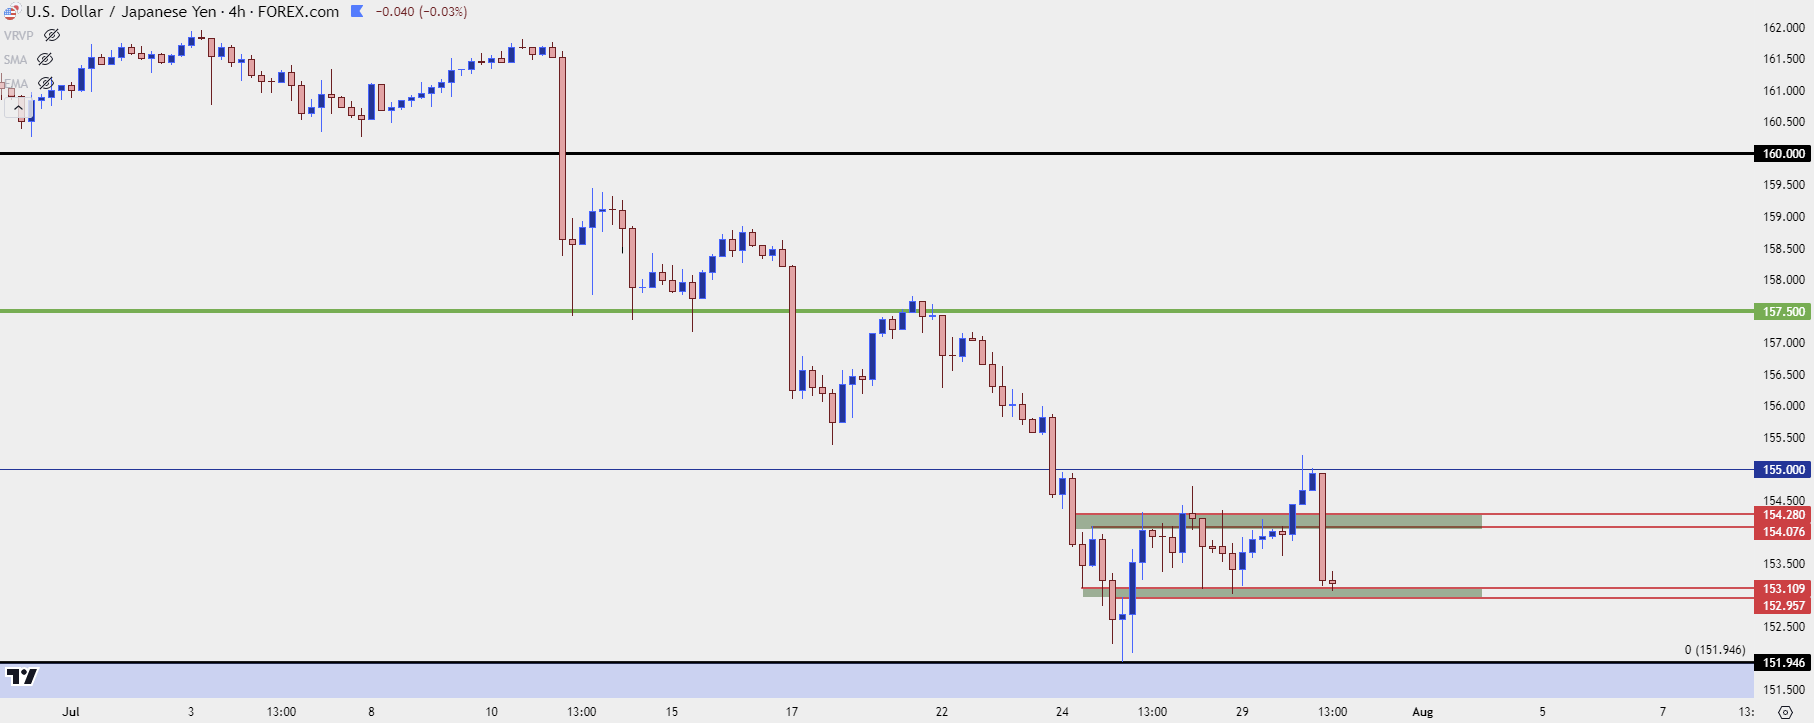 Chart prepared by James Stanley, USD/JPY on Tradingview
BoJ Intervention – Equity Reversion
The BoJ intervened on July 11th, just minutes after the release of US CPI data. Since then there’s been a fast pullback showing in USD/JPY to go along with similar moves in the Nikkei and Nasdaq 100 futures. And, interestingly, the AI-section of the market has been hit especially hard.
Now, there is a real issue to rectify regarding AI and that’s revenue potential. We saw this last quarter when Meta reported earnings, as Mark Zuckerberg didn’t have a great answer when questioned about revenue potential from all of the capital expenditure with AI. And to be sure, the Mag 7 which all have an AI component have run rampantly higher over the past couple years on the hope that AI will allow for earnings expansion to justify valuations. With markets gearing up for rate cuts and the USD/JPY carry trade being used as a funding instrument, there was excuse for market participants to chase tech stocks like NVDA or AAPL despite stretched valuations.
But, with fear of a larger unwind in USD/JPY and questions around revenue generation potential from AI, those themes have started to pullback. On the chart below, we can see performance since the BoJ intervention on the 11th, with the Nikkei in orange and Nasdaq 100 futures in blue. All three markets have seen heavy re-pricing already.
USD/JPY with Nikkei (in Orange) and NQ (Nasdaq 100 Futures in blue)
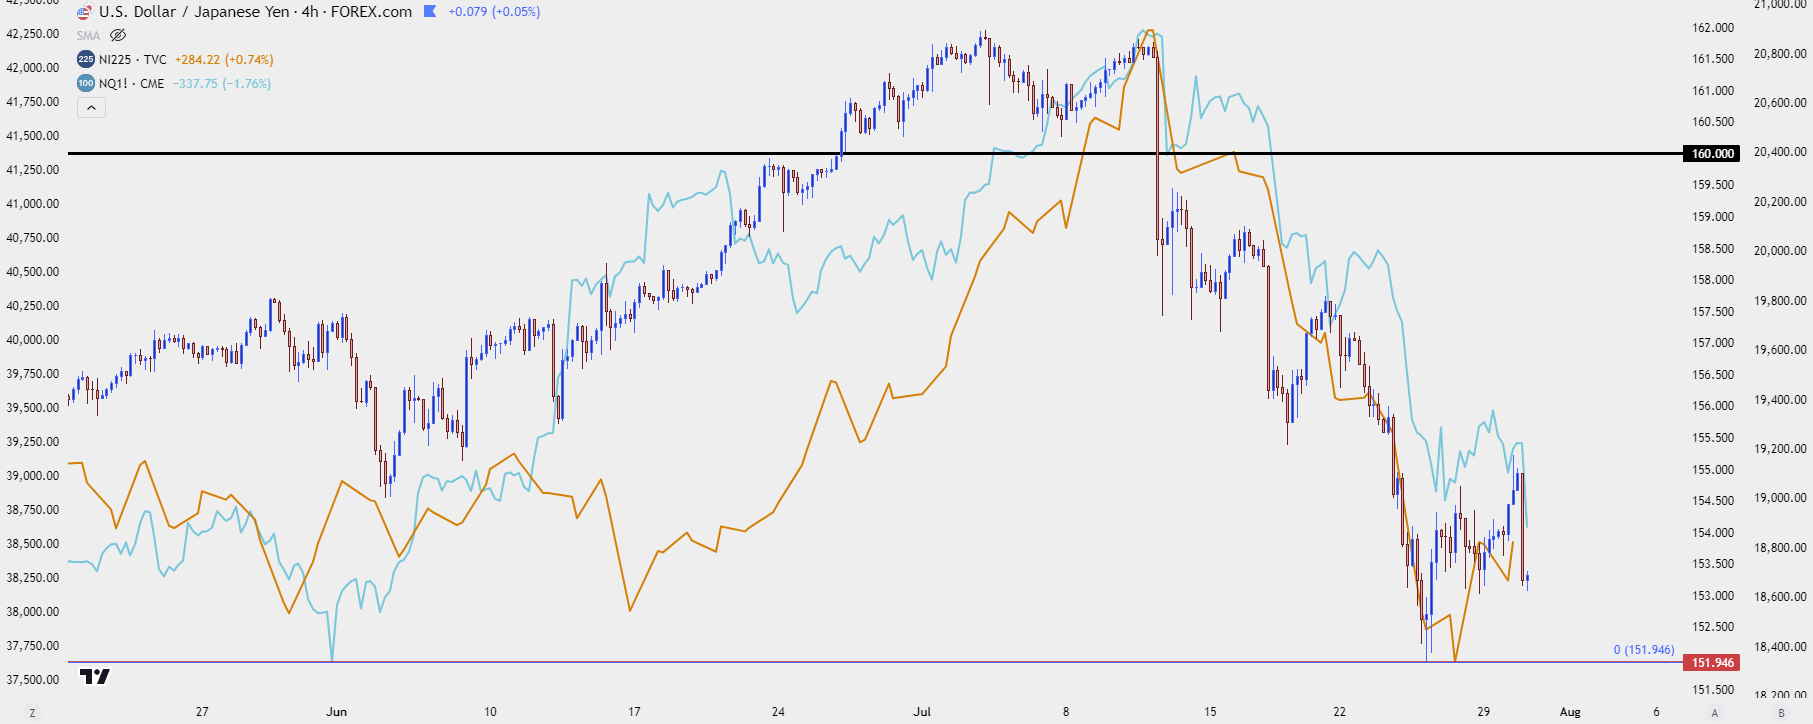 Chart prepared by James Stanley; data derived from Tradingview
USD/JPY Big Picture
The report linked above largely speaks of defending the Yen with interventions, which was something that has happened around the 160 level on a couple of separate occasions. This is why I’m wondering whether it was a pre-emptive report ahead of tonight’s rate decision, in the event that the BoJ doesn’t talk up rate hikes. This could act as a temper on bullish moves for fear of more intervention.
But, as I often say in webinars, price is most important and on the weekly chart of USD/JPY, there’s still bullish structure.
The 151.95 level is obviously important, after setting highs in 2022 and 2023 and then support in May and so far in July.
I think the ‘major’ level here is the 150.00 handle as that can be a popular spot for trailed stops from long-term bulls that have been holding the carry. And if that price gets hit and stops get triggered, stop orders on long positions could bring more supply into the market leading to an even faster breakdown.
This would be the opposite scenario that I spoke of with upside setups around 151.95 back in March, after the BoJ’s first rate hike since 2007. If bulls can’t defend 150, there’s higher probability of a bigger-picture reversal, in my opinion, as stops getting triggered below that can fuel a bearish breakdown in the pair.
USD/JPY Weekly Price Chart
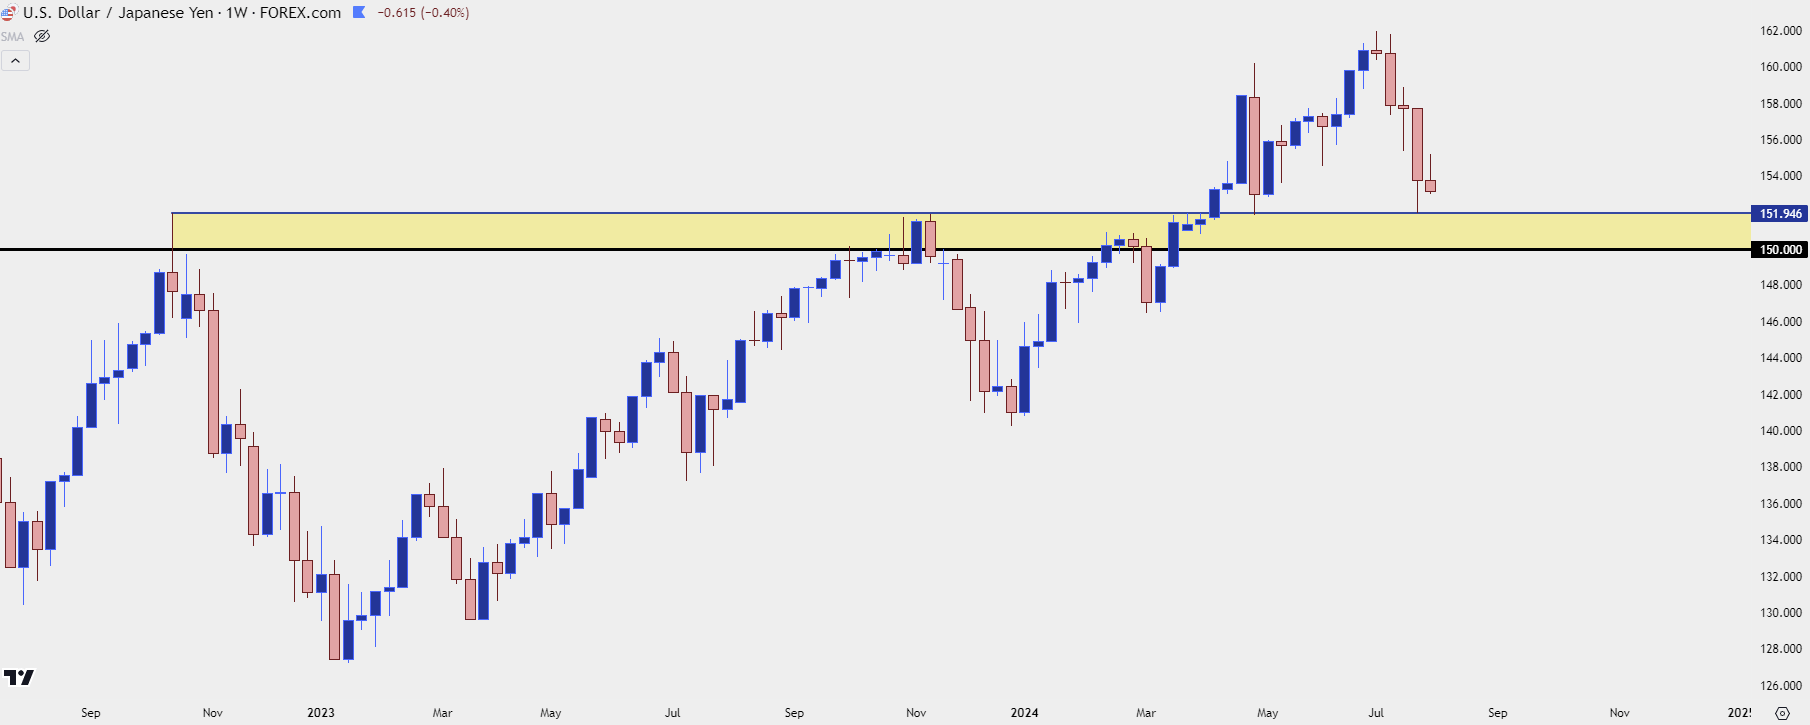 Chart prepared by James Stanley, USD/JPY on Tradingview
Gold
The opening of this webinar had a long section about gold, discussing the differences between spot and futures. I’m focusing on spot today given the continued fight at major psychological levels with the $2,400 level playing a large role at the moment.
Since the webinar less than a few hours ago, gold has breached $2,400 to set a fresh higher-high, going along with the higher-low off of the $2,375 zone. This keeps bulls in order on near-term trends following last week’s pullback.
Spot Gold (XAU/USD) Four-Hour Price Chart
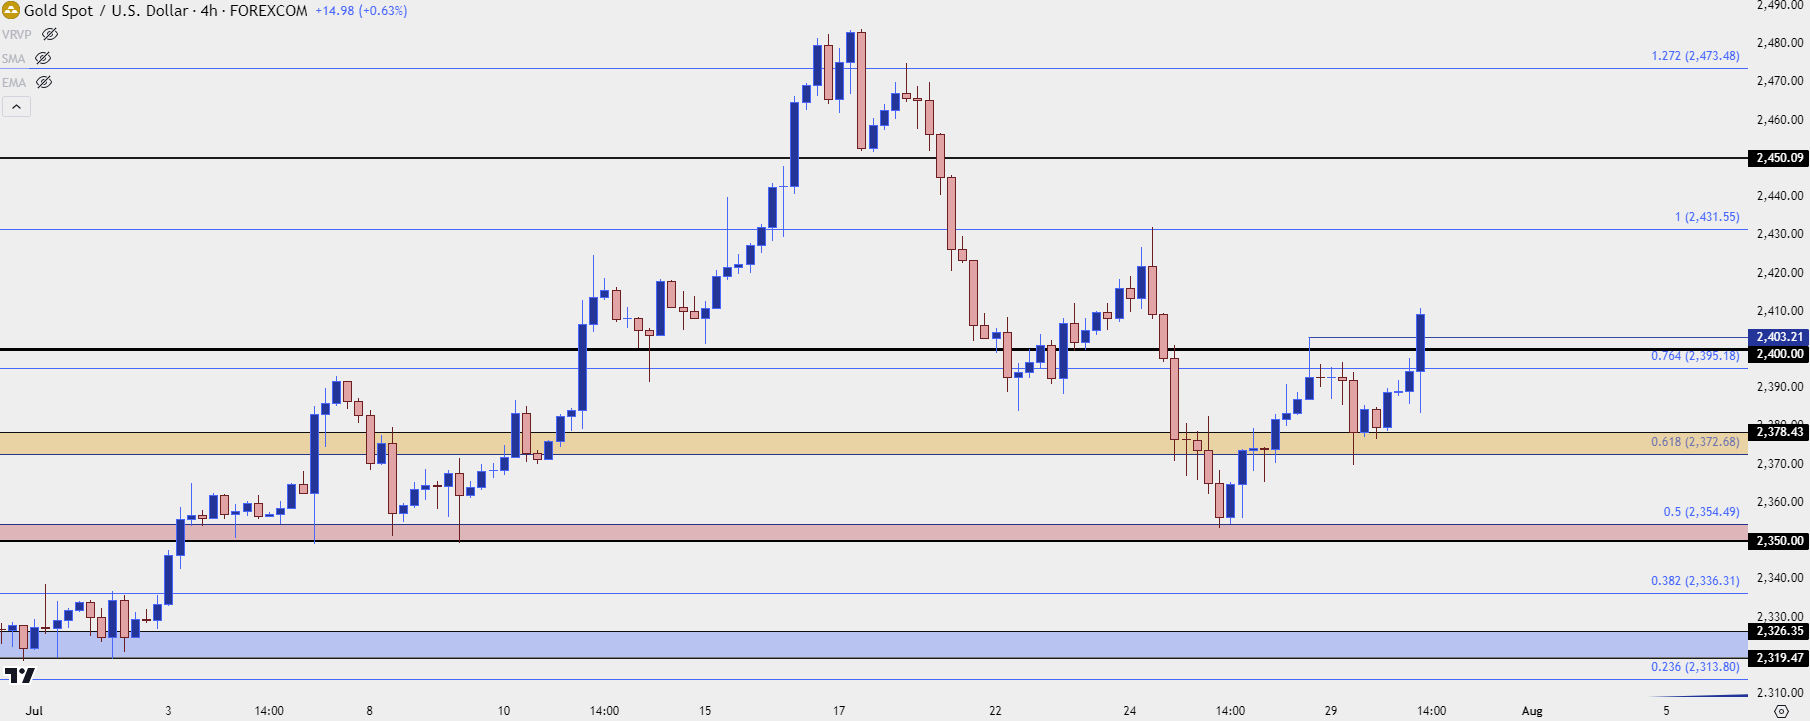 Chart prepared by James Stanley; data derived from Tradingview
EUR/USD
Despite the fireworks elsewhere, EUR/USD remains in the longer-term range. As of the webinar the pair was testing support at the 1.0800 handle in a zone confluent with the 200-day moving average. This follows four consecutive days of resistance at the Fibonacci level plotted at 1.0862, and this will be a point of interest for USD-strategies going into FOMC tomorrow.
EUR/USD Daily Price Chart
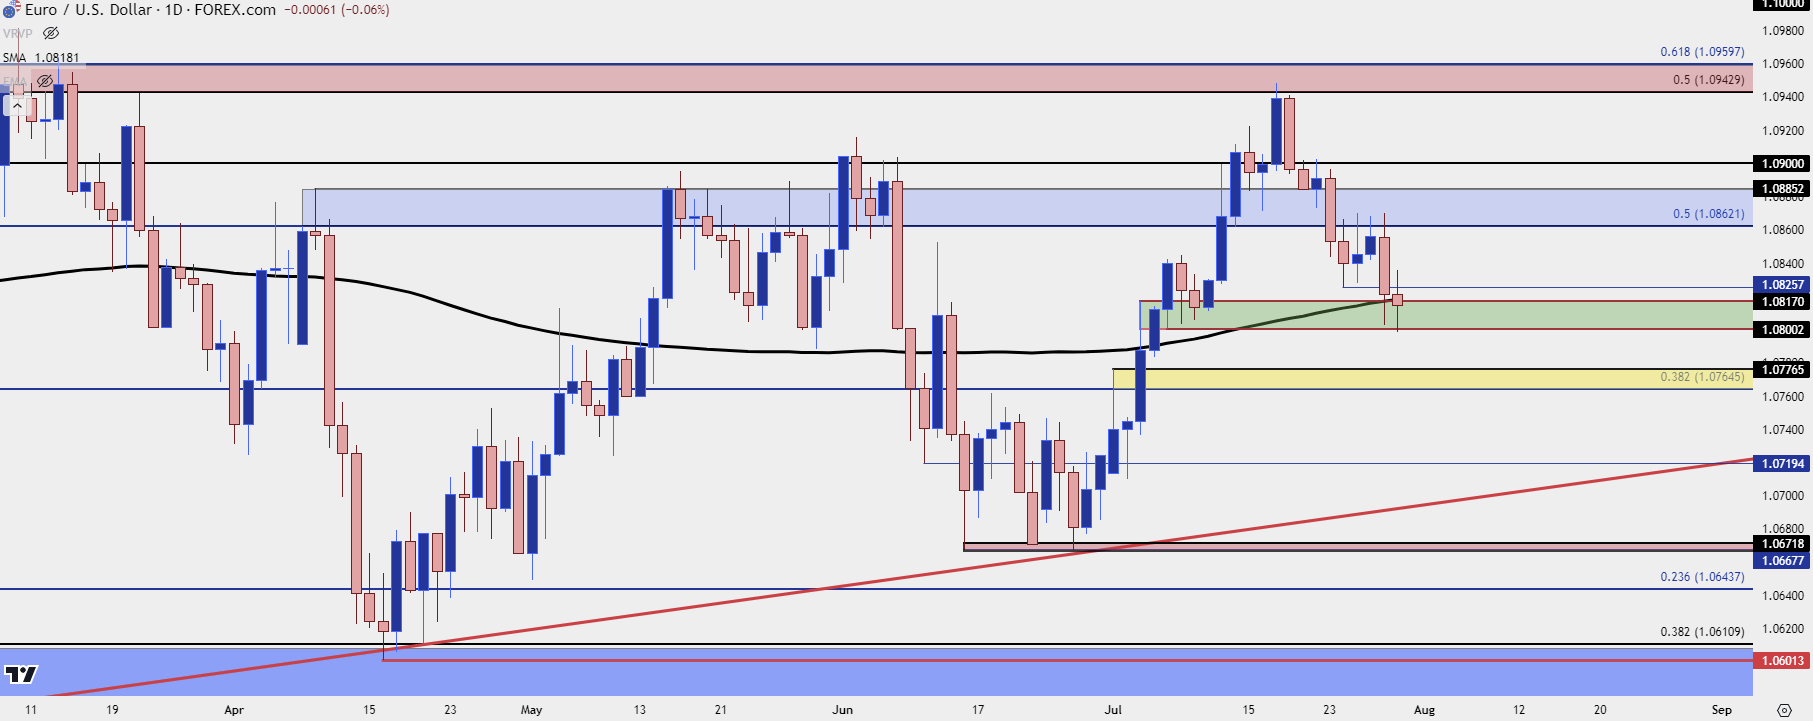 Chart prepared by James Stanley, EUR/USD on Tradingview
USD/CAD
USD/CAD has ripped since July 11th and, interestingly, that bar on the day of US CPI was blue indicating USD strength against the CAD. That made the pair as somewhat of an outlier and since then, there’s been only one red day on the chart.
But – price is now nearing some key resistance on longer-term charts and as I shared in the webinar, it looks like retail traders may be very stretched here. This highlights a possible capitulation scenario and as I explained in the webinar, natural crosses can be especially prone to major psychological levels as we get closer to the 1.4000 handle.
USD/CAD Daily Price Chart
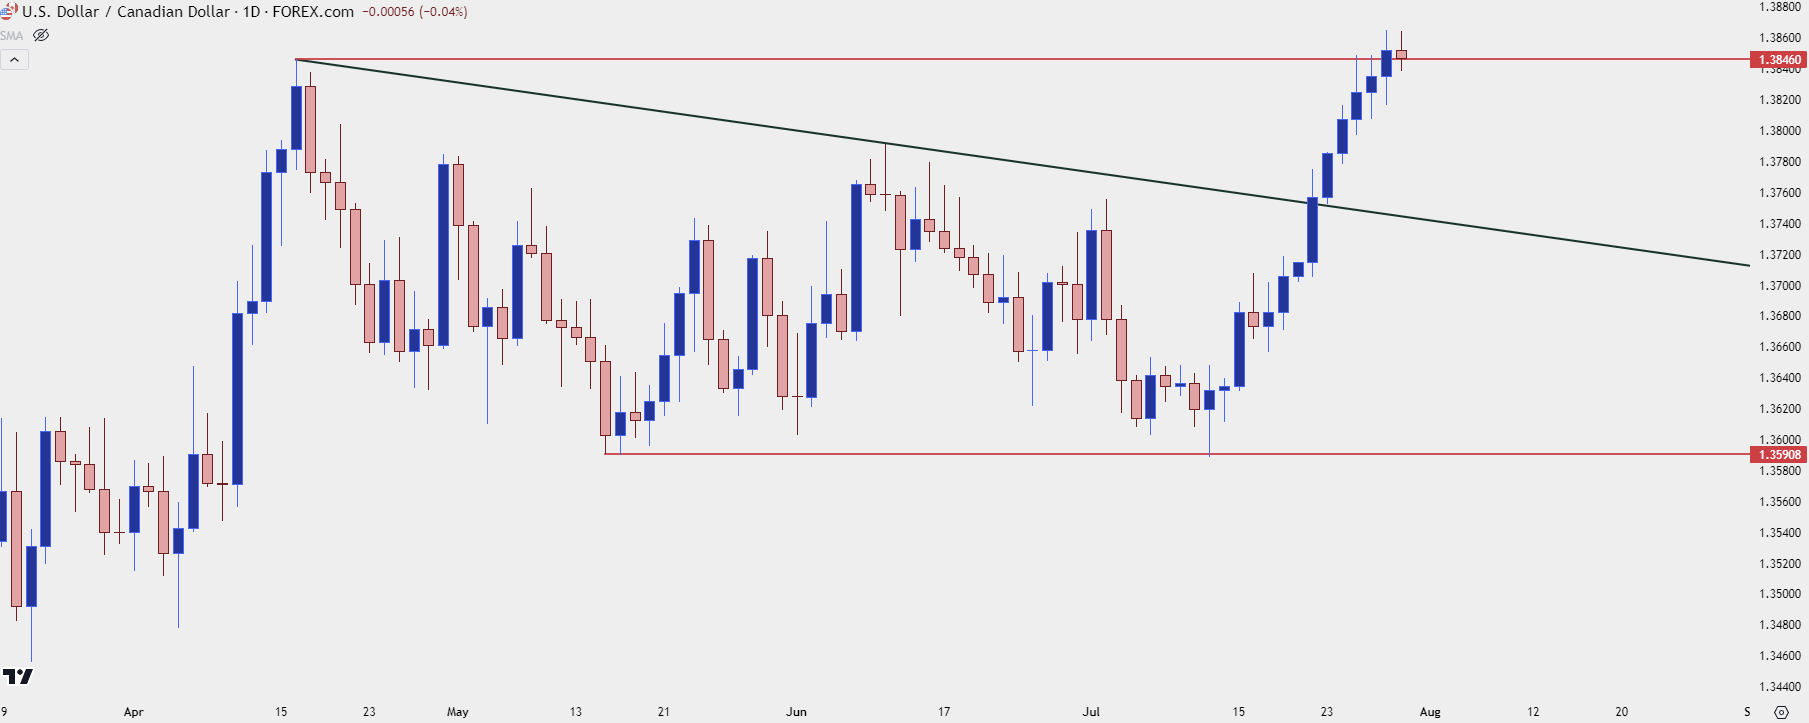 Chart prepared by James Stanley, USD/CAD on Tradingview
USD/CHF
This one could become interesting for USD bulls in the coming days, but there’s some work to do. As of right now support has held at the 50% mark of the 2024 bullish move and as this has happened, there’s been the build of a falling wedge pattern. The 200-day moving average has so far held today’s high and that’s confluent with the 38.2% Fibonacci retracement of the same major move.
USD/CHF Daily Price Chart
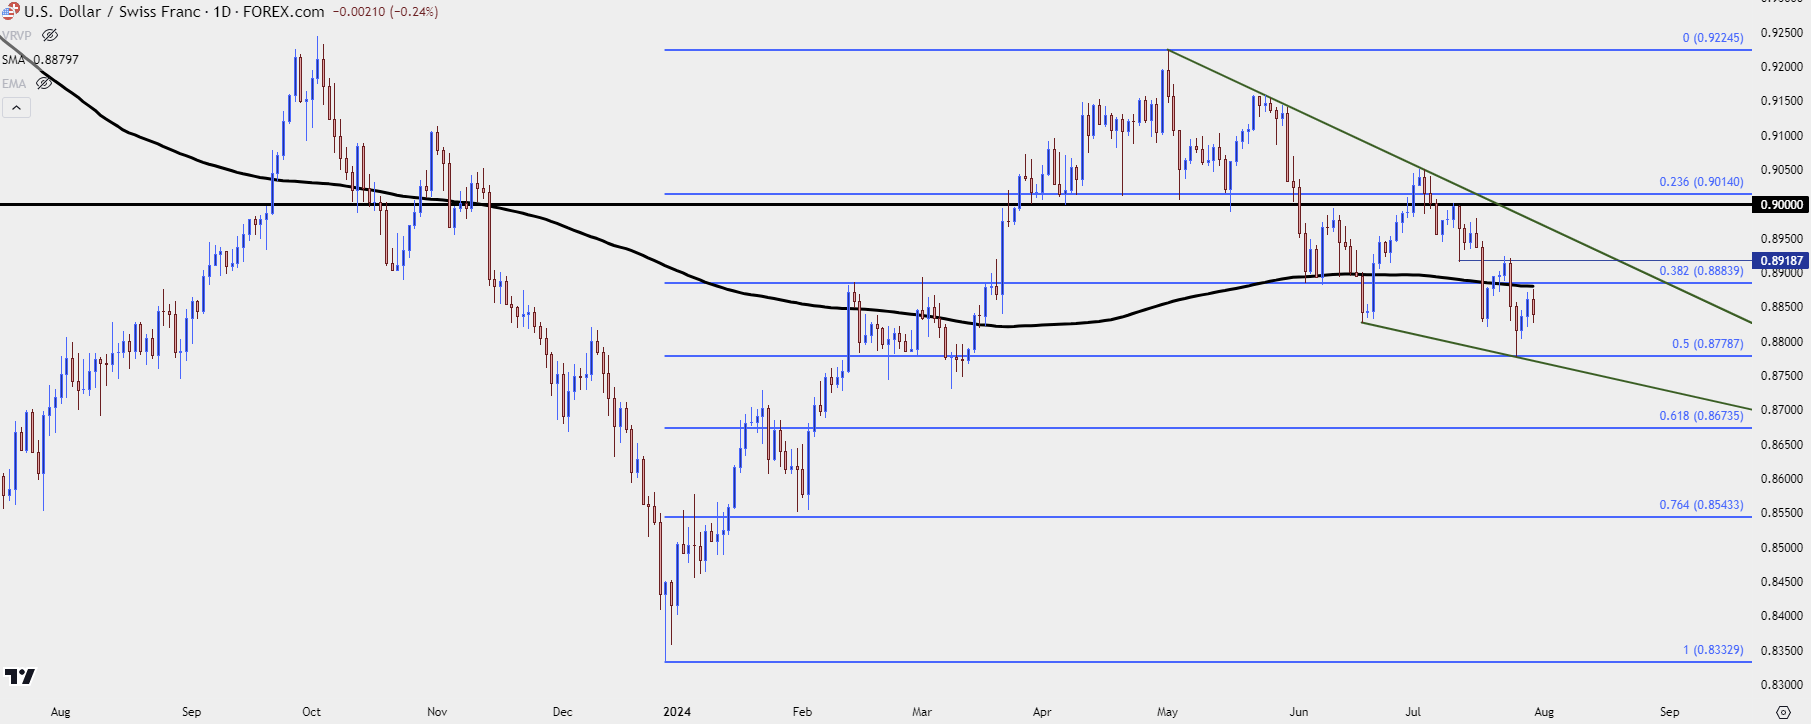 Chart prepared by James Stanley, USD/CHF on Tradingview
--- written by James Stanley, Senior Strategist


