
FOMC, US Dollar Talking Points:
- Tomorrow is a big day: US CPI is released at 8:30 AM ET and then the Fed announces their June rate decision at 2:00 PM ET.
- CPI remains a major market mover and Core CPI printed at fresh three-year-lows last month, which helped to drive weakness into the USD and strength into stocks. Last Friday’s NFP report was strong, and that’s pushed a significant movement of USD-strength as DXY has broken above the 105.00 handle. The big question now is whether that continues.
- There’s scant expectation for any rate moves tomorrow but the big driver will likely be the Fed’s updated projections. At their last quarterly meeting in March, they highlighted the possibility of three cuts. At this point, that’s difficult to imagine, but if they hold on to an expectation for two cuts or more there could be motivation for USD bears.
- I’ll be discussing these themes in-depth in the weekly webinar. It’s free for all to register: Click here to register.
The rest of this week will remain busy on the economic calendar, tomorrow especially as we’re getting two major US items on the same day. First, we’ll get the most recent CPI data at 8:30 AM, and that’s been a big market mover of late. And then at 2PM ET, we’ll hear from the Federal Reserve for a quarterly rate decision, where the bank will also supply updated projections and guidance.
At the last quarterly rate decision in March, the Fed maintained their expectation for three cuts in 2024. Given the calendar, that now seems a distant possibility as there’s only four rate decisions left this year after tomorrow’s meeting. And for tomorrow, there’s a 99.4% probability of no change. So, tomorrow’s meeting really seems to come down to what the Fed thinks might happen in the second-half of this year and whether they’ll be able to moderate interest rates at all in 2024 and, if so, by how much?
At this point, markets are expecting at least two rate cuts by the end of the year with a 47.4% probability.
Rate Probabilities in 2024
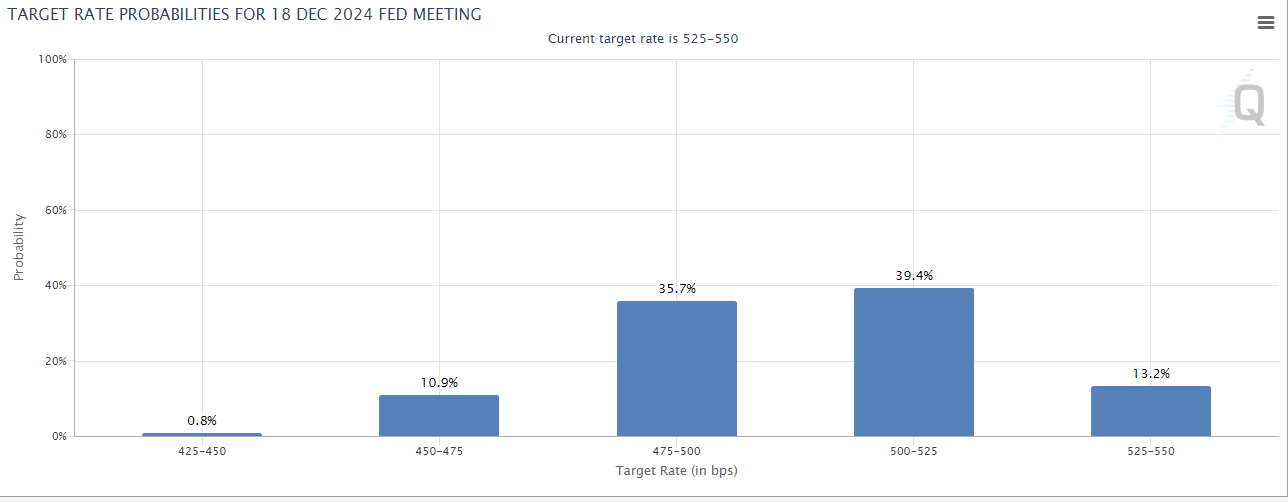 Chart prepared by James Stanley; data derived from CME Fedwatch
But key for that decision is the data that arrives earlier in the morning in the form of CPI, and that’s been a point of drama so far this year for the Fed.
There was a bit of hope arriving in the month of May as the CPI print on the 15th of the month showed core CPI at a fresh three-year-low. But the reading was at 3.6% so while there’s an argument for progress, its also well above the Fed’s inflation target of 2%, thereby making a difficult case to justify rate cuts. The Core PCE print later in the month came in once again at 2.8%, which illustrates the same type of stalling that had shown in Core CPI earlier in the year.
I’ve plotted core CPI in blue on the below chart, with core PCE in orange. And as you can see, since the Fed has stopped hiking rates inflation rates have shown stabilization in both data points to varying degrees. But the fear factor here is that this may be speaking to something Powell had noted as a risk of slowing rate hikes last year, which is inflation ‘entrenchment.’
If you’re a business owner or a CEO, and you can hike prices and improve margins – why wouldn’t you? Especially if workers are demanding higher wages and input costs are going up (both driven by inflation), well then you have a duty to try to maximize margins. This is why, normally, a ‘landing’ of some type is required to ‘break the back of inflation.’
Until business owners and CEOs get into a position where they want or need customers so badly that they wouldn’t want to risk a sale by asking for too much, that’s when we can really start to see rates of inflation come down. And that hasn’t seemed to happen yet.
Core CPI (blue) v/s Core PCE (orange)
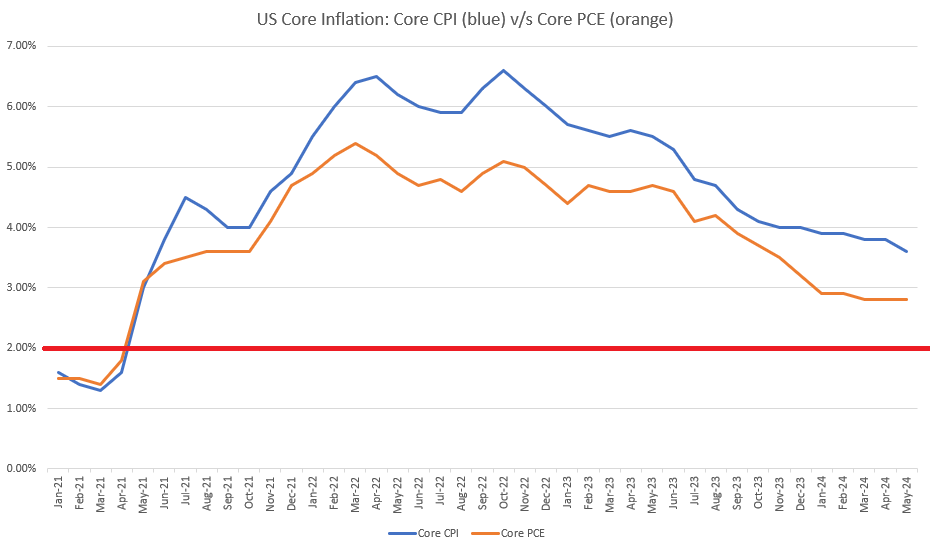
Chart prepared by James Stanley
USD
I’ve said numerous times this year that, ‘it seems the natural force of the US Dollar is higher, but the Fed has continued to talk it down.’
I think that remains in-effect today as labor markets retain a degree of strength and inflation remains well above the Fed’s target of 2%. To be sure, there’s the prospect of collateral damage from high rates, which explains why the Fed may be so enthused to begin cutting whenever they can.
But, more importantly (and proactively) than that, I don’t expect the Fed to all-the-sudden start talking up rate hikes and ‘breaking the back of inflation.’ Doing so could create significant damage in equity markets and I think that’s a risk the Fed would like to avoid as they continue watching incoming inflation data, hopeful that the backdrop will align for cuts later this year.
In the US Dollar, the currency held support last week at the zone set between April and May swing lows. The Friday NFP report prodded a strong topside move and that put USD bulls back in the driver’s seat. This could still be a tough move to chase though, and this highlights support zones for pullbacks. Prior resistance of 105-105.13 remains of interest, and below that is a zone of resistance from last week that runs from 104.27-104.38.
Above current price, there’s a Fibonacci level that also held prior support at 105.51, after which the gap from the November 1st rate decision comes back into the picture. That runs from 106.51 up to 106.88, with the former price coming into play twice already whilst setting a double top formation (which has since filled and completed).
US Dollar, DXY Daily Price Chart
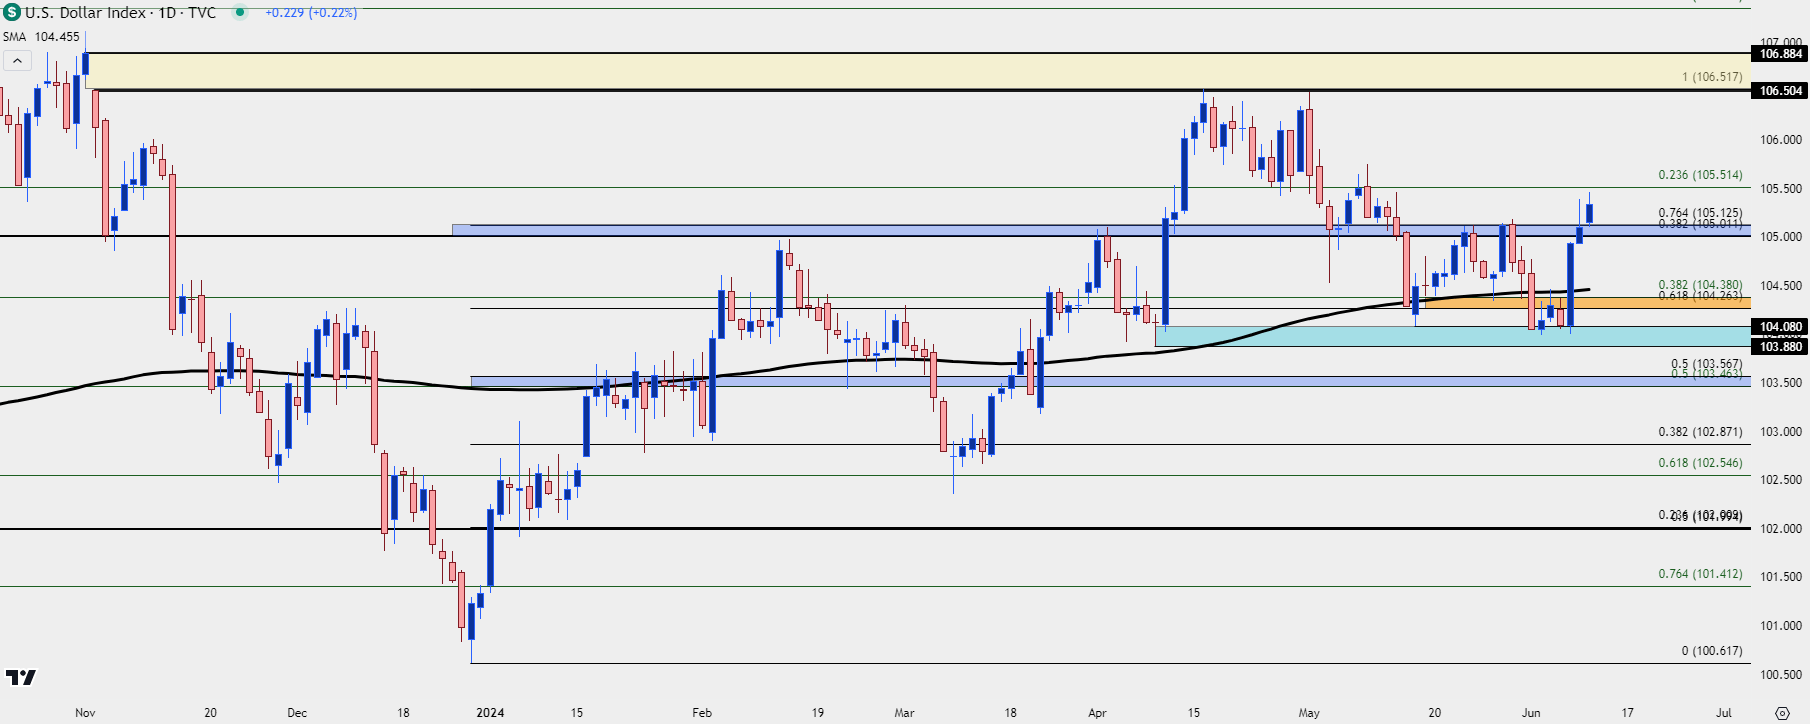 Chart prepared by James Stanley; data derived from Tradingview
EUR/USD: Rate Cut Rally Falls Flat
As illustration of just how tightly the Fed and ECB have seemed to be, last Thursday’s rate cut out of the European Central Bank actually led to a green daily bar. While the ECB did cut rates, they also were evasive about future measures and when we’re talking about the pricing in of rates, it’s often what’s on the horizon (or expected to be there) that drives the move. And the fact that the ECB demurred about a July cut and remained somewhat evasive around a move in September, the net impact was a ‘hawkish rate cut.’
The NFP report a day later, however, showed a still significant divide between the two economies. The question now is whether that can lead to continued divergence to price-in as the range in EUR/USD has been holding for more than 17 months now. And for much of this time the two central banks appeared to be aligned; and of recent the Fed’s seemed to bias towards dovishness with the ECB remaining more hawkish than what one might expect given the data.
At this point, EUR/USD is flashing oversold conditions on the four-hour chart along with a possible case of RSI divergence. This doesn’t necessarily mean that the trend is done, but it does mean that chasing could produce challenges.
EUR/USD is grasping on to Fibonacci support around 1.0725, which has some historical reference as shown in the webinar. There’s resistance potential a bit higher, around the 1.0766 Fibonacci level with the 200-day moving average a little higher, around 1.0787.
EUR/USD Four-Hour Price Chart
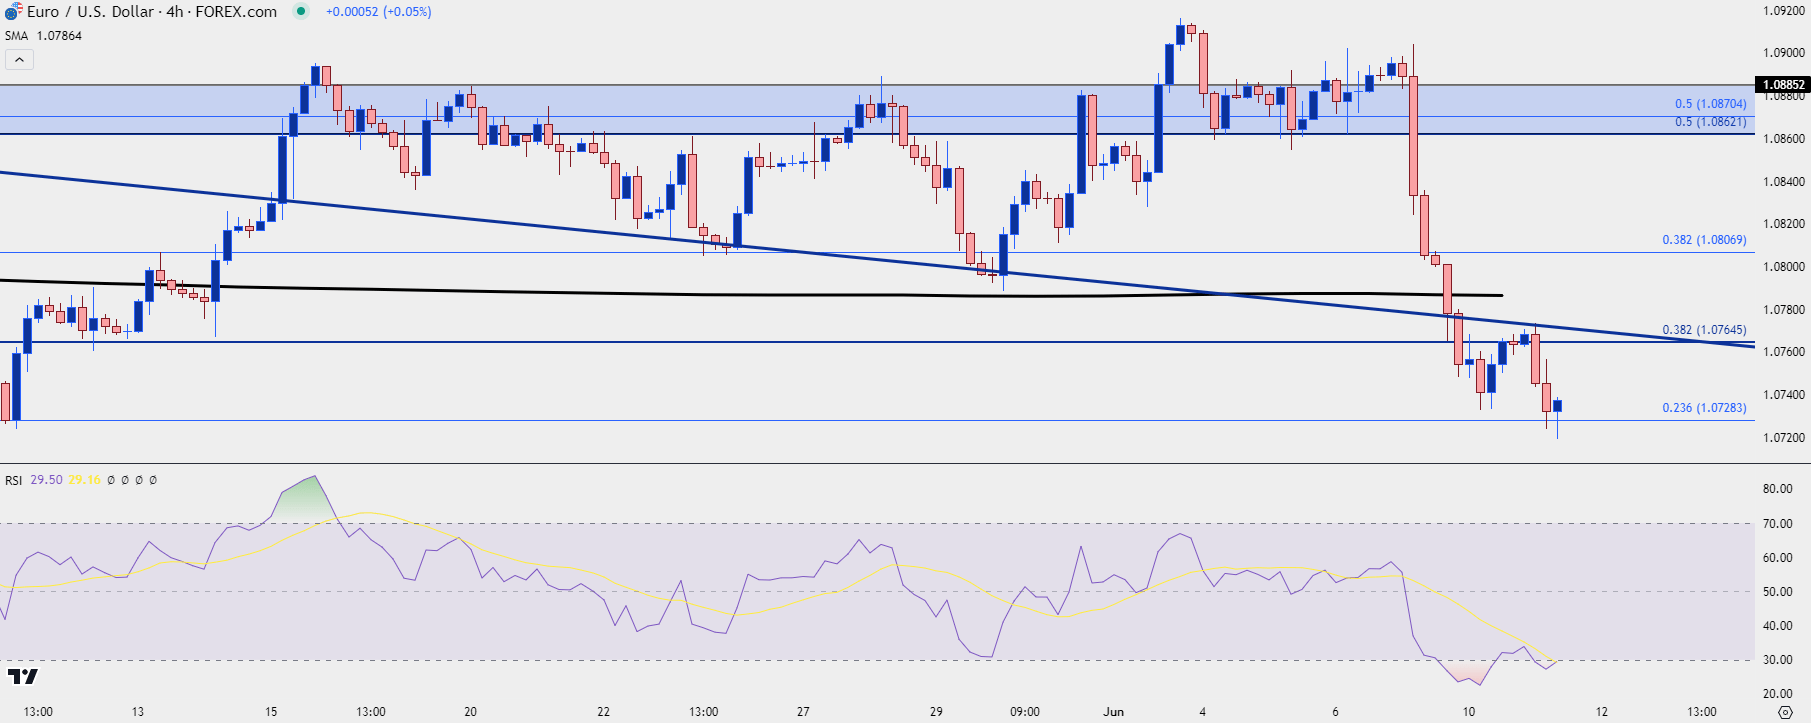 Chart prepared by James Stanley, EUR/USD on Tradingview
USD/CAD
For USD-strength scenarios, I’ve been tracking USD/CAD and that remains the case today. While there’s bullish structure to work with, there’s also some evidence suggesting that buyers are having difficulty with resistance of 1.3760. This highlights a couple of support zones a little lower, with an aggressive spot at 1.3735-1.3744, and another from 1.3700-1.3710. Below that, the Fibonacci level of 1.3652 comes back into the picture and that’s been a well-traveled level over the past year-plus.
USD/CAD Daily Price Chart
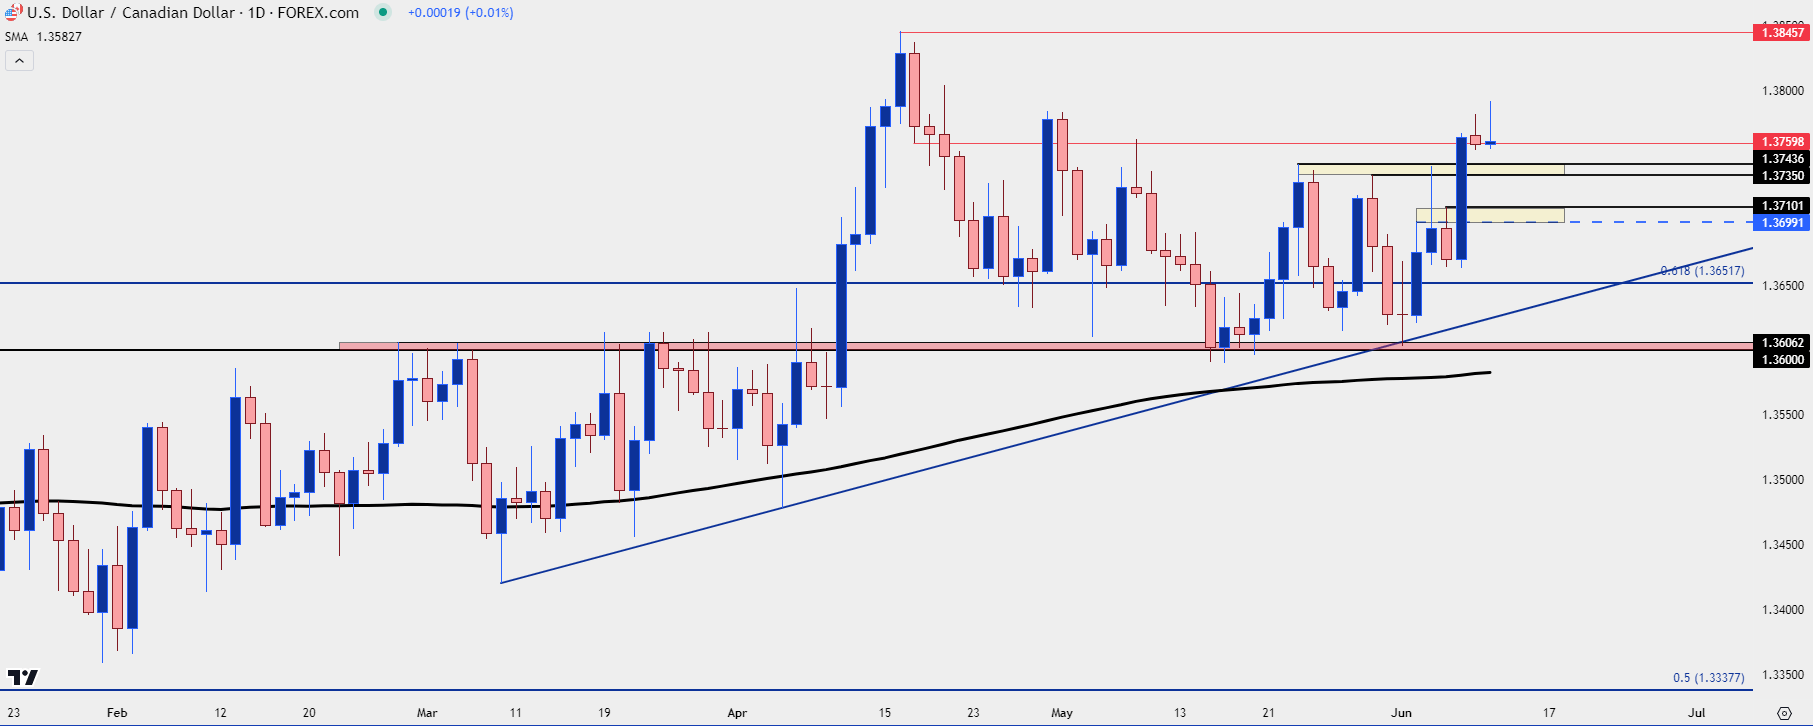 Chart prepared by James Stanley, USD/CAD on Tradingview
GBP/USD
On the other side of the USD, for Dollar-weakness scenarios, I remain interested in GBP/USD. At this point the pair is re-testing a zone of support at prior resistance, taken from the 1.2692-1.2710 zone. This is the third such test over the past few weeks and, so far, those tests have held higher-lows.
The 1.2800 level has been problematic for bulls with three different inflections over that same period of time. But, again, there’s been slightly higher-highs each instance which gives the appearance that bulls retain the ability to run a breakout.
If bulls can push the break, the 1.2900 area that was resistance in March could be vulnerable. The challenge for GBP/USD would seem to really be the 1.3000 psychological level; but that likely only comes into play in the scenario of USD-weakness after tomorrow’s events.
GBP/USD Daily Price Chart
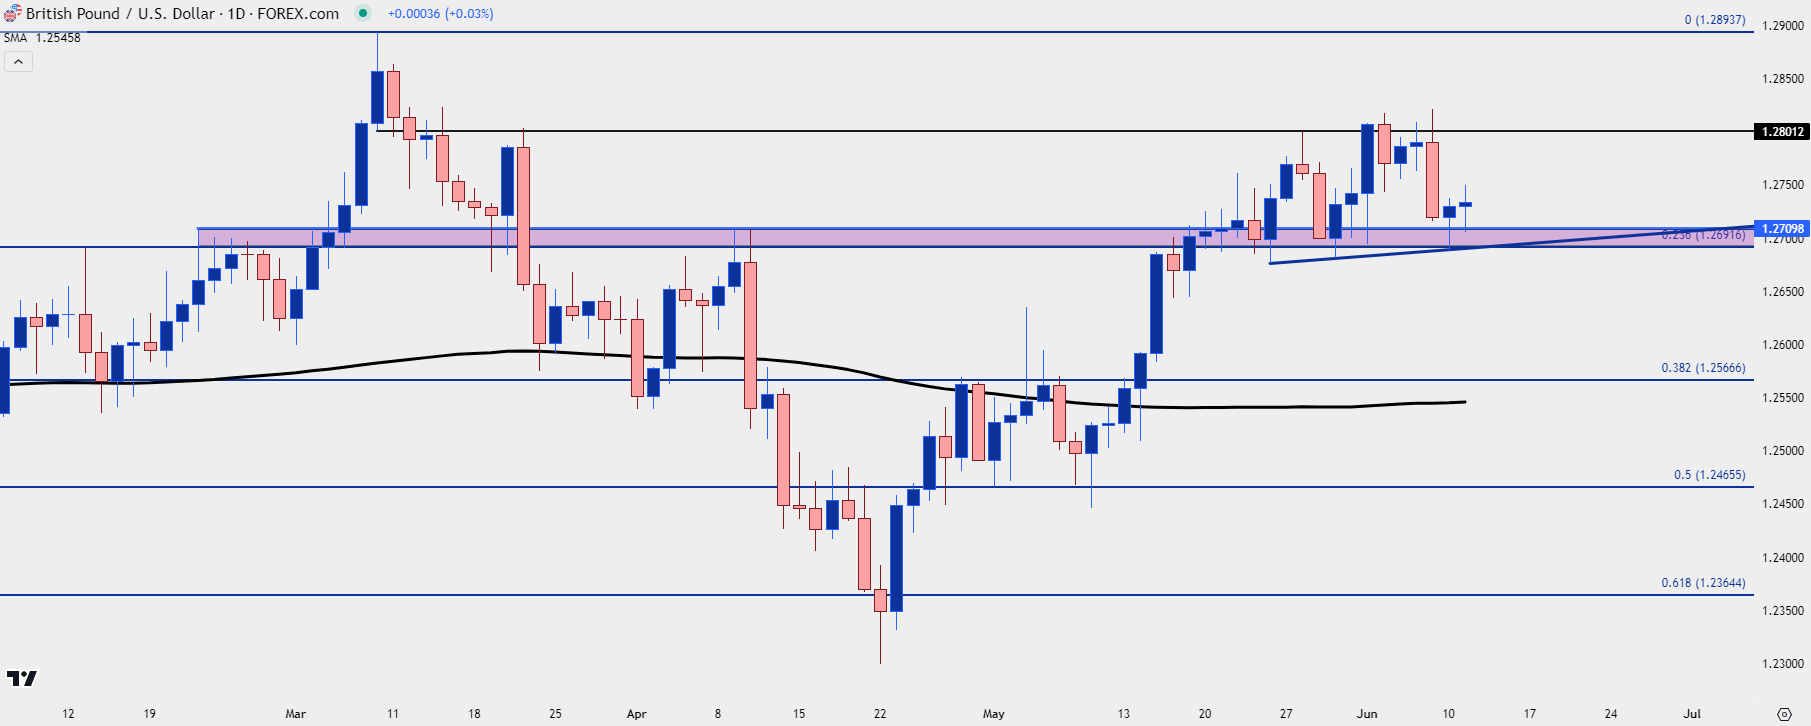 Chart prepared by James Stanley, GBP/USD on Tradingview
Stocks
I wrote about this in the weekend forecasts, but equities have started to show symptoms of stall, and there remains a case of divergence amongst the indices.
This was front-and-center coming into Q2 as S&P 500 futures set a fresh all-time-high on the first day of Q2 while Nasdaq futures set a lower-high, inside of the previously-established double top formation. The CPI print on April 10th came out strong and that pushed equity bears a bit further and the sell-off continued for a few weeks into the new quarter.
The May 1st FOMC rate decision was huge as this helped to get bulls back in the driver’s seat. The NFP report two days later was the first where the headline number missed the expectation since last November, further pushing buyers. And then the CPI print on May 15th did the same, prodding both the S&P 500 and Nasdaq to fresh all-time-highs.
Notably, however, the Dow held a lower high as it was unable to take out the 40k psychological level. And since then, the index has continued to lag, showing resistance at the underside of a trendline last week.
This both highlights a theme of interest, as in how well equities are doing that don’t have the AI-drive behind them, as well as serving as a possible strategy parameter. For those looking for equity weakness, the lagging Dow could remain a market of interest.
Dow Jones Futures (YM) Daily Price Chart
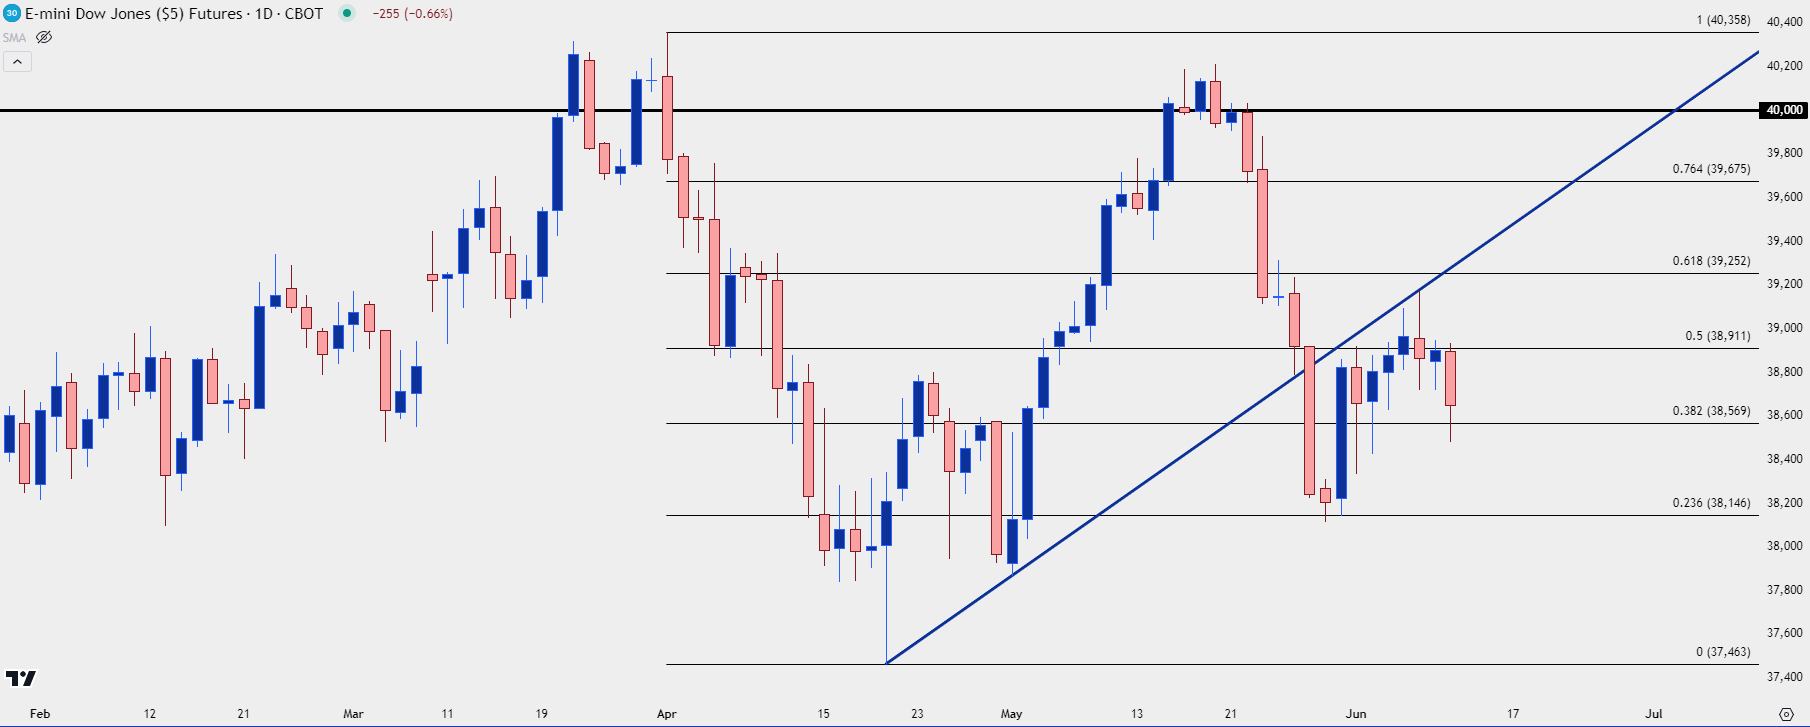 Chart prepared by James Stanley; data derived from Tradingview
Nasdaq
While the Dow finds resistance well-inside of prior structure, the Nasdaq retains a bullish look. During the webinar, price was holding a bounce from the same 19k level that had previously helped to set resistance. With the index approaching another breakout setup, this would be a difficult market to chase. But a pullback to and hold of higher-low support could open the door for topside trend potential.
Nasdaq Futures (NQ) Four-Hour Chart
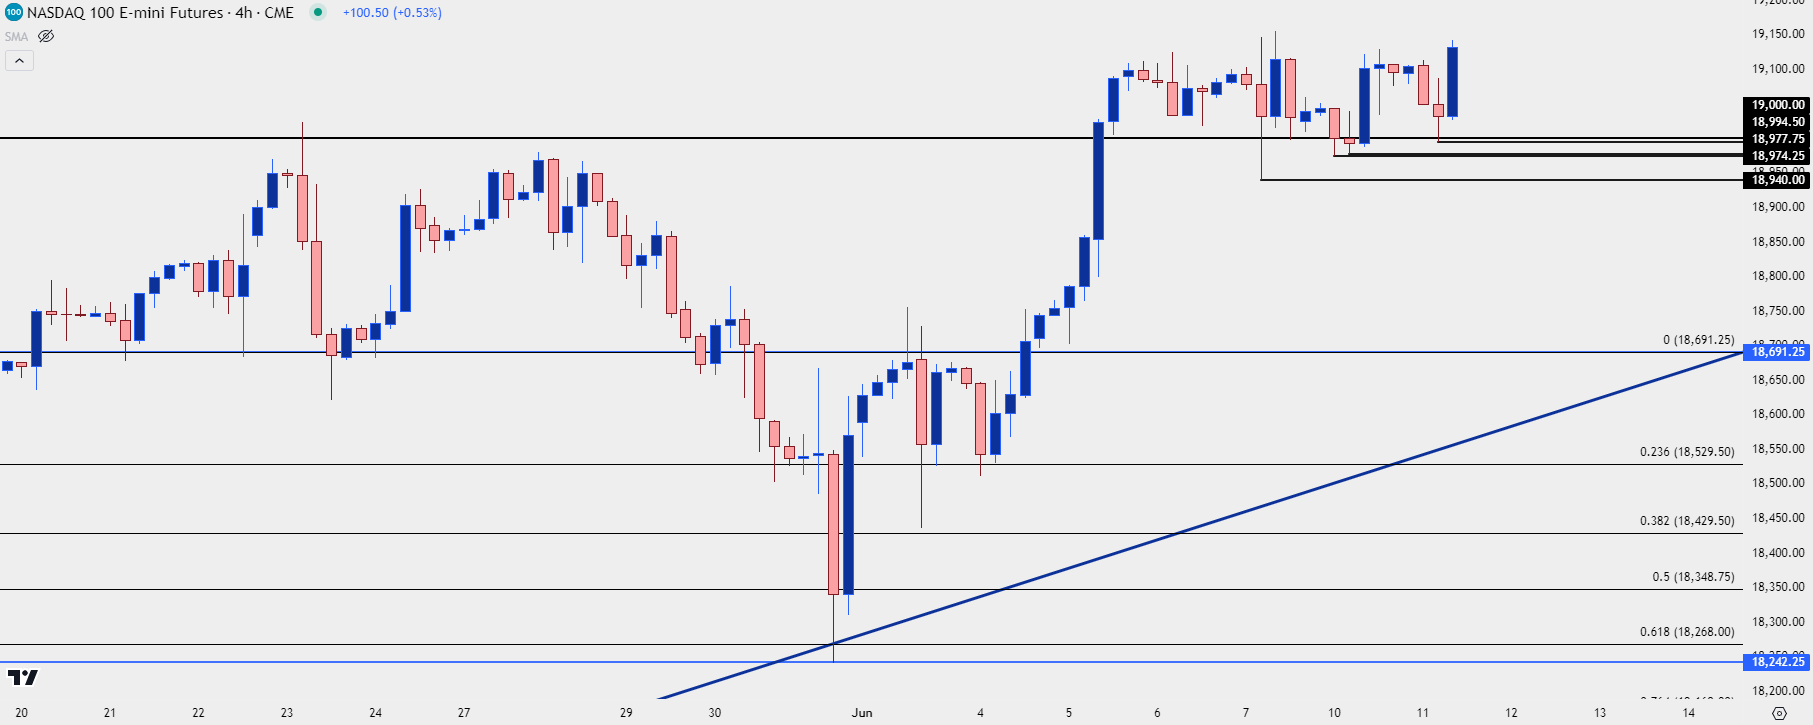 Chart prepared by James Stanley; data derived from Tradingview
S&P 500
S&P 500 futures have continued to stall near the highs, and this is the same type of thing that developed in May after the release of CPI. The pullback from that ran all the way until a trendline came into play on the morning of Core PCE, which helped to draw bulls back into the mix.
At this point, price is holding support at the 5334.50 level which had helped to set the high on the first day of Q2 trade. A bit lower, however, is a zone of interest spanning from 5285-5300. If buyers show up to hold the lows there, the door remains open for bullish scenarios.
S&P 500 Futures (ES) Daily Chart
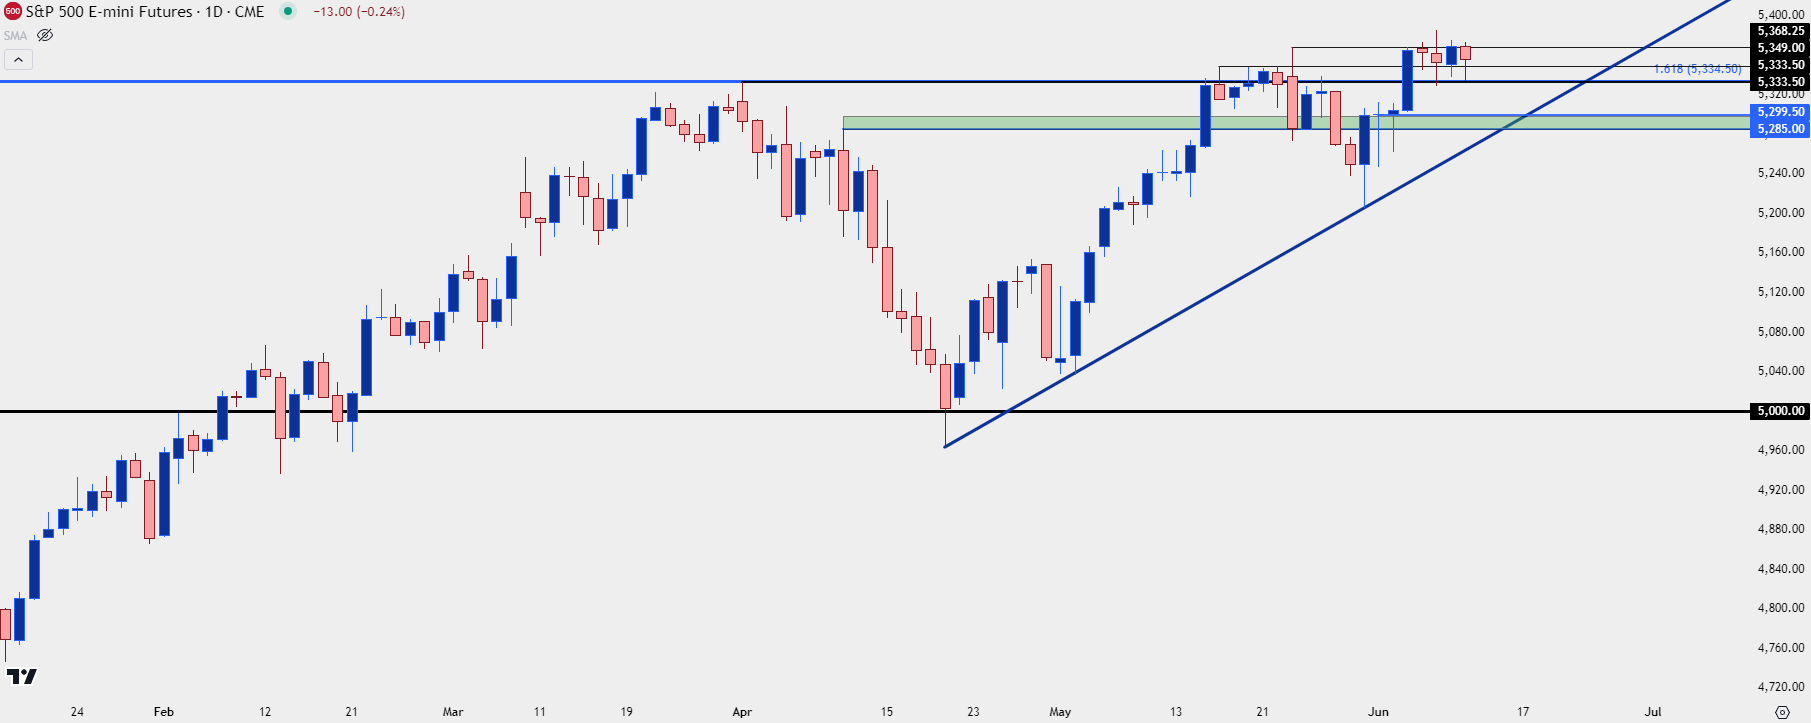 Chart prepared by James Stanley; data derived from Tradingview
--- written by James Stanley, Senior Strategist


