
FOMC, US Dollar Talking Points:
- Tomorrow brings the December FOMC rate decision and there are scant expectations for any adjustments to rates. But – this is a quarterly rate decision, and this means that the Fed will unveil updated projections and that will likely be the source of volatility across markets.
- At that last quarterly rate decision in September, the Fed pared back their expectation for cuts next year to two from a prior four while also extending their expectation for when the first cut will take place. That helped to push the USD to another fresh high, but the DXY ultimately topped two weeks after. Tomorrow will be the first update to those projections since then.
- I’ll be discussing these themes in-depth in the weekly webinar on Tuesday. It’s free for all to register: Click here to register.
Tomorrow brings the final FOMC rate decision for 2023 and expectations are scant for any actual adjustments to rates, with a current probability of a mere 1.6% chance for another 25 bp hike. While inflation remains elevated, witnessed again with this morning’s CPI report showing core inflation at 4%, the thought or hope is that the Fed has hiked so much and there may still be some transmission from those adjustments yet to show.
This is what Powell had alluded to at the November 1st FOMC rate decision and that helped to trigger a bearish run in the greenback that lasted for pretty much all of the month. This also drove an explosive move in stocks and S&P 500 futures have been up by as much as 13.92% from the October lows, with Nasdaq futures showing a whopping 17.03% maximum move over the same span of time.
This is a clear illustration of markets looking to the end of rate hikes and starting to get the ground ready for cuts in 2024. But the bigger question around the DXY given its composition with a basket of underlying currencies, is potential for rate divergence. And if the US Dollar is going to weaken, well then, we’re going to need to see strength from other currencies like the Euro, Japanese Yen or Canadian Dollar.
In the US Dollar, price has held support at a familiar level this morning around the release of CPI data and that’s at the same level that held support coming into the New Year. That plots at 103.50 and as I’ve talked about on these webinars, there’s a lot going on there. The 200-day moving average is in close proximity, as is the 50% mark of the bullish move that began in July.
The 61.8% Fibonacci retracement of that move is what helped to hold the low two weeks ago, and that then led into the first green week in the USD since the November CPI report.
US Dollar Weekly Price Chart (indicative)
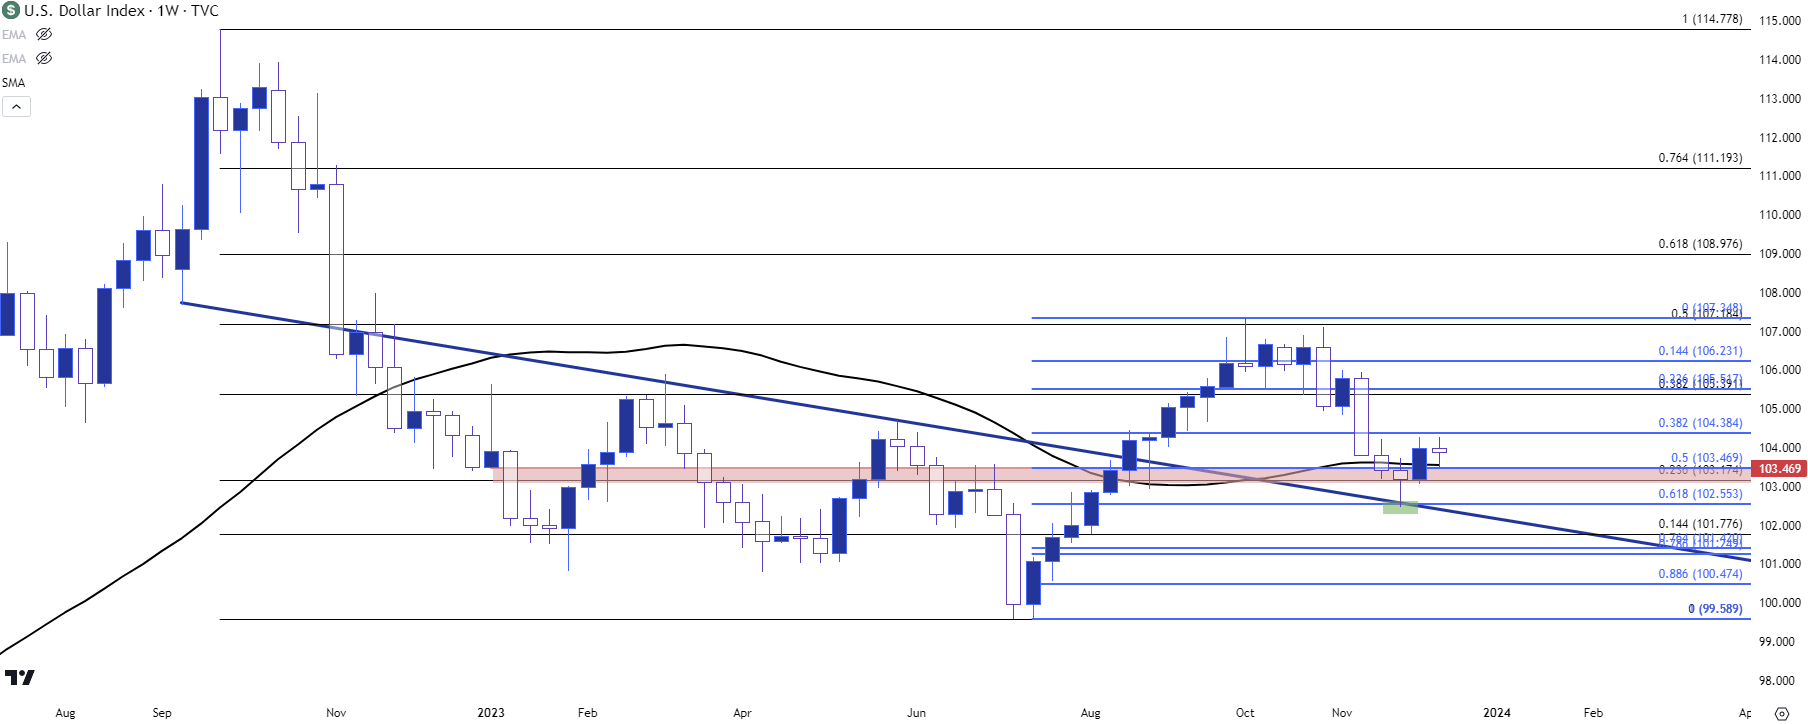 Chart prepared by James Stanley; data derived from Tradingview
US Dollar
From the daily chart below, we can get a better view of that recent defense of the 103.50 zone with another iteration this morning. Resistance has so far held around 104.20 and there’s another spot of interest a little higher, around the Fibonacci level at 104.38. I have the 200-day moving average plotted in red on the below chart, and we can see where three of the past four days have seen support from there, further illustrating bullish tendencies as bulls have held a higher-low after last week’s strength.
US Dollar Daily Chart (indicative)
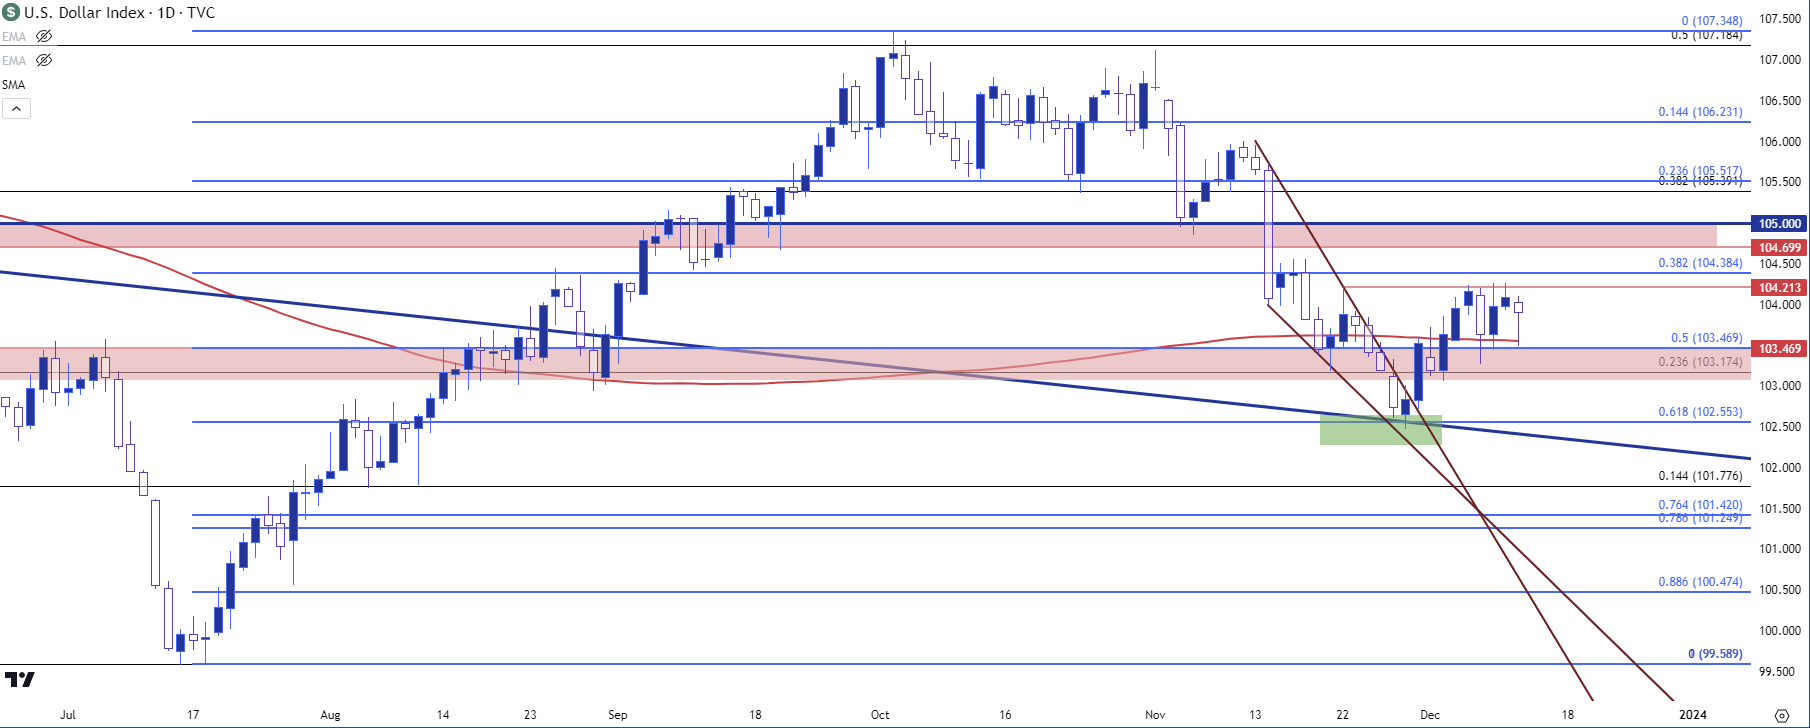 Chart prepared by James Stanley; data derived from Tradingview
EUR/USD
I’ve been tracking the support zone around 1.0750 since the pair started to show tendencies of topping at 1.1000. That zone has now held support for almost a full week after coming back into the picture last Wednesday.
For this morning, it was the 200-day moving average (shown in blue below) that held the highs and price immediately retreated to support. But – that support zone may not be able to hold for much longer if bears continue to push, as it gave way to a temporary breach last week and buyers haven’t exactly been able to extend the bounce.
This puts focus on deeper supports with a confluent zone plotted around 1.0638-1.0666.
EUR/USD Daily Price Chart
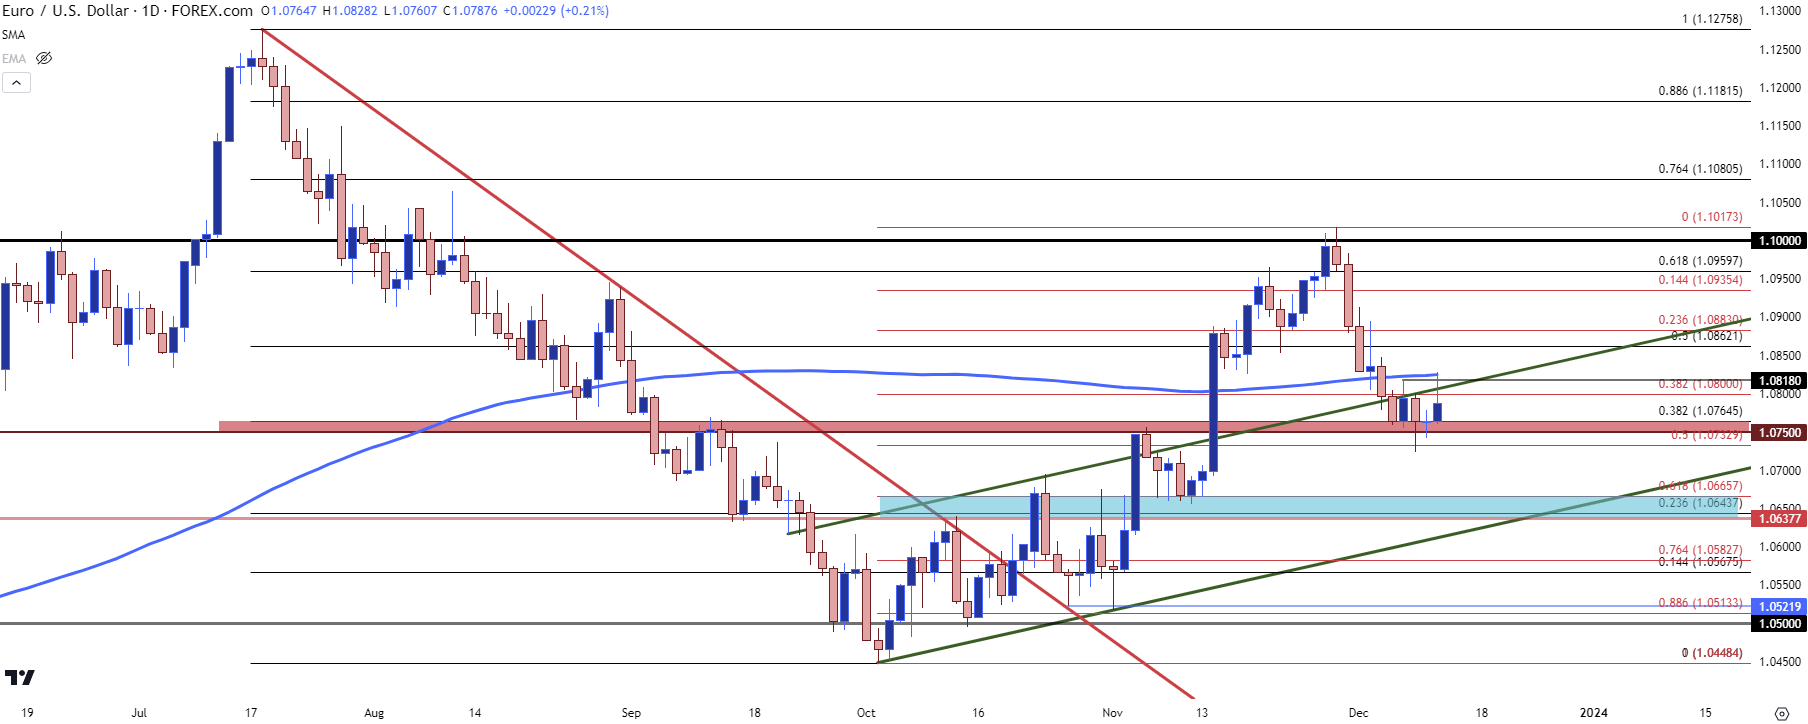 Chart prepared by James Stanley, EUR/USD on Tradingview
GBP/USD
Cable continues to show some cleanliness around levels: The 1.2720-1.2758 zone has now held two separate resistance reactions, with the latter iteration leading to a pullback down to support at the psychological 1.2500 level. That support has since held, and the bounce that followed has largely been resisted at 1.2590, which was prior support.
So far this week mean reversion has been the name of the game and this makes it difficult to get a directional tonality: But given proximity to support and resistance zones there could be some items of interest here. If bears can elicit a push below 1.2500 there’s another support zone just below (in blue) spanning from 1.2447 up to 1.2481.
If bears can get the fresh low but then get stalled in that support just below the 1.2500 handle, there could be an opening for reversal scenarios.
On the upper side of price action, that 1.2720-1.2758 zone is fairly far away so it can make plotting around it as somewhat of a challenge. There are a few levels of interest above 1.2590, however, with 1.2614 and 1.2665 sticking out.
GBP/USD Daily Price Chart
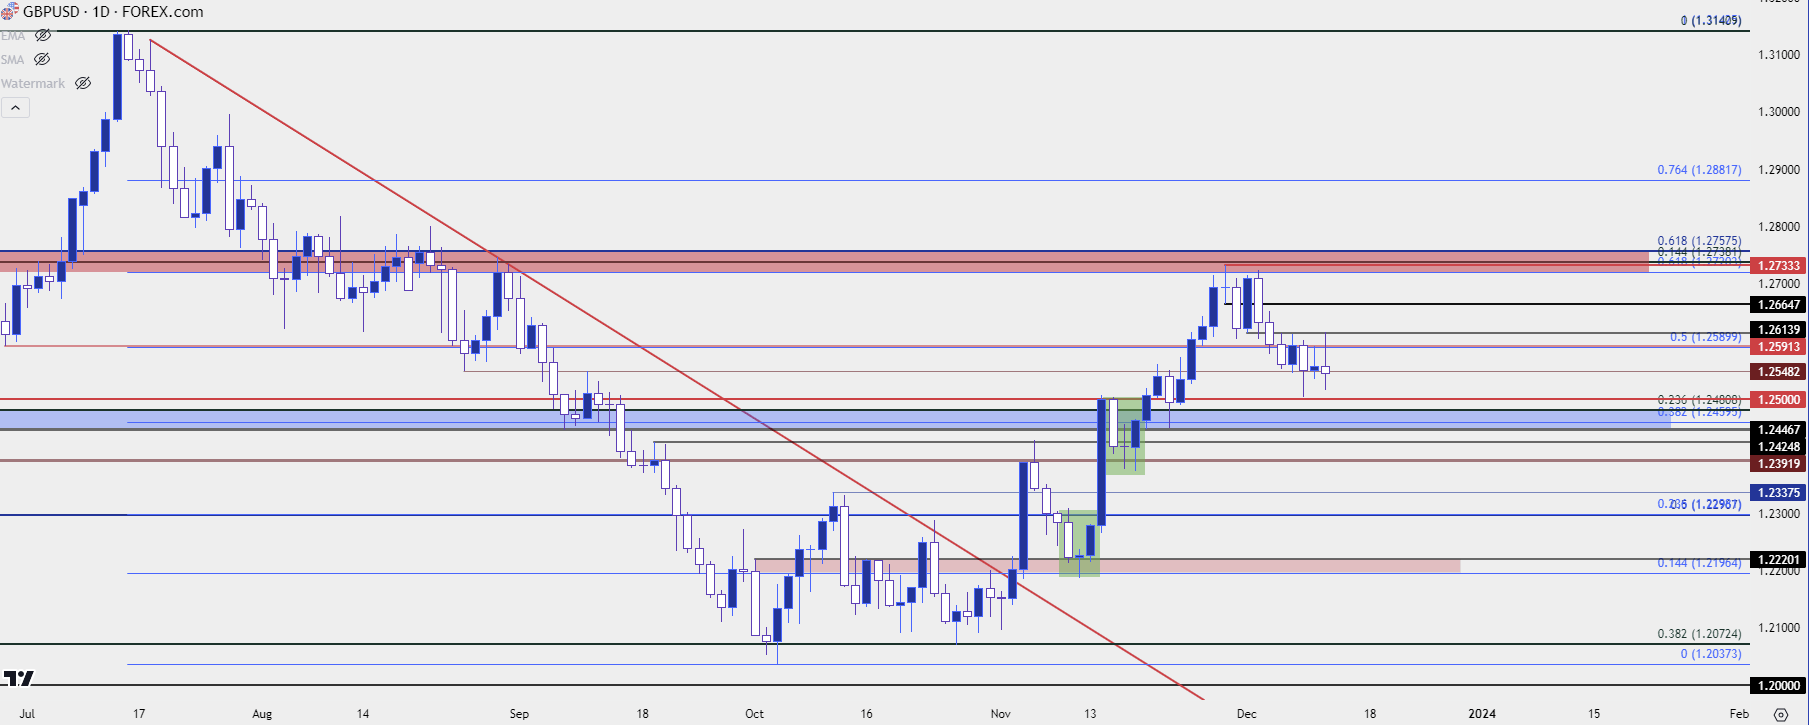 Chart prepared by James Stanley, GBP/USD on Tradingview
USD/CAD
USD/CAD could remain an item of interest for USD bears. The pair put in a strong downside move as commodity currencies picked up the pace in the last week of November, allowing for a breakdown in USD/CAD that stretched all the way to the 1.3500 level. That price has since offered support and a pullback has developed, but there’s now a wide swath of possible resistance sitting overhead. The same 1.0625 level remains of interest that I had looked at last week, but it’s the zone around 1.3652 that’s really imposing and that’s another spot that bulls will have to contend with if they try to push the short-term breakout.
On the underside of price action, there’s a wide zone spanning from 1.3338 up to 1.3387. It was last in-play in September, just ahead of the FOMC rate decision.
USD/CAD Daily Price Chart
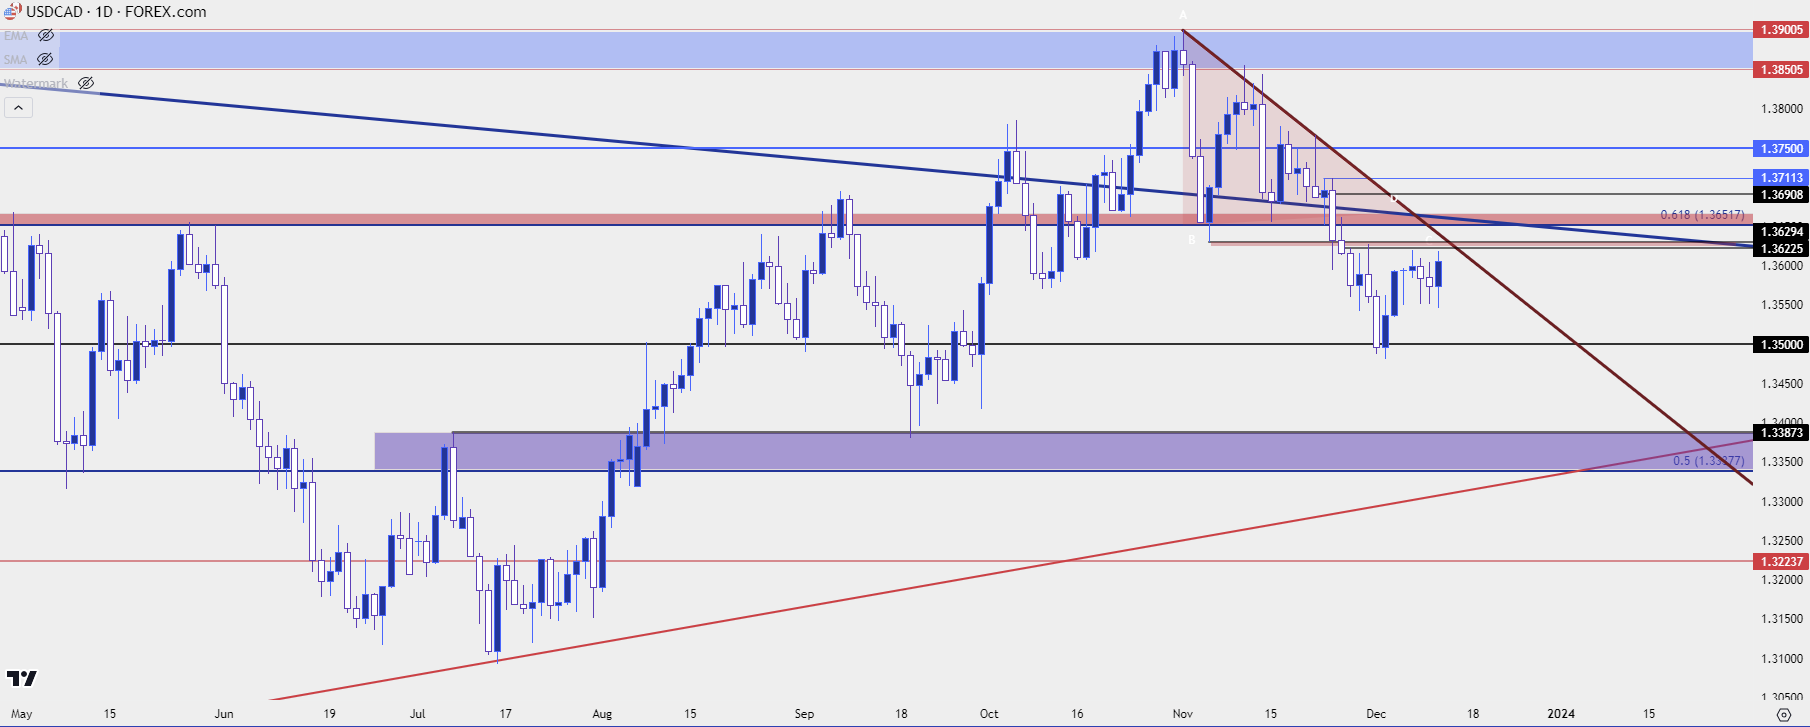 Chart prepared by James Stanley, USD/CAD on Tradingview
Gold
Gold markets have shown extreme volatility of late and rate expectations have certainly seemed to play a role.
There was a strong bearish move that developed after the September FOMC rate decision, which led Gold into that deeply oversold state that showed up in early-October. After rallying for much of October and November, prices attempted to breakout but were aggressively snapped back. Last week saw a weekly close above the $2k level but bears have continued to push so far this week and it looks like spot Gold may be heading back towards another 200-day moving average re-test, which currently projects to around 1950, which is very nearby the swing high from September FOMC.
Gold (XAU/USD) Daily Price Chart
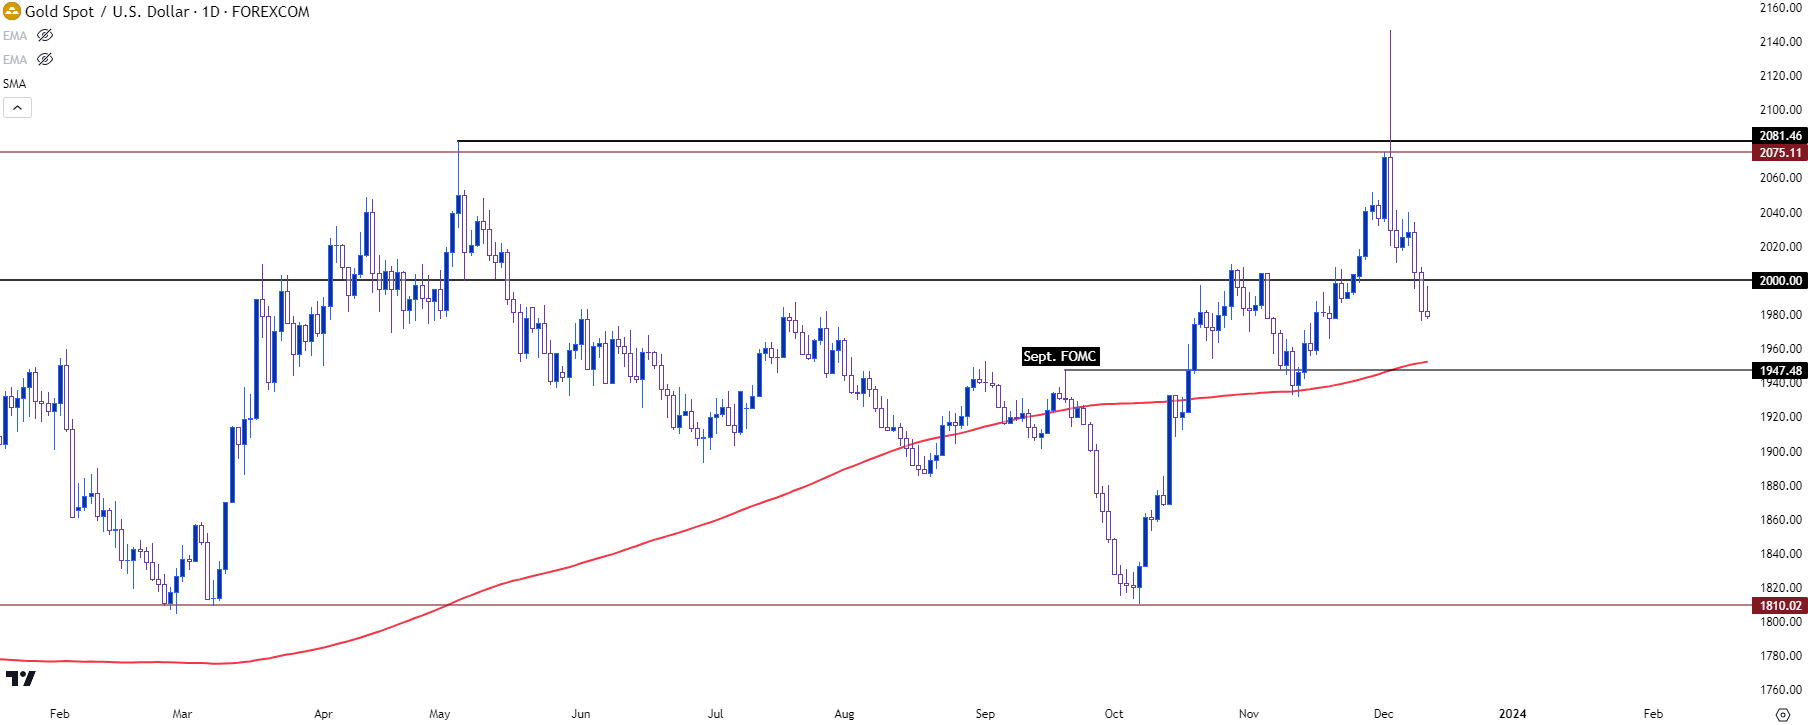 Chart prepared by James Stanley, Gold on Tradingview
--- written by James Stanley, Senior Strategist


