FOMC, USD, EUR/USD, USD/JPY, Gold Talking Points:
- The next three days are loaded with macro headline risk. The Fed is the obvious point of contention, but there’s an ECB rate decision tomorrow and then the release of Core PCE out of the United States on Friday.
- Markets are currently expecting that tomorrow’s rate hike will be the final push of tightening from the Fed this year, with lower probabilities of another 25 bp hike after tomorrow’s move. For tomorrow, probabilities were showing near-99%, so the Fed deviating from a 25 bp move would likely create turmoil. The big push point for tomorrow is what the bank says for the rest of the year.
- This is an archived webinar that we host every Tuesday at 1PM ET. If you’d like to register, it’s free to do so from the following link: Click here to register.
The rest of this week brings some heavy headline risk. Tomorrow’s FOMC rate decision is widely expected to bring another 25 bp hike. But, after that, far more questions remain and as I discussed in the webinar, markets are currently expecting that tomorrow’s hike may be the Fed’s final such move for 2023.
After that is the ECB scheduled for Thursday morning and of recent, the focal point has been on European data which has started to show the toll of the bank’s hawkish stance and run of rate hikes. While there’s been a lot of waiting for lag effects in the US with some data points remaining stubbornly strong, European data has started to take a negative turn, again reiterated in the PMI reports issued to start this week.
And then Friday shifts the focus back to inflation data in the US, where Core PCE is expected to come out at 4.2%. That’s encouraging for the fight against inflation but it’s still well-elevated beyond the Fed’s 2% target. And, nonetheless, this remains a push point for themes around USD and EUR/USD especially as there’s a prospect of divergence with one bank slowing and the other continuing to tilt rates higher.
From a price action perspective, this week’s webinar very much continued the theme from last week, in which the dominant trend in both USD and EUR/USD had started to pull back. And now, at this point, short-term trends in USD are bullish but still at odds with the longer-term bearish scenario that could get another shot-in-the-arm if bears defend the 102.00 handle at tomorrow’s rate decision.
US Dollar
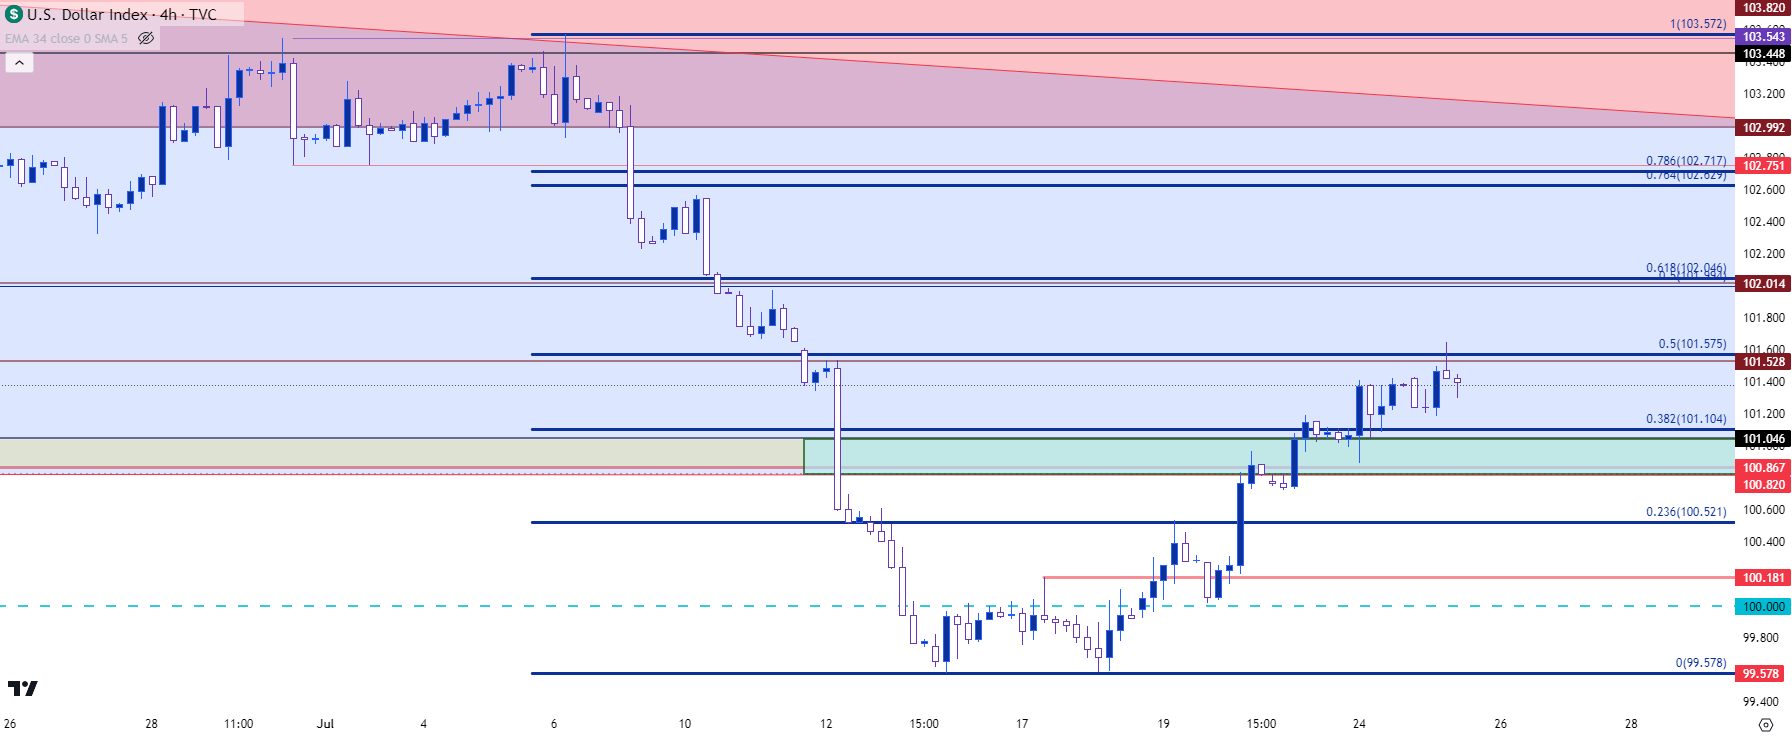
Last week I had looked at a short-term double bottom pattern, which opened the door for a pullback in the bearish breakout to re-test prior support as lower-high resistance. That was around the 100.80-101 area, and bulls have continued to push with resistance showing around 101.50 at the time of the webinar.
This is 50% of the recent sell-off and it keeps the door open for bulls on a short-term basis if they can hold higher-low support above 100.80-101. And above current price, the 102 level looms large as this is the 50% mark from the 2021-2022 major move, and this price had helped to set the low for the month of June. It’s also confluent with the 61.8% retracement of the recent bearish move.
So, if sellers can hold the highs as a lower-high, they can keep the door open for bearish trend continuation scenarios. But, on that topic, there’s likely a related question regarding the Euro and the ECB rate decision scheduled for the morning after.
US Dollar - DXY Four Hour Price Chart (indicative only, not available on Forex.com platforms)
 Chart prepared by James Stanley; data derived from Tradingview
EUR/USD
The morning after the Fed brings the European Central Bank, and of recent there’s been the unusual expectation for the ECB to remain hawkish which, historically speaking, hasn’t been all too frequent. But after the deluge in the single currency last year, which helped to fuel even more inflation, the ECB has had a tendency to display their hawkishness, and this seems to be for a very operable reason of trying to strengthen then Euro to get some help on that inflation.
Well, inflation remains above target but other data points are starting to show concern, such as the PMIs from Monday of this week or the Europe Bank Lending Survey from earlier today which shows a fast response to that higher-rate backdrop. This has raised questions around how hawkish the ECB might be for Thursday and thereafter. And while this is like the backdrop around the Fed the large difference is how quickly that data has been impacted. There is, after all, a reason the ECB was slower to come to the table with rate hikes and that was concerns around growth. The question now is how persistent the bank might remain to be.
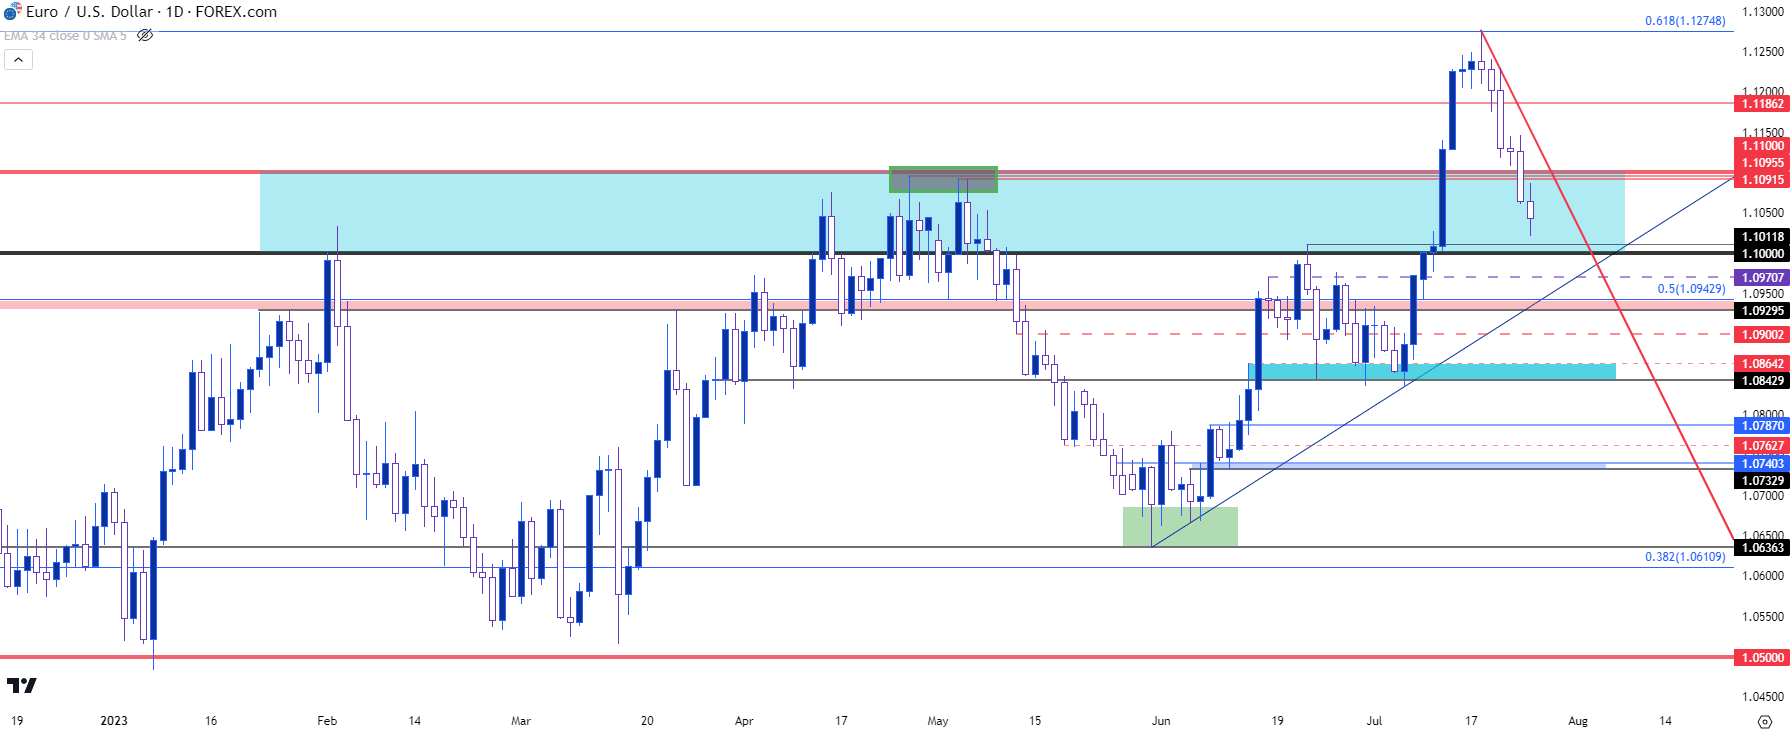
In EUR/USD, the same scenario looked at last week remains of issue. A strong bullish breakout met resistance last Tuesday and prices have been pulling back ever since, with today showing as the sixth consecutive red day on the EUR/USD chart. That’s something that hasn’t happened since the pair bottomed in September of last year.
So there’s bearish short-term motivation. Longer-term, however, we’re re-testing the same zone of prior resistance from the 1.1000-1.1100 handle. As I shared on the webinar, there’s also support potential around 1.0943, which is the 50% mark from the same Fibonacci retracement that produced the 61.8% at the current high of 1.1275. That 1.0943 level also seems to be confluent with a bullish trendline over the next day or so.
EUR/USD Daily Price Chart
 Chart prepared by James Stanley, EUR/USD on Tradingview
USD/JPY
Not to get lost in the shuffle, there’s a Bank of Japan rate decision on Thursday night/Friday morning in Asia. There are scant expectations for any change from the Bank of Japan at this point. But, the continued passive and dovish stance of the BoJ can set up the Yen as an offset for strength elsewhere. As in, if the Fed does signal a second hike in 2023 or if the ECB does something similar, this can keep bulls in order in USD/JPY and/or EUR/JPY.
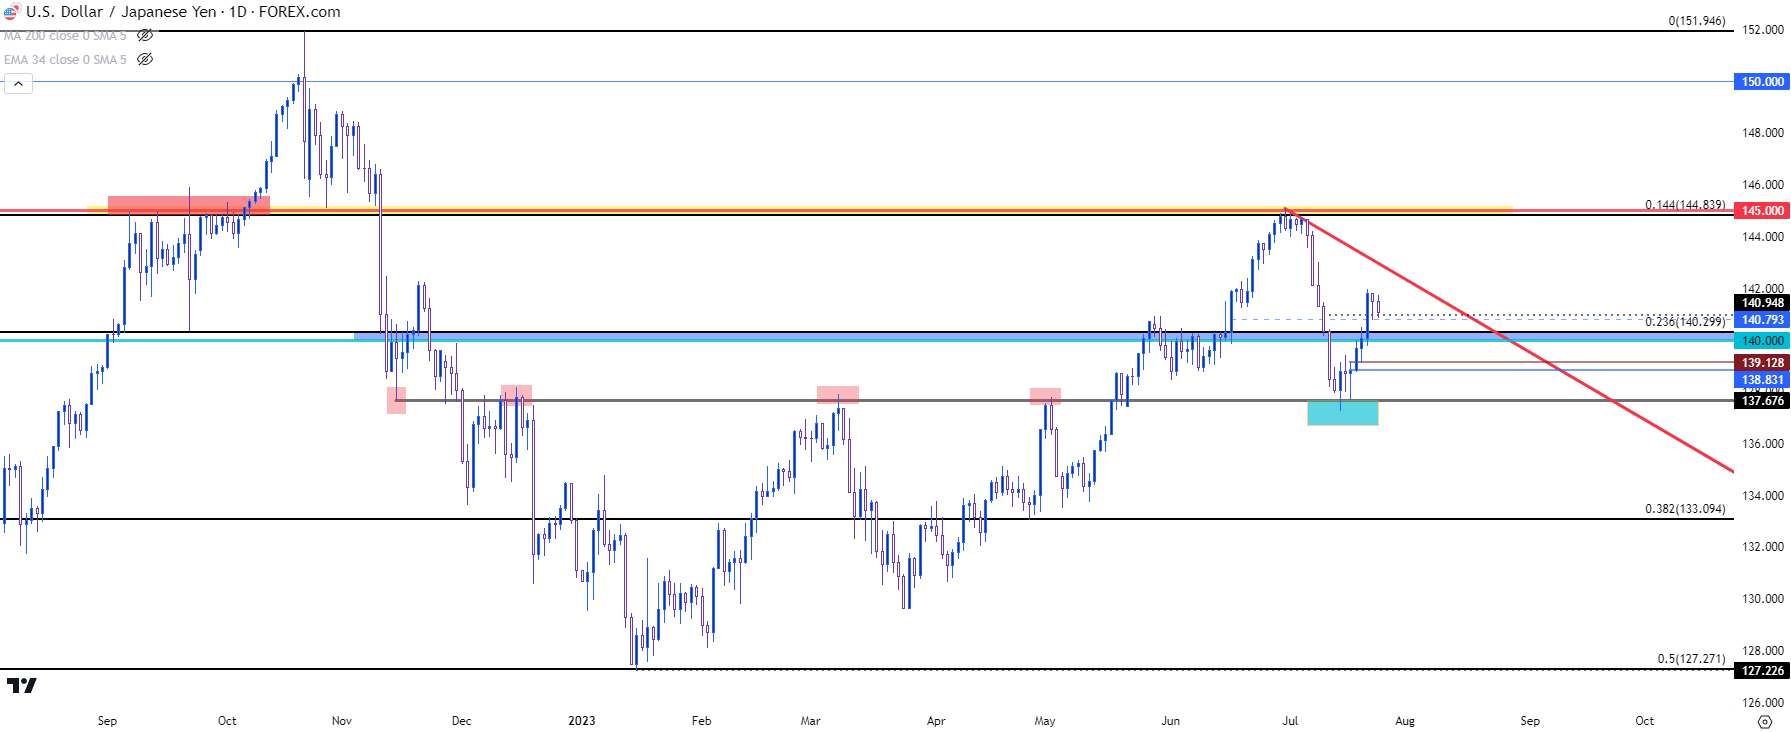
In USD/JPY, the bullish trend has continued after support came into play a couple of weeks ago at 137.68. During the webinar, price was appearing to grasp on to the 140.95 level, but the more interesting level for higher-low support potential is the zone that runs from 140.00-140.30, the latter of which is a Fibonacci level of note.
I think the daily chart below shows this well, as there’s a strong short-term theme that’s shown aggressive lift over the past few trading days. But, still no support test at prior resistance around 140.00.
USD/JPY Daily Price Chart
 Chart prepared by James Stanley, USD/JPY on Tradingview
Gold
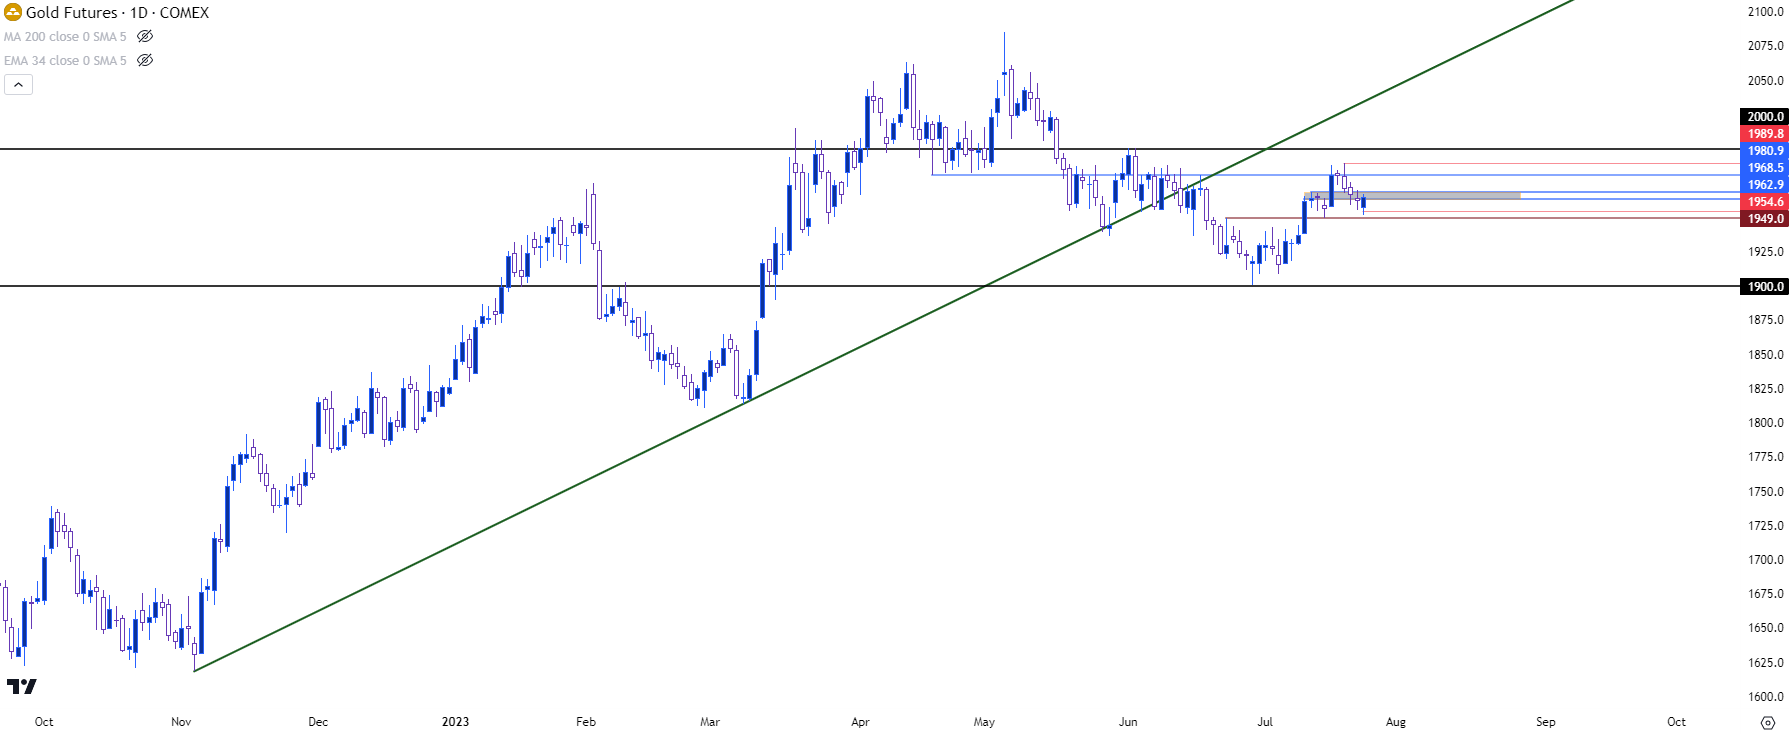
Since the USD will likely be centerstage for the next few days the dynamics in Gold could be of note. As I shared during the webinar, my concern is the $2,000/oz level which hasn’t come back into play, but the fact that sellers started to push after a resistance test around the 1990 level indicates that bullish sentiment may be waning after the 1900 support test in June.
From the daily chart, the bullish move still seems to be corrective in a broader bearish theme and that 2k level looms large for that scenario as it helped to mark the high in May and hasn’t been re-tested since. But bulls aren’t out of the equation yet, as higher-low support has held above the prior swing low around the 1949 level.
Gold Futures - Daily Price Chart (indicative only)
 Chart prepared by James Stanley, Gold on Tradingview
--- written by James Stanley, Senior Strategist


