
U.S. Dollar, FOMC Talking Points:
- Tomorrow brings a FOMC rate decision that could prod volatility across several markets. There’s no expectation for any actual moves but the Fed’s projections, combined with the tone from the press conference, will probably end up being the key drivers.
- The Fed’s last set of projections in December forecast three 25 bp cuts for this year. At this point there’s a near 60% probability of at least one cut around the June rate decision. If the Fed reduces their expectation to two cuts for this year from the prior three, that could provide fundamental impetus for USD-strength.
- This is an archived webinar and you’re welcome to join the next one. It’s free for all to register: Click here to register.
We’re almost to the next FOMC rate decision and there’s several questions to be answered tomorrow. Given the almost non-existent expectation for any actual moves tomorrow, the driver will likely emanate from the Fed’s forecast and the accompanying press conference. The big one, of course, is rate cuts: When they might begin and how much might the Fed be expecting to cut. The first question will likely not be answered directly tomorrow but based on the answer to the second there could be some deduction that could offer clarity.
There are seven rate decisions from the Fed left this year, including tomorrow. If they don’t hike tomorrow, that means there are six left and if the market is looking for three rate cuts then that would set June as the target date for cuts to begin. If the Fed retains that stance, looking for three cuts this year, we’ll likely see June in-play as a starting point. But as we’ve looked at before and as I shared in this webinar, the labor market in the U.S. has remained very strong and depending on how you look at inflation, justifying cuts could be difficult at this point.
So, if the Fed does tamp that expectation for cuts this year down to two, well then, we could quickly see June get priced-out and that could lead to USD-strength as markets reduce rate cut bets around the FOMC for 2024. Also of interest for that theme is the fact that we might see a rate cut from the ECB before the Fed, and that could further add pressure to the downside of EUR/USD.
Ahead of the rate decision, the USD is showing strength, rallying back above the 200-day moving average that’s been somewhat of a sticking point this year.
As I’ve been discussing on webinars, it seems as though the ‘natural flow’ of the USD is and has been higher. But the Fed has been very dovish, witnessed again last month after the CPI report was released in February. At the time the USD had just set a fresh three-month high, testing just inside of the 105.00 area on DXY. But it was the morning after that inflation data that Austan Goolsbee said market participants should avoid getting ‘flipped out’ about the inflation print. The USD began to pullback and before you know it, there was some soft data to work with via Core PCE that gave Dollar bears another shot-in-the-arm. But – ever since the NFP report earlier this month USD bulls have been making a return, and they now have a 200dma break to work with.
In the webinar I looked at price levels along with that shorter-term bullish structure.
U.S. Dollar Daily Price Chart
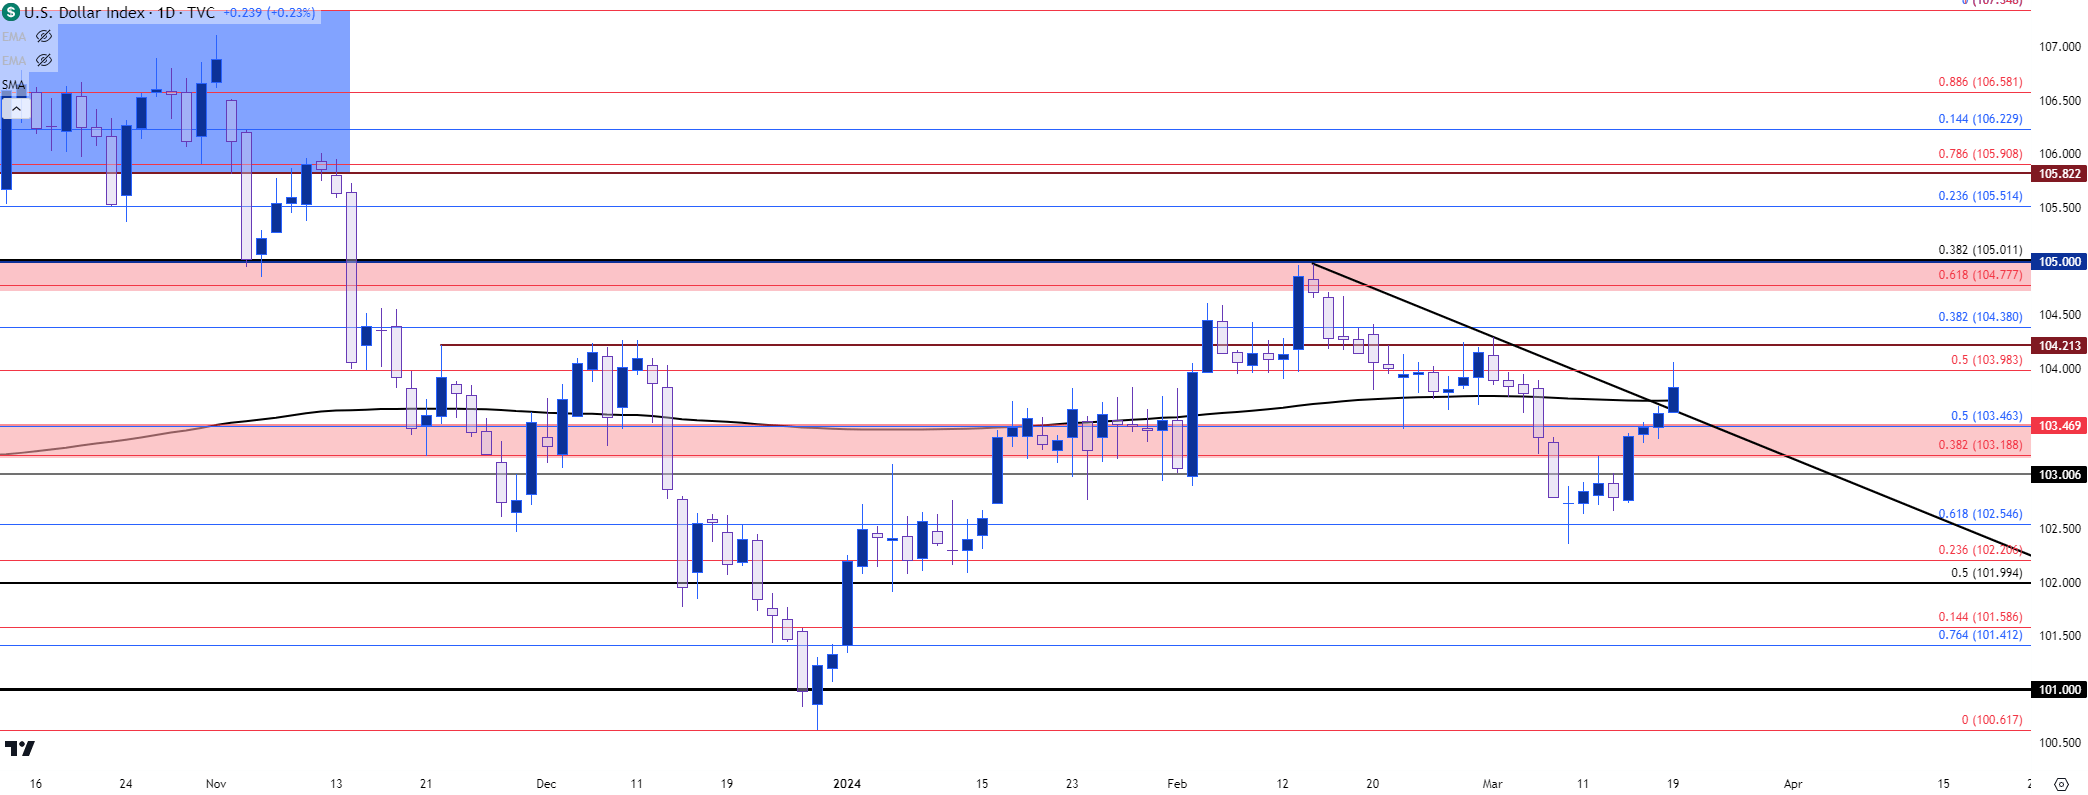 Chart prepared by James Stanley; data derived from Tradingview
EUR/USD
EUR/USD has put in a test of the 200-dma earlier this morning and, so far, that’s helped to hold the low of the day. But there’s a similar dynamic here, where a bullish trend started against that bearish trend in the USD around the Austan Goolsbee comment. That built a bullish channel in EUR/USD which has just started to give way.
Longer-term, price remains in the same range that’s been in-place for the past fifteen months and this could impact reward targeting as even breaks or trends on a shorter-term basis may soon run into longer-term support/resistance from the range.
On a short-term basis, there’s resistance potential at 1.0877 and then 1.0903. If bulls can mount above that latter level, then focus shifts right back to the 1.0943-1.0960 zone. For support, the 200-dma remains important and below that is a zone running from 1.0750-1.0766. After that, we have the same 1.0695 that was last in-play on the morning of Austan Goolsbee’s comment.
EUR/USD Daily Price Chart
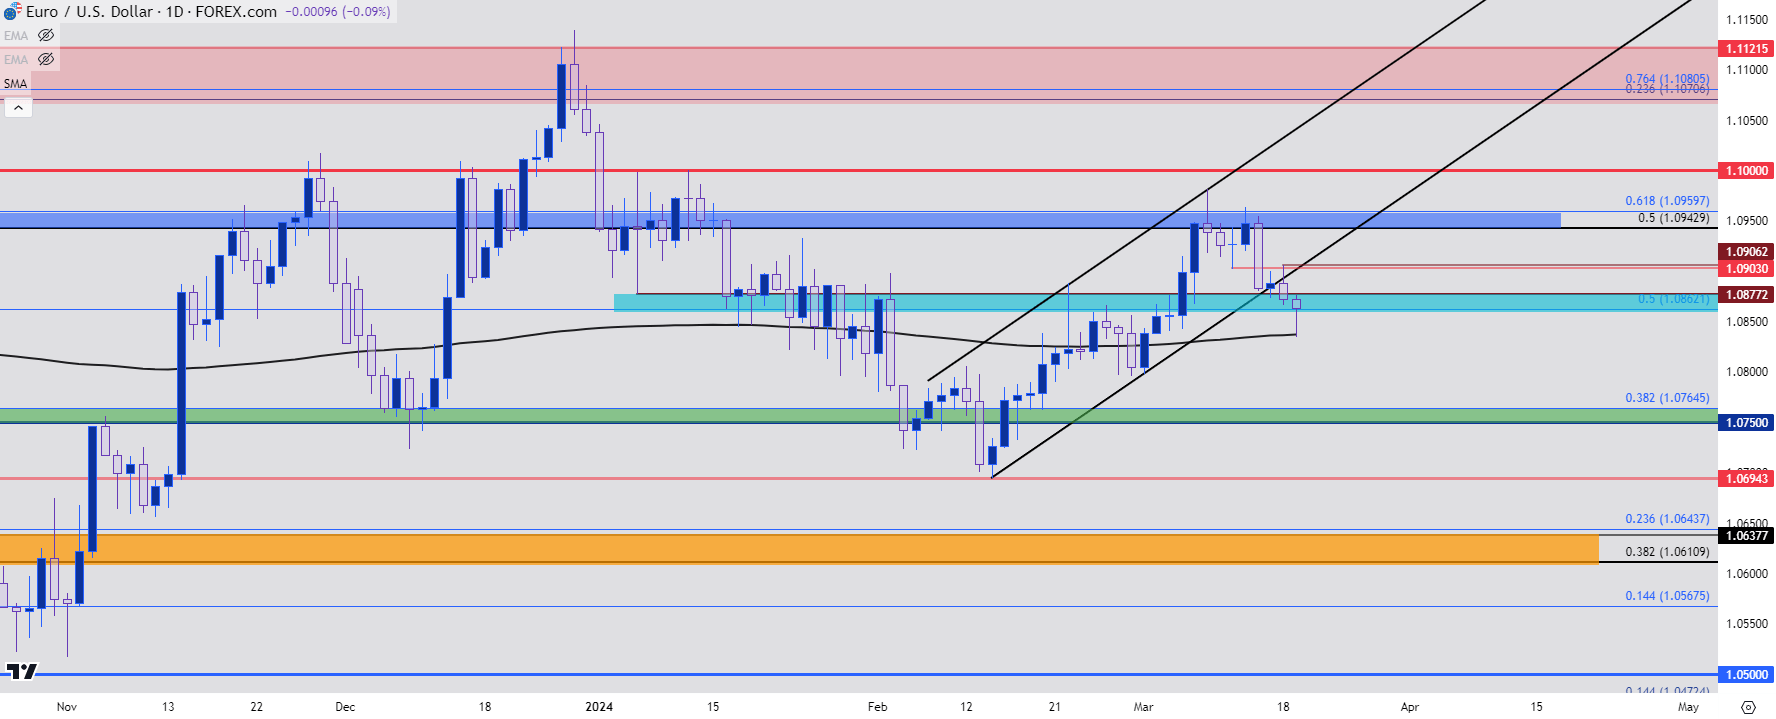 Chart prepared by James Stanley, EUR/USD on Tradingview
USD/JPY
I used this as a talking point in the webinar as there’s an important lesson here. Guessing data releases or around central bank rate decisions can be dangerous. The obvious is that there’s no way to predict what they’ll say or what that data will print at, much like we’re discussing around the FOMC right now. It’s simply impossible to know what will happen. Sure, we can guess or deduce or strategize but there will always be risk with that, and that part is fairly obvious.
But perhaps more important is that even if you could guess the outcome of a data release or a rate meeting, there’s no way of knowing exactly how the market will react.
This has taken place in USD/JPY last night and as of this writing, it looks like the Bank of Japan did a great job in making what could’ve quickly turned out to be a risky move. We’re still in the early stages, however, so victory laps should wait for more data and confirmation.
But the BoJ pushed away from the negative rate regime in perhaps the most dovish way possible. Central bank rates were adjusted 20 bps higher, from -0.10 up to 0.10 and bond purchases remained the same. So, the carry trade wasn’t very unsettled as the change in rates was rather minimal. And USD/JPY jumped right back into the 150-152 resistance zone.
As I had looked at last week around the JPY, for those looking for Yen-weakness scenarios, GBP/JPY and perhaps even EUR/JPY could remain of interest.
In USD/JPY, this is perhaps one of the more interesting venues in the event of a dovish FOMC tomorrow. If the Fed does stick with their expectation for three cuts this year, that could lead to some USD-weakness and that’s something that could shake the branch of the carry trade tree. That’s what led to strong pullbacks in Q4 for each of the past two years; and now that the BoJ has shifted away from negative rates there could be even less motive for USD/JPY bulls to hold on to the trend.
USD/JPY Daily Price Chart
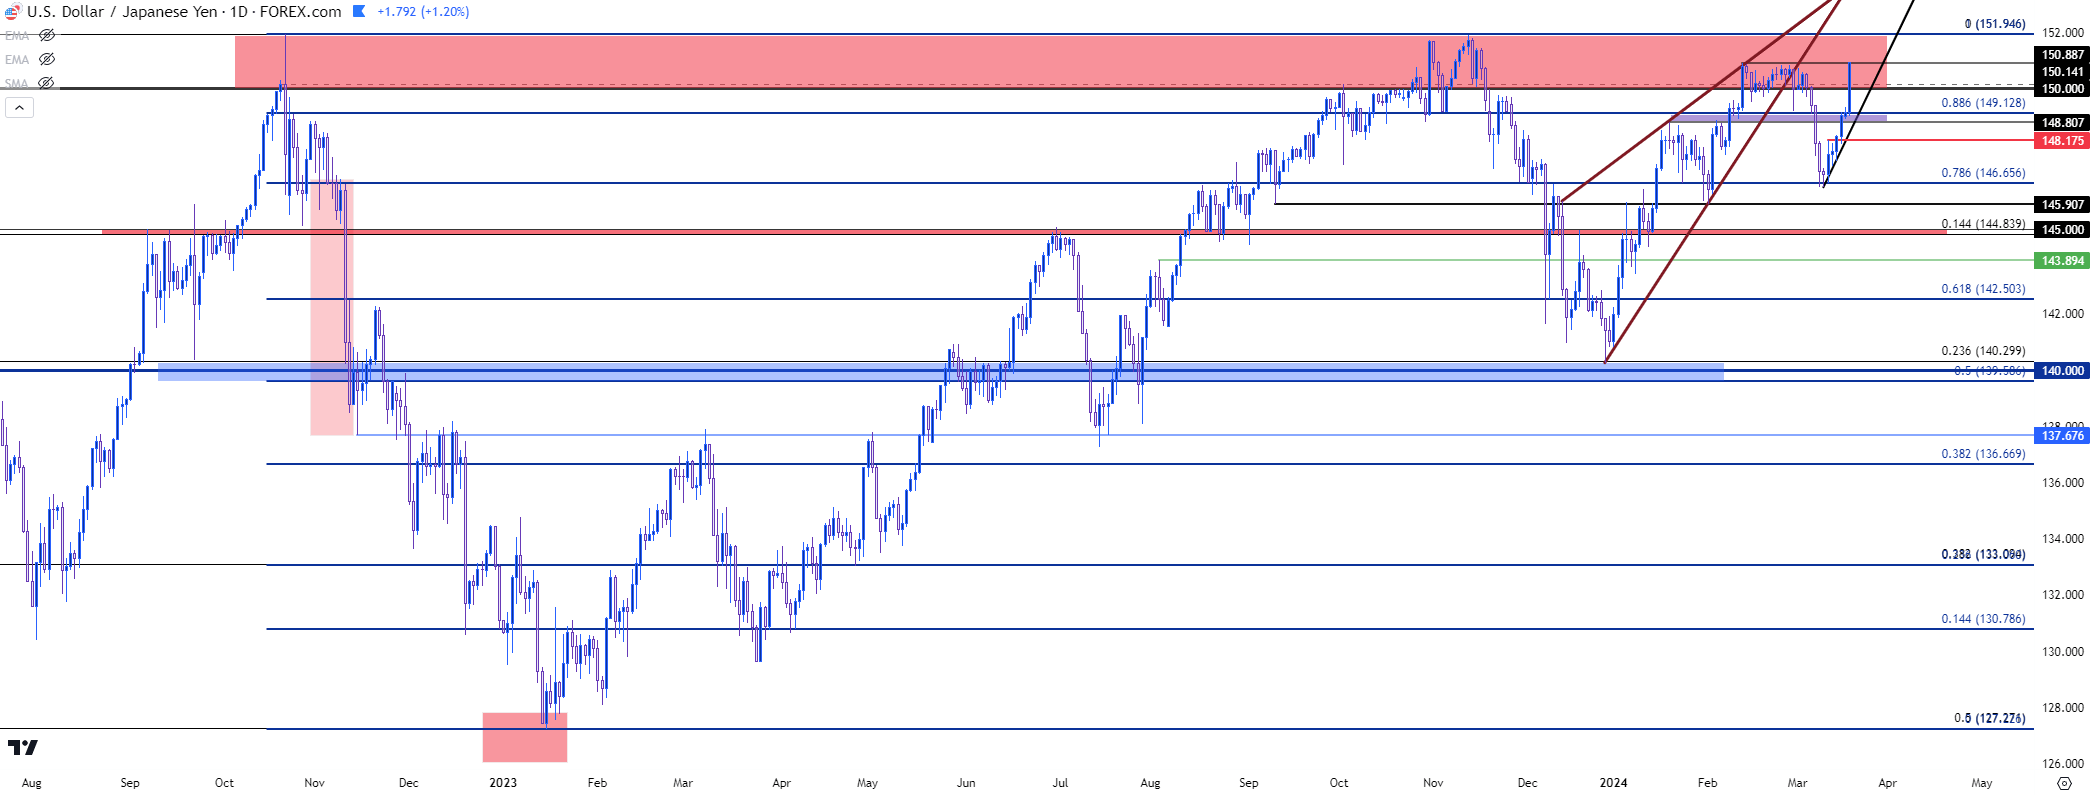 Chart prepared by James Stanley, USD/JPY on Tradingview
XAU/USD (Gold)
As I said in the webinar, I think gold wants a pull back here; but whether or not that happens will likely be determined by how tomorrow’s rate decision goes.
At this point gold is holding on to a bearish formation near those recently-established all-time-highs. This is a descending triangle formation, as there’s been a series of lower-highs printing since the NFP report from the Friday before last. Going along with that is support as taken from a prior point of resistance, at the early-December spike high of 2146.
Given the pace of the breakout, it makes sense to see some profit taking on the move. But a big driver here has been Fed-dovishness, and if the FOMC sticks to three cuts forecast for 2024 in their SEP tomorrow, that could continue to feed gold bulls. Notably – the one instance we had of a test below $2k in gold in 2024 was after the February CPI release, just before the Austan Goolsbee comment. And that dovish remark helped to launch gold higher which has led to the current breakout. If the Fed does, however, reduce that projection to two cuts for 2024, that could provide more motive for pullback and there’s a couple of spots to look for a test of a longer-term higher-low. The prior point of resistance in the multi-year range is around $2,075-$2,082 and there hasn’t yet been much for support tests there. And between current price and that zone is a quick swing-high-turned-low around $2,120-$2,124.
XAU/USD (Gold) Daily Price Chart
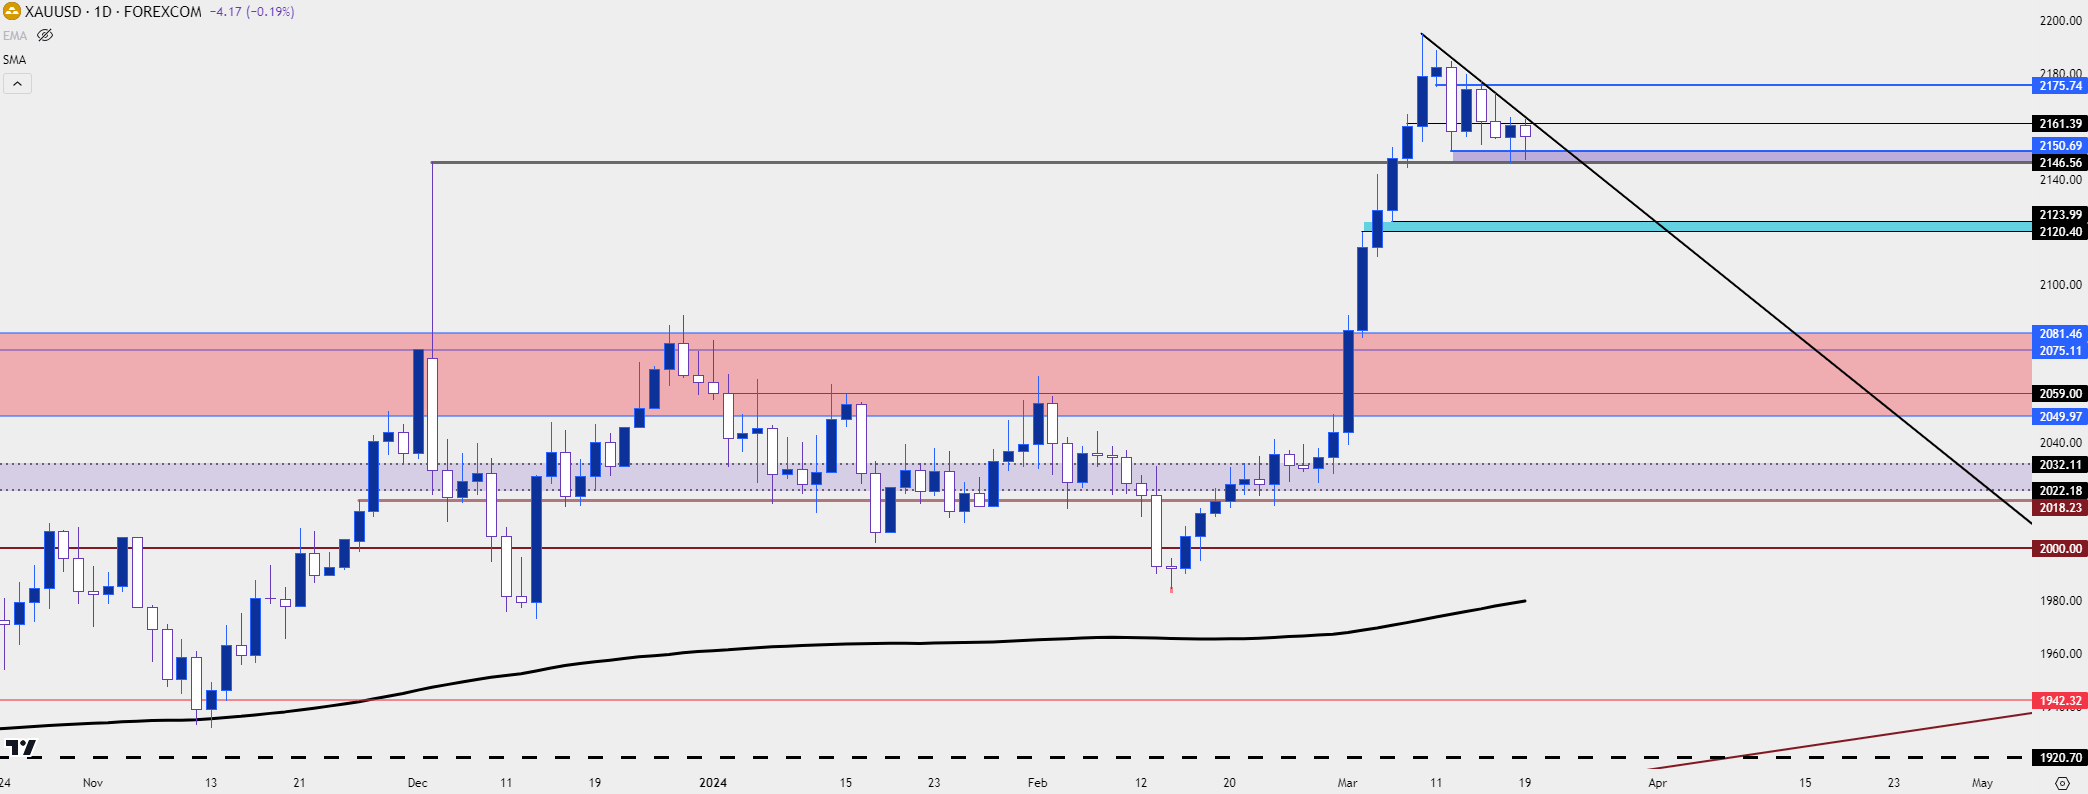 Chart prepared by James Stanley, Gold on Tradingview
S&P 500
This is the big one, in my opinion. The wealth effect has become an important idea for the FOMC, as it implies that strength in asset prices induce stronger consumer behavior. Like, if you see your 401k as healthy and growing, then the common thought is that the economy must also be healthy. There’s less reason to say ‘no’ to that discretionary purchase that otherwise might feel a bit more expensive or cumbersome.
This is important for the Fed, and the Treasury Department that’s very interested in remaining in power through the next election later this year. I had forecasted strength for stocks in Q1 in our 2024 Forecasts, which you can obtain from the link below:
If we go back to last year, when the Fed kept the door open for another possible hike on the basis that inflation hadn’t yet moved down to target, this became a headwind for equities. It was in this very webinar in September of last year that I brought out the John Templeton quote: “The time of maximum pessimism is the best time to buy, and the time of maximum optimism is the best time to sell.”
I was saying that as stocks were probing a low and at the time I was talking about the still possible ‘Santa Rally’ for 2023. The Fed started to sound much more dovish in Q4 and that helped to propel stocks; which have remained propelled for almost five months now in an aggressively-bullish trend, as shown on the chart of the S&P 500 below.
S&P 500 Weekly Price Chart
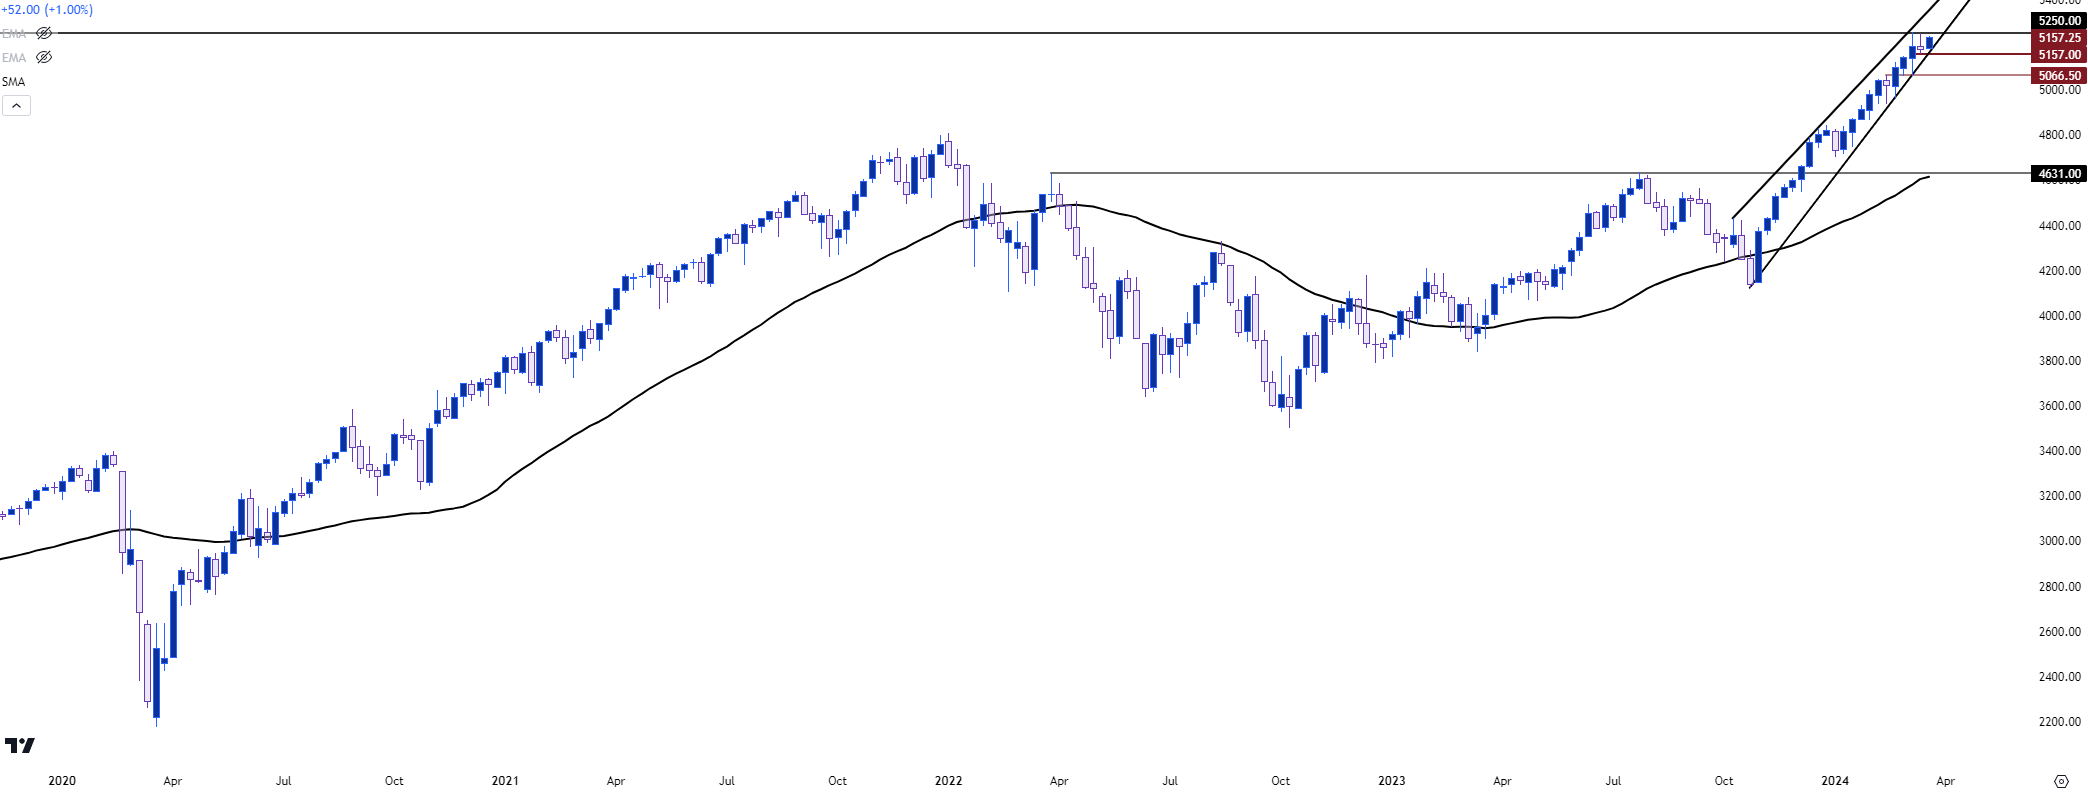 Chart prepared by James Stanley; data derived from Tradingview
From the daily, this sets up a rising wedge formation. And if we go back to that John Templeton quote, it would seem to me that we’re closer to the ‘maximum optimism’ part of the curve as opposed to pessimism, as we had seen late last year before the rally began.
From the daily chart below we can get a better view of that rising wedge. There’s been a hold of resistance around 5,250 in S&P 500 futures and that’s led to a short-term range. I’m tracking the support at 5,157 as a possible area of note, and if bears can close the S&P below that after tomorrow’s rate decision, that will lead to greater scope for a bearish scenario.
S&P 500 Daily Price Chart
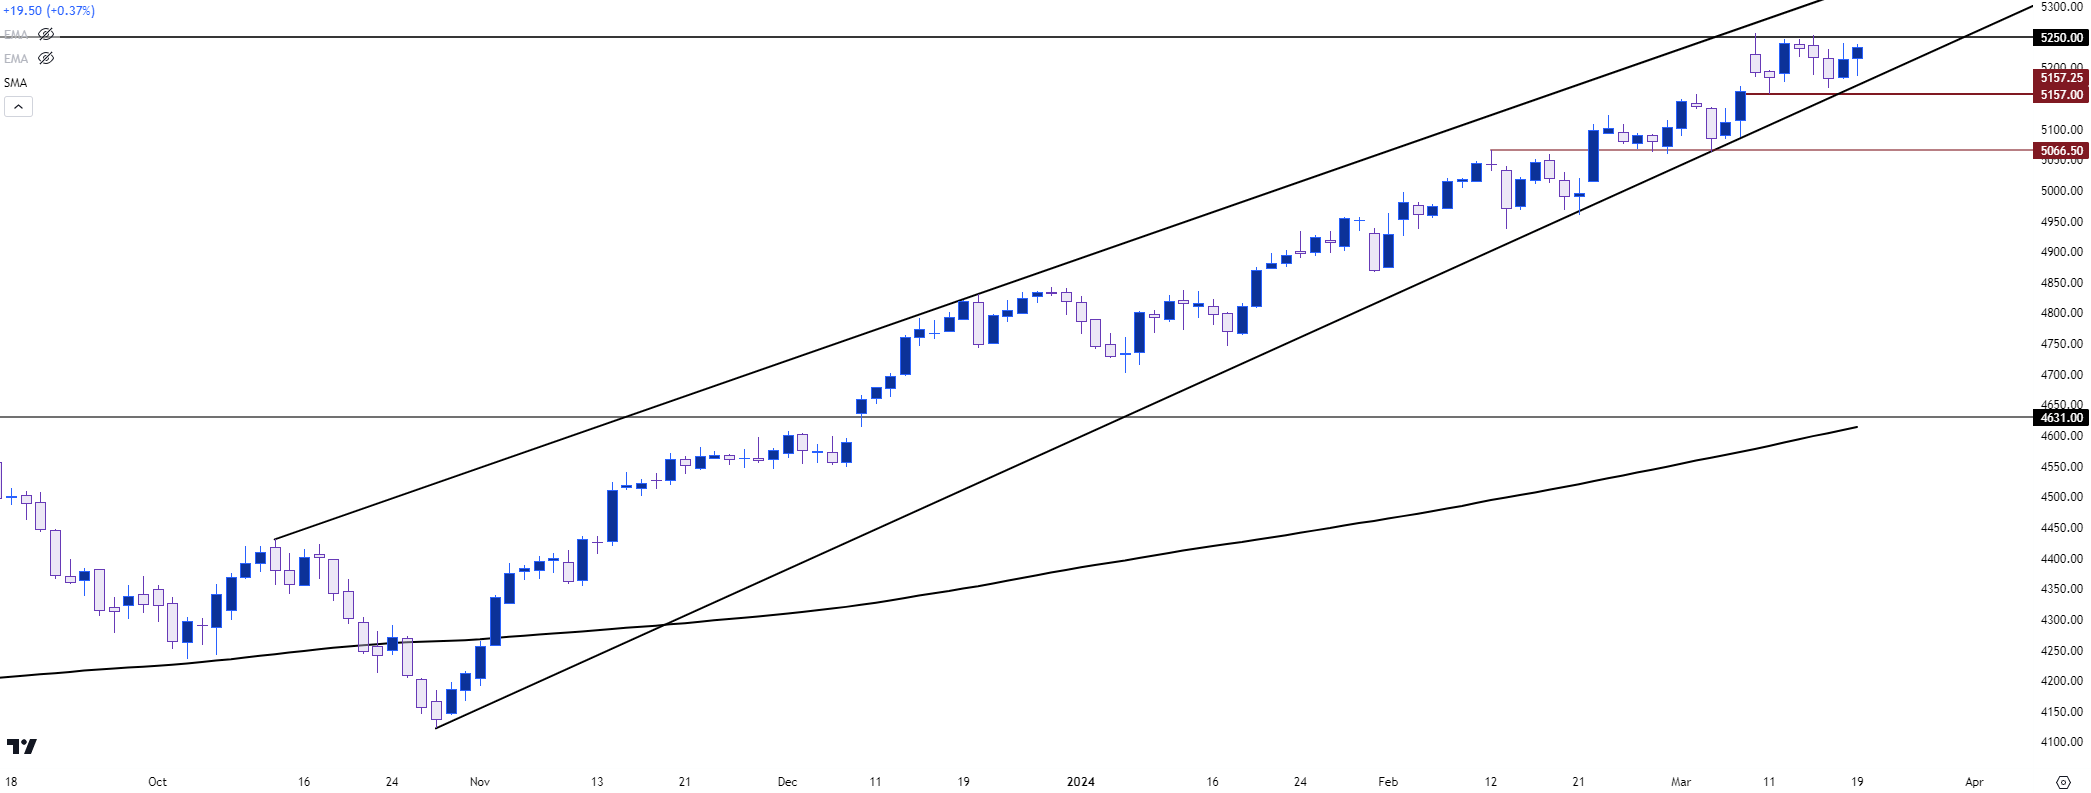 Chart prepared by James Stanley; data derived from Tradingview
--- written by James Stanley, Senior Strategist


