
U.S. Dollar Talking Points:
- Tomorrow morning brings the next release of CPI data out of the U.S., and this is followed by the European Central Bank rate decision the following morning.
- The Fed has been very dovish since the November 1st rate decision, talking up the prospect of rate cuts to begin at some point this year. So far, however, U.S. data has remained strong, especially from the perspective of Core CPI and the Unemployment rate, both of which complicate the backdrop for the FOMC to start cutting rates.
- At the March rate decision, the Fed stuck with three cuts expected for 2024 and tomorrow’s CPI print plays an important role with that. After tomorrow’s CPI release, there is just one more until the June FOMC rate decision, the announcement of which takes place on the same day as the next CPI release. If the Fed does not cut there, then there are only four more rate decision in 2024 which would be a hurried pace for three cuts.
- This is an archived webinar and you’re welcome to join the next one. It’s free for all to register: Click here to register.
We’re nearing the point where the rubber meets the road for rate cut expectations in the United States.
At the March rate decision, the Fed reiterated their expectation for three 25 bp cuts this year. As of right now, markets are expecting those cuts to begin in June to the tune of a 57.6% probability for at least one cut at that meeting. That June date is important, especially if we’re talking three cuts, because after that meeting there are only four more rate decisions in 2024 and three cuts in four meetings would be a hurried pace, historically speaking, especially with a stable economic backdrop such as we’ve seen so far this year in the U.S. (per the data).
FOMC Rate Probabilities for June
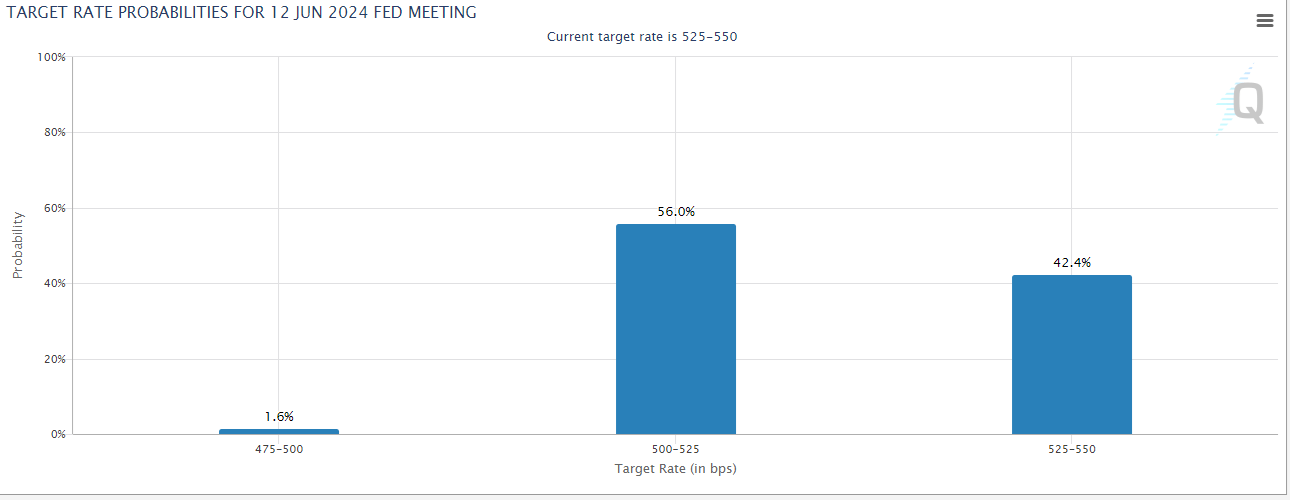 Chart prepared by James Stanley; data from CME Fedwatch
CPI
The Fed’s dual mandate has seen strength in the labor market remain through 2024 so far, evidenced again last Friday at the Non-farm Payrolls report showing at 3.8%. This extends the streak of the longest period of sub-4% unemployment since the Vietnam war. So, a historically strong labor market from that perspective. And on the inflation front the picture is opaquer, as I’ve discussed before with Core PCE going in the direction that the Fed wants while Core CPI has been ‘stuck’ around the 4% level for six months now.
The past three months have seen above-expectation prints for Core CPI; and the past six months have seen that data point print within a 0.2% band of the 4% level. This would speak to ‘inflation entrenchment,’ a concept discussed by Powell last year as a risk of slowing down rate hikes. From the perspective of Core CPI that would seem to be what we’re dealing with but, so far, the Fed has seemed fast to shrug this off.
In February when Core CPI came out at 3.9% v/s the expected 3.7%, the U.S. dollar pushed a quick run of strength to re-test the 105.00 level. Stocks also started to turn-lower but it was just a day later that Chicago Fed President Austan Goolsbee remarked that market participants should not get ‘flipped out’ about the print.
This, again, highlights a dovish Fed that seems to be unnerved by the prospect of inflation entrenchment. After that remark the USD pulled back and continued to do so – all the way until the March 8th release of Non-farm Payrolls data, at which point bulls showed back up.
For tomorrow, the expectation is for Core CPI to print at 3.7%, as it has been for the past two months. If it comes out above the expectation again, we could see shuffling in expectations for cuts in June, which could further impact expectations for the remainder of 2024.
After tomorrow’s CPI release, there is one more until June 12th, which brings both the June FOMC rate decision and a CPI report. So, there’s a lot of importance for those expectations in tomorrow’s CPI release.
Core CPI Since January, 2021
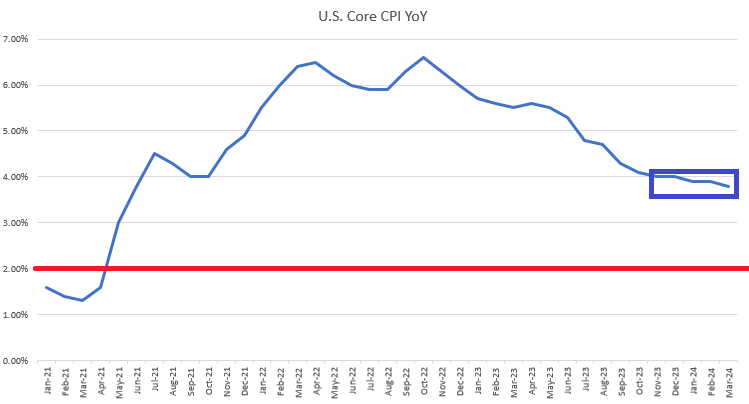
Chart prepared by James Stanley
USD, DXY 105
When Austan Goolsbee dropped that comment in mid-February the U.S. dollar had just begun to re-test the 105.00 level. This is a big spot, as it’s a psychological level on top of being the 38.2% retracement of the 2021-2022 major move. That price had also set support back in early-November after the FOMC meeting at which the bank came off as very dovish, at least to my ears.
That zone came back into play again last week just after the Q2 open and another pullback developed from that. But, so far, bulls have put up a stand at a higher-low in the 103.98-104.21 zone.
A strong CPI read tomorrow could bring about a third test, and this time bulls may have more to work with given the hold of a higher-low to go along with the fundamental backdrop addressed above. If that support cannot hold, however, the 200-day moving average plots just below that which is followed by 103.46 and then the 103-103.19 zone.
U.S. dollar Daily Price Chart
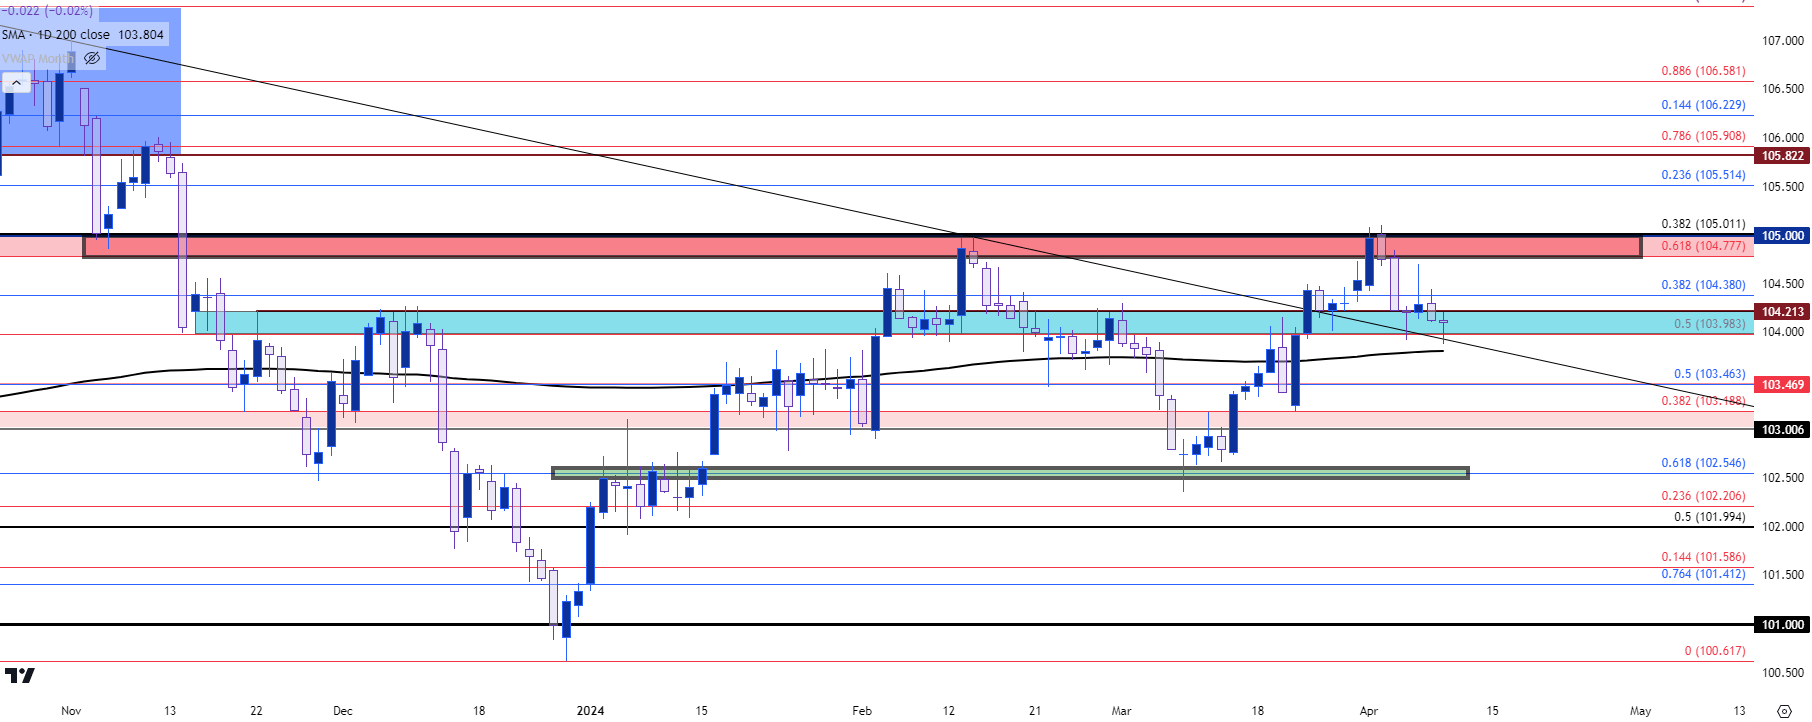 Chart prepared by James Stanley; data derived from Tradingview
EUR/USD
As of right now both the U.S. dollar (via DXY) and EUR/USD are trading above their 200-day moving averages. That’s unlikely to remain for any extended period of time, largely due to math and given the fact that the U.S. dollar is the counter-currency in that quote.
The Euro is a whopping 57.6% of the DXY quote so logically the ECB rate decision the day after CPI could have some bearing on the matter of DXY price action, along with EUR/USD.
Much of 2024 so far has been coiling in EUR/USD. There was a decisive bearish trend to start the year but it was February 13th, right around that ‘flipped out’ comment from Austan Goolsbee, that things began to turn-around. The pair couldn’t get back to 1.1000, however, with the 1.0943-1.0960 resistance zone coming into play, holding the highs over a two week period until sellers pushed a run into the end of Q1 trade.
At this point price is holding resistance in the 1.0862-1.0877 zone. There’s some short-term bullish structure, with levels at 1.0832 and 1.0796 in the equation. If bears can push through that, the door opens for re-test of 1.0750-1.0766 and then the 1.0725 and 1.0694 levels.
EUR/USD Daily Price Chart
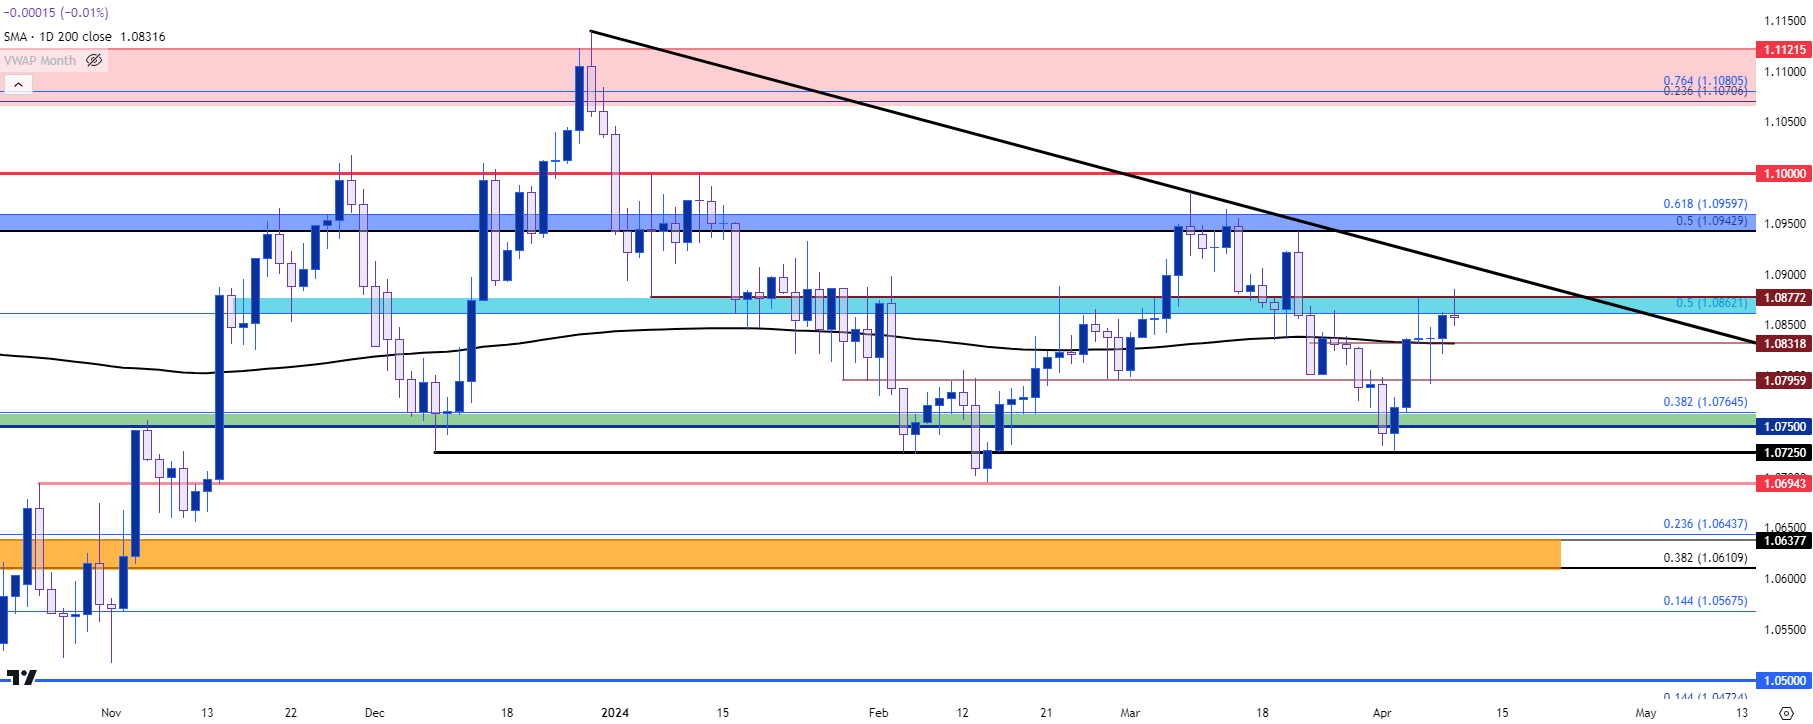 Chart prepared by James Stanley, EUR/USD on Tradingview
USD/JPY
Near-term price action in USD/JPY leaves something to be desired as the pair appears to be almost pinned to the 151.95 level that’s marked the highs over the past couple of years. The first rate hike since 2007 from the BoJ didn’t seem to change much and as a general drive of USD-strength has held for much of this year the pair has continued to price in the direction of the positive carry on the long side.
The fear factor comes in USD/JPY, in my opinion, when there’s greater evidence that the Fed is closer to actually cutting rates. It was USD-weakness that helped to provoke reversals in Q4 each of the past two years. But, as U.S. data has remained strong for much of this year, there’s been little fear of a stampede out of the carry trade.
So, if we do see softness in tomorrow’s CPI print, perhaps that could give USD/JPY bears something to work with. If we don’t however, there could be the bullish breakout scenario to entertain and there’s likely a plethora of stops sitting above 152.00 which, if triggered, can drive a fresh rush of demand into the market. This could cast attention towards the 155.00 level for Japanese Finance Ministry defense.
USD/JPY Weekly Price Chart
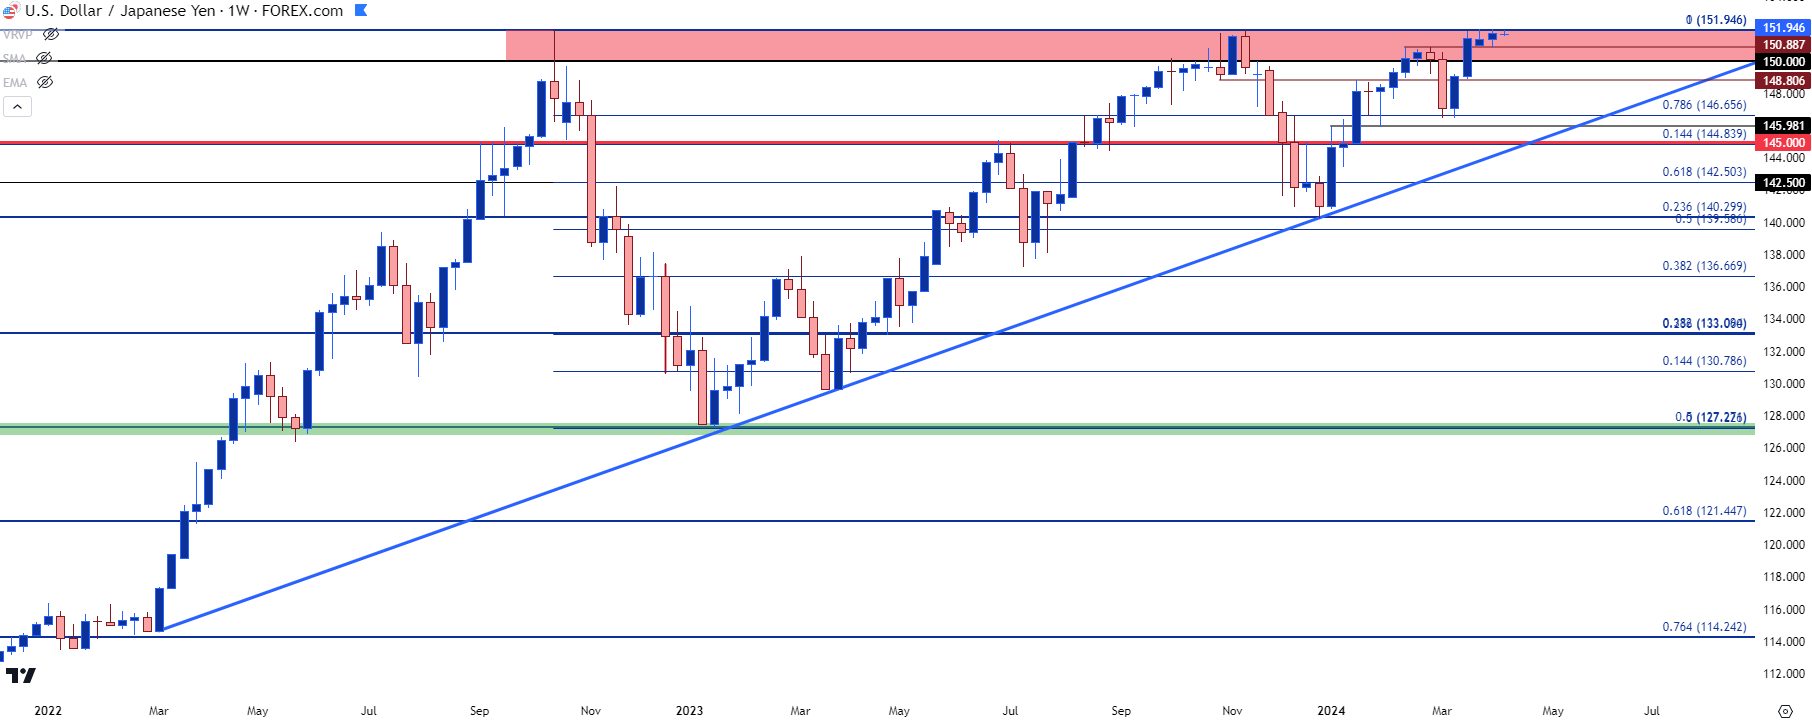 Chart prepared by James Stanley, USD/JPY on Tradingview
XAU/USD (Gold)
Gold has been in mania mode of late with an other illustration after this week’s Sunday open. Gold quickly pulled back, found support at prior resistance of 2300-2304, and then jumped-up again to the next psychological level at $2350.
I’ve long said that I thought Gold’s ability to trend over 2k would be on hold until the Fed formally flips. That’s been incorrect so far as the Fed hasn’t flipped, but I think what we’re seeing is the market expectation for that to be happening as the FOMC has continued to push the three cut narrative even despite strong U.S. data.
This, of course, could change quickly, particularly if we see a strong CPI print that pushes down rate cut expectations around the FOMC. But, until the Fed backs down from the three rate cut idea, Gold bulls could have some motivation to keep pushing and at this point price action remains very bullish.
There’s a remaining spot of short-term support potential at 2333 but, outside of that, it’s messy all the way down to the 2300-2304 zone in XAU/USD.
XAU/USD (Gold) Four-Hour Price Chart
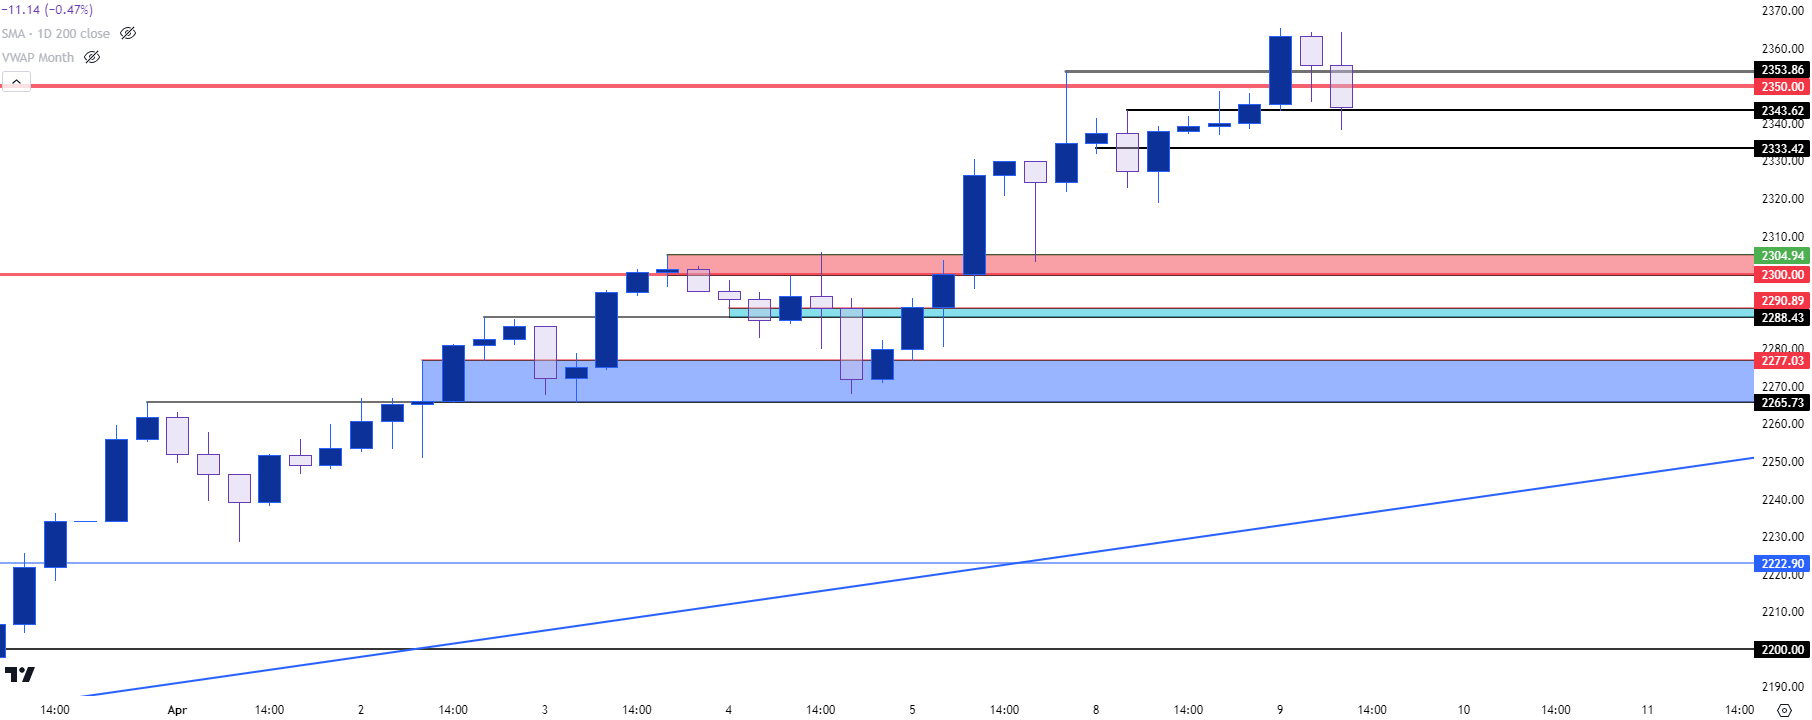 Chart prepared by James Stanley, Gold on Tradingview
USD/CHF
USD/CHF has bullish structure and given that the Swiss National Bank has already started to cut rates, this pair could be one of the more interesting venues for USD-strength scenarios.
Since breaking-out above the .9000 handle in late-March, the pair has continued to hold support above the big figure. Sellers have remained active around the .9071 swing level and, so far, it’s been a higher-low support hold with the psychological level. There is more context for support a bit lower, however, around the .8970 prior swing, but it’s the .8866-.8888 zone that remains key as this held resistance multiple times as the bull flag formation developed.
USD/CHF Daily Price Chart
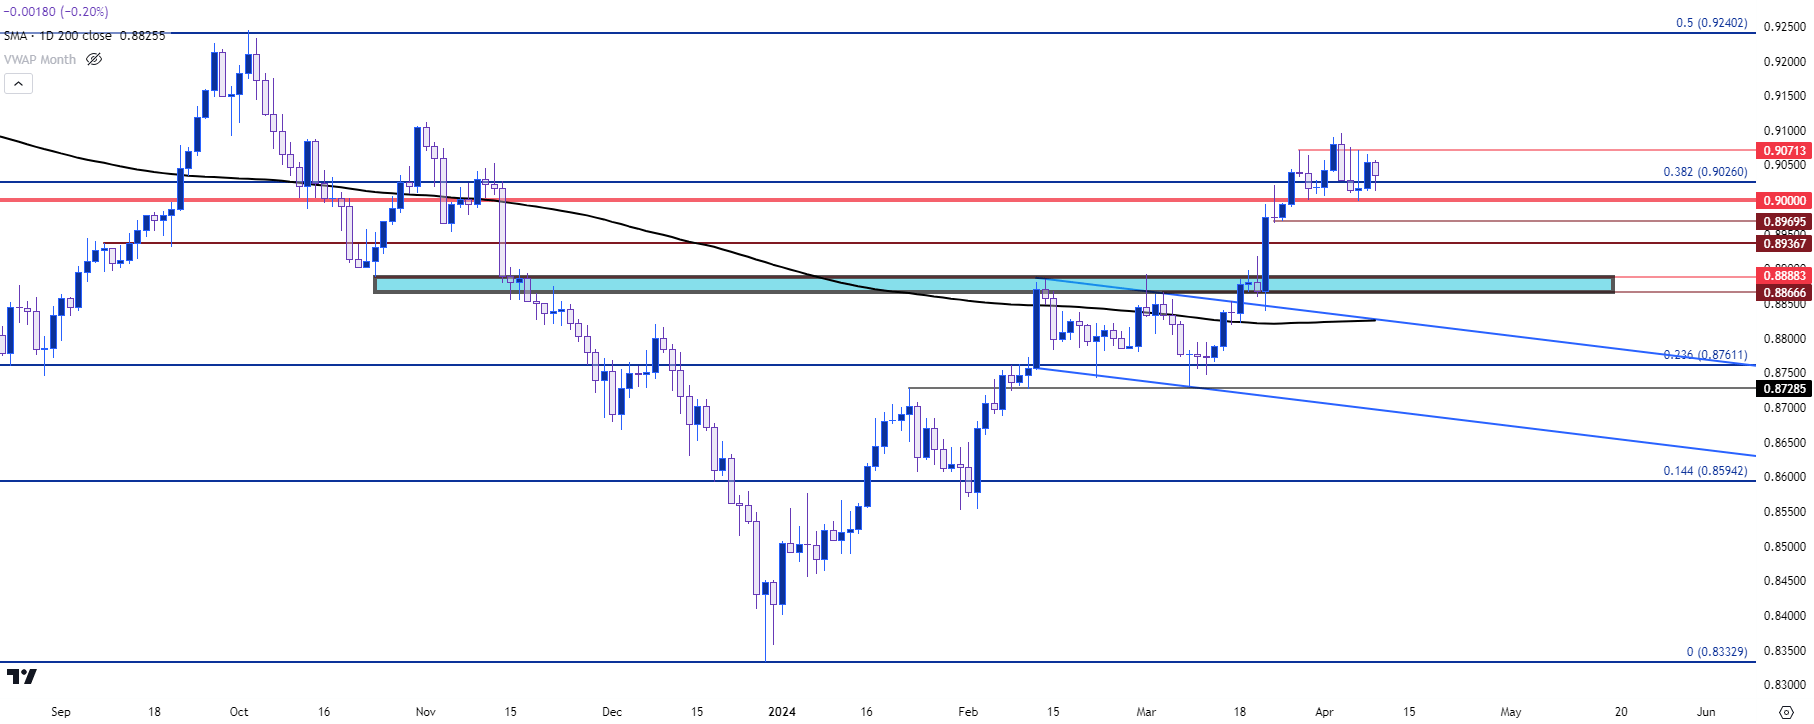 Chart prepared by James Stanley, USD/CHF on Tradingview
--- written by James Stanley, Senior Strategist


