US Dollar Talking Points:
- The November FOMC meeting has just concluded and as widely expected there were no changes announced today.
- The Fed’s statement was almost identical to the September rate decision, so the focus shifted quickly to the presser. The initial response in the US Dollar after the press conference began was strength, with DXY making a fast move at resistance at 107.20. That was faded throughout Powell’s Q&A and USD has erased the entirety of the earlier-session gain.
- The week is not over yet: Tomorrow brings the Bank of England rate decision and Friday brings Non-farm Payrolls, so the USD can certainly remain on the move.
- I’ll be discussing these themes in-depth in the weekly webinar on Tuesday at 1PM ET. It’s free for all to register: Click here to register.
This was a fairly clear-cut rate decision, in my opinion. There were no actual moves and there were none expected coming into this meeting. Even the bank’s statement issued at 2PM ET was practically unchanged since last month, with only minor tweaks. And Powell was clear throughout the press conference, repeating himself that the bank was attentive to the increase in longer-term yields. Powell was also to-the-point regarding future rate cuts, saying that it wasn’t something that was even being talked about at the bank. He also said multiple times that policy was restrictive which helps to buffer the talking down of rate cuts.
In the US Dollar, the initial response to Powell’s opening remarks was strength, as DXY pushed up to a fresh four-week high. DXY stalled just before re-testing the Fibonacci level at 107.18. Price then began to pullback and as of this writing DXY is testing the bottom of the zone at 106.67-106.79, which had previously helped to set resistance.
US Dollar - DXY Two Hour Price Chart (indicative only)
 Chart prepared by James Stanley; data derived from Tradingview
From the daily chart of the US Dollar we can see that reaction quite clearly and the daily bar is currently showing as a gravestone doji. Dojis are indecisive, but a gravestone doji can impart a slightly bearish tint to the matter as that bar is, essentially, showing an intra-day rally that was quickly faded.
This brings back into the picture the same support levels that have been at work over the past week. These plot at 106.52, 106.33, 106.14 and then at 105.88. Bigger picture, there’s a key zone at 105.39-105.55.
US Dollar - DXY Daily Price Chart (indicative only)
 Chart prepared by James Stanley; data derived from Tradingview
EUR/USD
EUR/USD was showing breakdown earlier in the session after a strong response from sellers yesterday. That swing began after a resistance test at 1.0673 and this pushed price all the way to the bottom of the bullish channel making up the bear flag.
The entirety of today’s price action has been below that formation, but notably, sellers have been unable to provoke another test of the 1.0500 psychological level.
This adds a bit of opacity for bearish continuation scenarios as the 1.0500 level hasn’t yet shown a willingness to give way. This keeps the 1.0611-1.0636 zone as nearby resistance, with 1.0673 above that.
EUR/USD Daily Price Chart
 Chart prepared by James Stanley, EUR/USD on Tradingview
GBP/USD
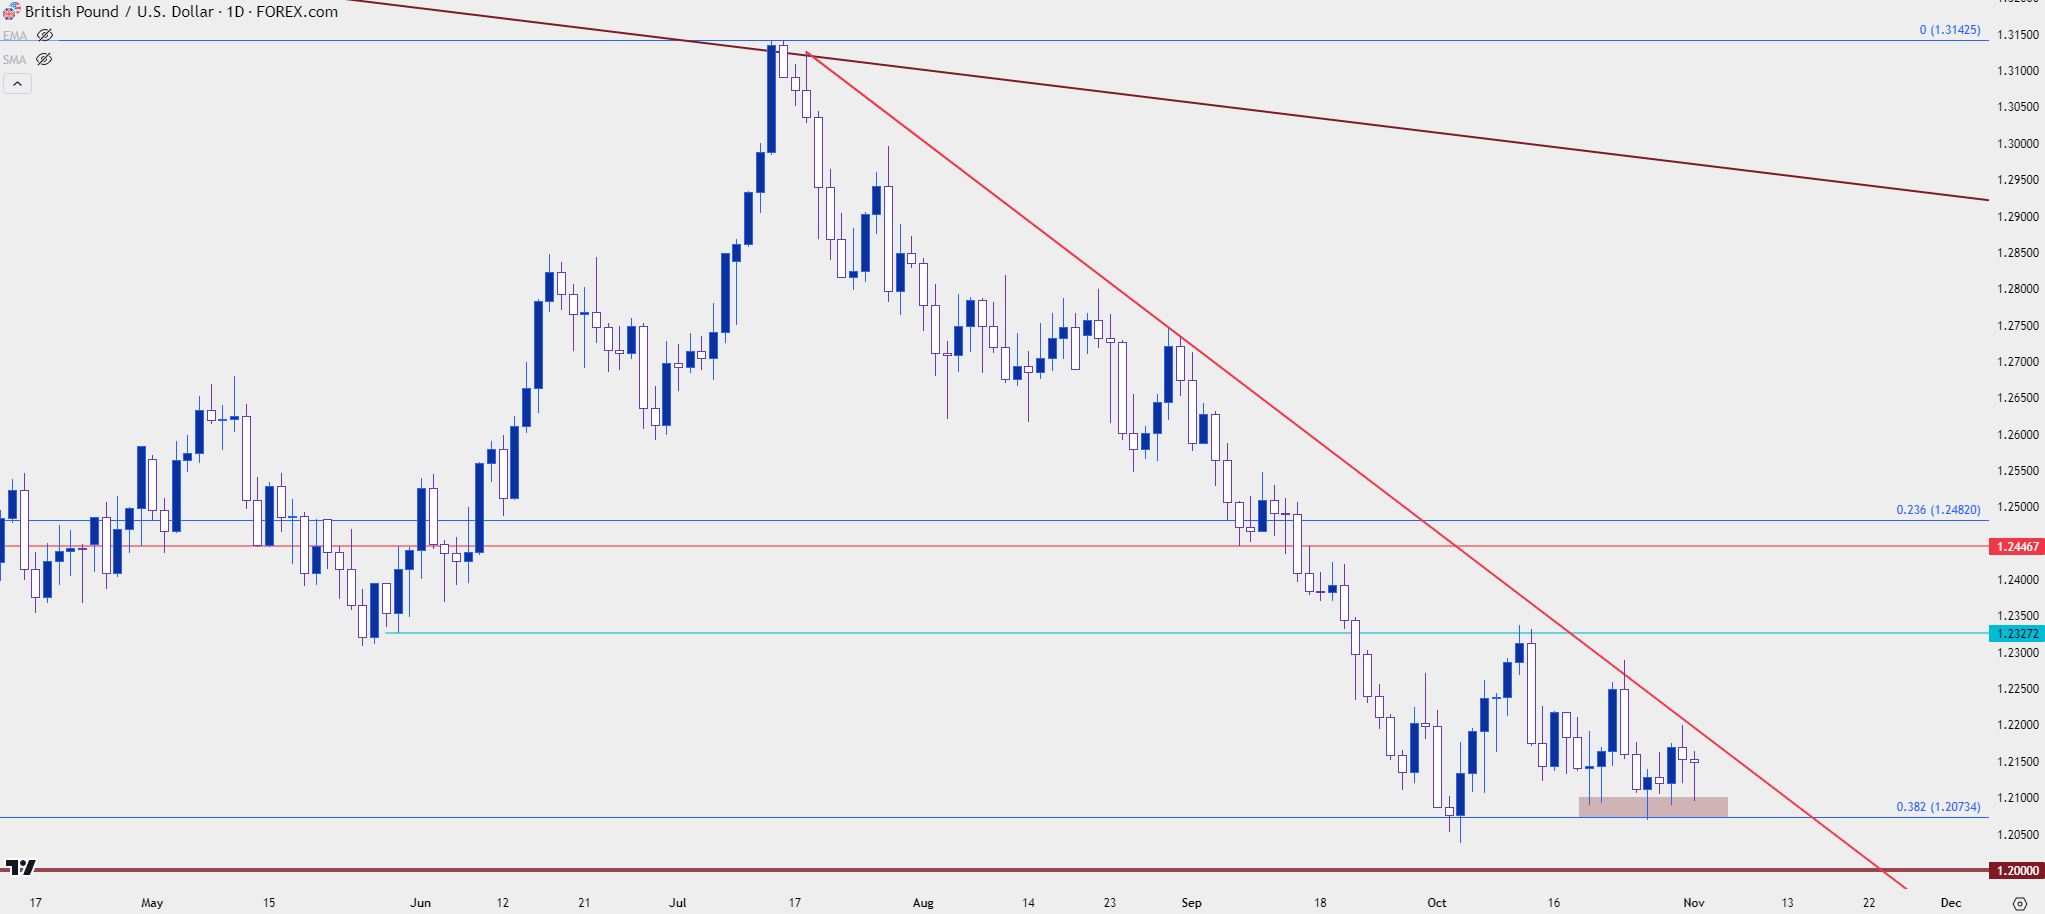
Tomorrow brings a Super Thursday rate decision at the Bank of England, which means updated projections to go along with the rate decision. GBP/USD retains a similar look as earlier this week, in which price had held higher-low support after a test at a Fibonacci level last Thursday. That level plots at 1.2073 and is a higher low from the earlier October swing-low.
GBP/USD Daily Price Chart
 Chart prepared by James Stanley, GBP/USD on Tradingview
USD/CAD
USD/CAD put in a breakout last week and so far that move has stalled, and the stall is taking place at a very clear area on the chart of 1.3850-1.3900. I had talked about this on Monday and as we near the Wednesday close the weekly bar is currently showing as indecisive. If bulls can muster a topside breakout, there’s the 1.4000 level to contend with and this can become an item of consideration for those looking to chase the breakout.
USD/CAD Weekly Price Chart
 Chart prepared by James Stanley, USD/CAD on Tradingview
Going down to the daily highlights a trend that’s been pricing-in at a brisk pace, and this can further urge caution for those chasing. It can, however, highlight support potential at prior swings, such as the 1.3870 level that was setting the highs in early-October or the 1.3736 level that had set resistance ahead of last week’s breakout.
USD/CAD Daily Price Chart
 Chart prepared by James Stanley, USD/CAD on Tradingview
--- written by James Stanley, Senior Strategist


