Crude Oil Technical Forecast: WTI Weekly Trade Levels
- Oil prices retreat off more 6.9% off fresh yearly highs- marks second weekly decline
- Crude threatens deeper correction within December uptrend- bulls searching support
- WTI Resistance 84.57, 85.33, 90.10/79 (key)- Support 79.75-80.19, 77.65 (key), 75.30
Oil prices plunged 2.5% this week to mark a second consecutive weekly decline, with crude now off more than 5.1% from the yearly high. The risk remains for a deeper correction within the December uptrend and while the broader outlook remains constructive, the immediate focus is on a possible test of uptrend support. These are the updated targets and invalidation levels that matter on the WTI daily technical chart heading into next week’s flurry of central bank rate decisions.
Review my latest Weekly Strategy Webinar for an in-depth breakdown of this crude oil setup and more. Join live on Monday’s at 8:30am EST.
Oil Price Chart – WTI Daily

Chart Prepared by Michael Boutros, Technical Strategist; WTI on TradingView
Technical Outlook: In last month’s Oil Price Forecast we noted that the, “breakout to multi-month highs keeps the uptrend viable heading into next week. From at trading standpoint, look to reduce portions of long-exposure / raise protective stops on a rally towards 83 - losses should be limited to 78.27 IF price is heading higher on this stretch.” WTI registered an intraday low at 80.29 in the following days before surging higher with the rally marking a high at 87.60 before pulling back. A nine-day consolidation pattern broke lower this week and while the further losses may be likely near-term, the broader outlook remains constructive while above the December uptrend.
Key support rests at 79.75-80.31- a region defined by mid-November / February swing highs, the 38.2% retracement of the December advance, the 200-day moving average, the 100% extension of the April decline, and the objective 2023 yearly open. A break below this level would threaten a test of the December uptrend which converges on the 50% retracement near 77.65- we’ll reserve this threshold as our broader bullish invalidation level.
Initial resistance remains with the 61.8% Fibonacci retracement of the September decline at 84.57 backed closely by the objective high-day close at 85.33- a breach / close above this threshold is needed to mark resumption of the broader uptrend with key resistance unchanged at the 1.618% extension / 2023 high-week close (HWC) at 90.10/79. Look for a larger reaction there IF reached.
Bottom line: The oil price rally has exhausted into uptrend resistance and the risk remains for a deeper correction within yearly advance. That said, we’re on the lookout for a possible exhaustion low in the days ahead. From a trading standpoint, losses should be the 79.75 IF price is heading higher on this stretch with a close above 85.33 needed to mark uptrend resumption. Keep in mind we get the release of key US inflation data next week – watch the weekly closes here for guidance.
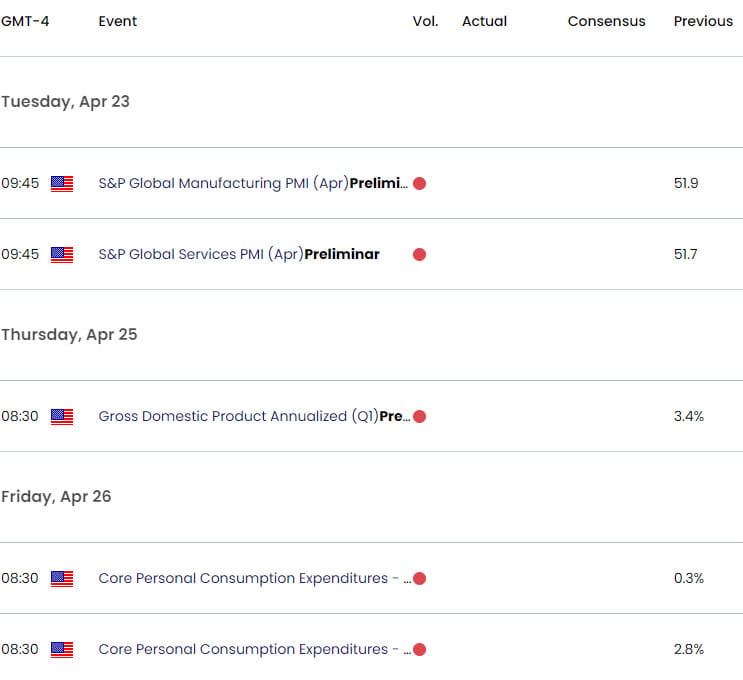
Key Economic Data Releases

Active Weekly Technical Charts
- US Dollar Index (DXY)
- British Pound (GBP/USD)
- Euro (EUR/USD)
- Gold (XAU/USD)
- Australian Dollar (AUD/USD)
- Canadian Dollar (USD/CAD)
--- Written by Michael Boutros, Sr Technical Strategist with FOREX.com
Follow Michael on X @MBForex


