
Oil, USD/CAD Talking Points:
- Oil prices are pushing a strong breakout today after spending the past two weeks resistance at the $80 handle. I had written the weekly forecast on Oil a few weeks ago, and that ascending triangle formation has since led into breakout with bulls pushing continued higher-highs.
- Given Canada’s large Oil reserves there’s often thought to be a correlation between the Canadian currency and Oil prices. And to be sure, sometimes that exists. But, others, such as now, it doesn’t appear to exist at all as that Oil strength is showing along with weakness in the Canadian Dollar. I extrapolate on this further below.
- I’ll be discussing these themes in-depth in the weekly webinar. It’s free for all to register: Click here to register.
WTI crude oil prices have set a fresh four-month high this morning, breaking above a major level that’s given bulls heartburn over the past couple of weeks.
I had looked into this backdrop ahead of the March open and, at the time, oil had built an ascending triangle formation with resistance at the very contentious $80 handle. The first day of March showed a test above that level, but bulls weren’t able to hold the bid and from that a bearish channel developed, setting up a bull flag formation inside of the broader ascending triangle.
In that forecast from late-February, I had even warned of the possibility of false breaks on initial tests above $80, writing “If buyers can force a break of the 80-handle next week, that could end up being a difficult move to chase as it would be the first test above the big figure in more than three months. Instead, looking for a pullback to support at that level, with a show of response from bulls, could open the door for bigger-picture bullish trend potential.”
And, so far, that’s what’s happened: multiple tests in early March failed to substantiate drive beyond the $80-handle. But – bullish structure remained as defined by the bull flag, and now we have the breakout and fresh four-month highs. The big question now – is whether bulls can hold the move.
WTI Crude Oil – Daily Price Chart
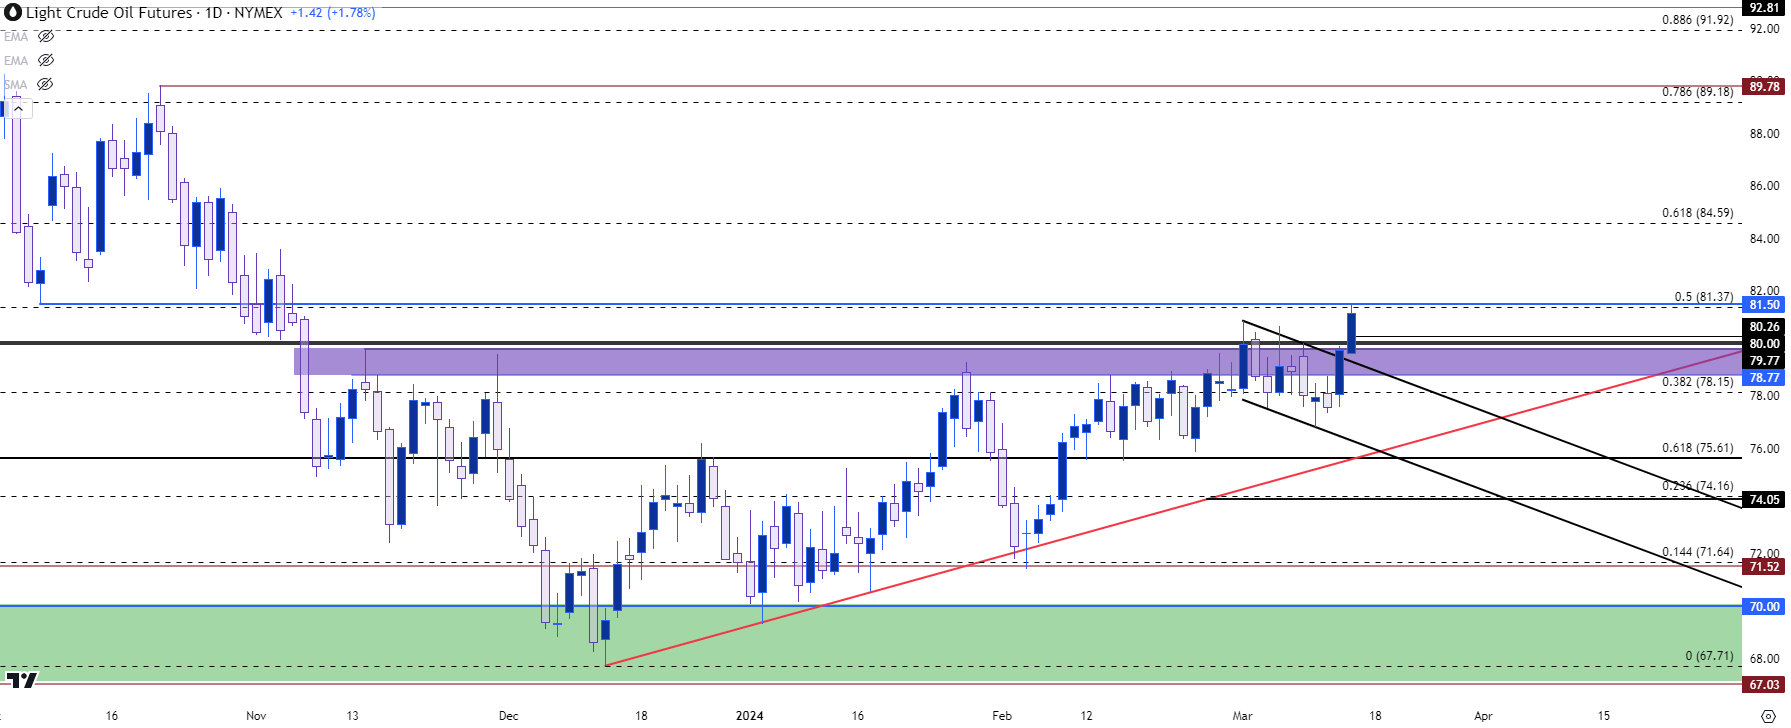 Chart prepared by James Stanley; data derived from Tradingview
Oil Caught the Break – Now What?
Going back to what I had said in late-February, the key here would be bulls defending support at a higher-low. If this can happen around or above the $80 handle, that could be construed as even more bullish as it would show buyers accepting and bidding prices beyond the same level that sellers were defending through the past couple of weeks.
On a shorter-term basis, price has already begun the test of the next spot of resistance, which I’m tracking from 81.37-81.50. The former price is the 50% mark of the most recent major move while the latter is a prior swing low. Together those prices create a zone and this has so far pushed a pause point in that breakout. There was an intra-day swing, but bulls have quickly returned to bid oil right back up to this key spot of short-term resistance.
WTI Crude Oil Hourly Price Chart
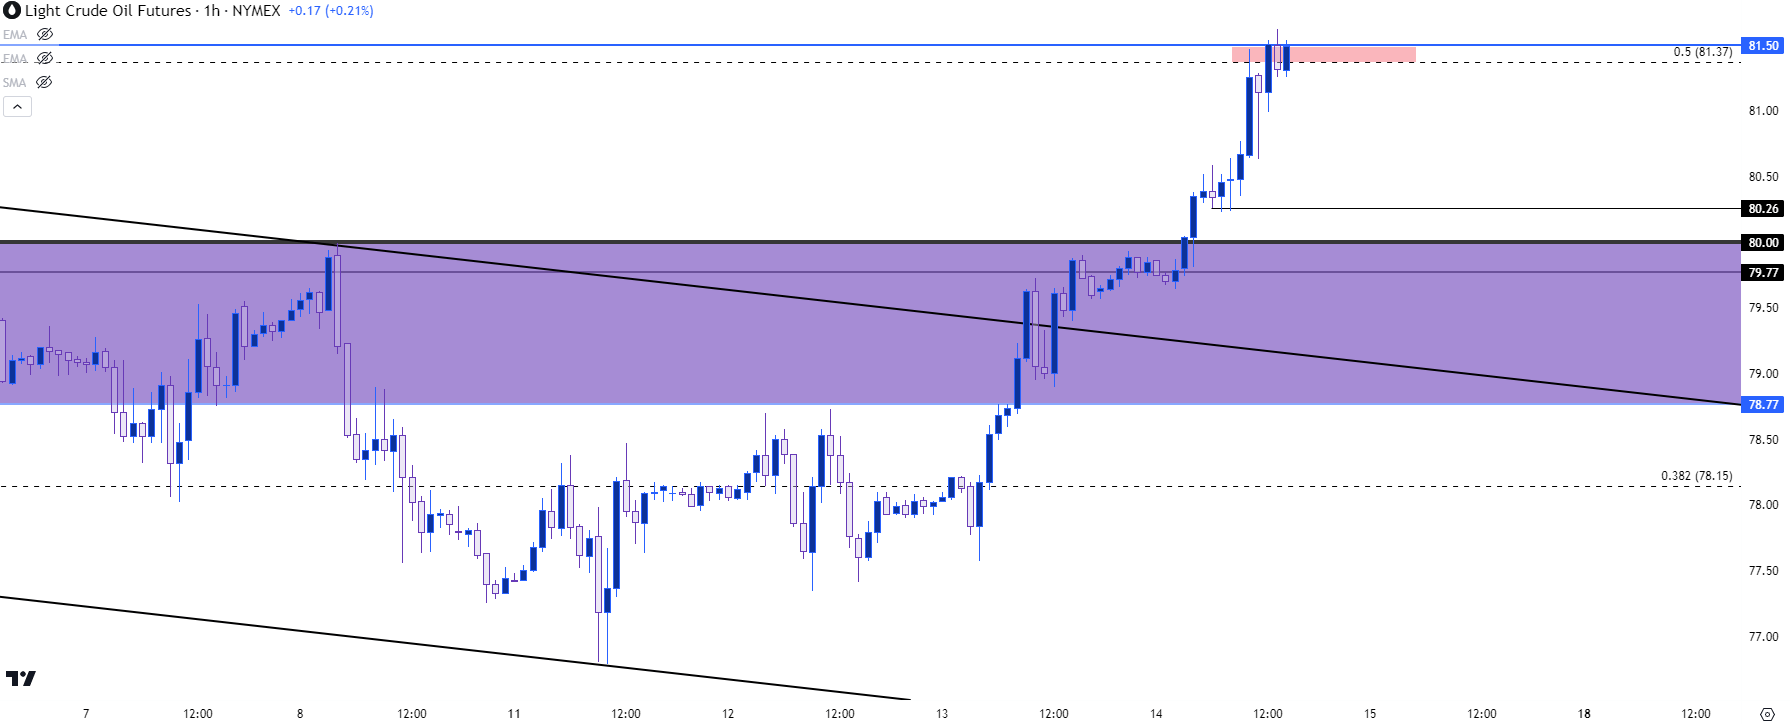 Chart prepared by James Stanley; data derived from Tradingview
Oil and USD/CAD
I wanted to include USD/CAD in this article as many traders will often assume some sort of correlation between the Canadian currency and oil prices. And given Canada’s large oil reserves, that can make sense, and at times there can be a direct correlation showing between the currency and the commodity. But, like many other cross-market correlations this doesn’t always hold, and in some cases that correlation can get completely flipped on its head.
Thus, if one wants to trade oil, they should work with the oil chart; or if one wants to trade CAD, focus on CAD charts. They’re different markets, and can remain as such, even if they do appear coordinated at times.
On the below chart of Oil I’ve included a correlation coefficient with USD/CAD on the bottom of the chart. As of right now, that data point is very near the zero-line which indicates no correlation between the charted assets. But, perhaps more importantly, you can see from the historical sampling that the correlation waxes and wanes from direct to inverted, making the oil-cad proxy as a difficult item to chase when setting up strategy.
WTI Crude Oil Daily Chart with Correlation Coefficient to USD/CAD (bottom)
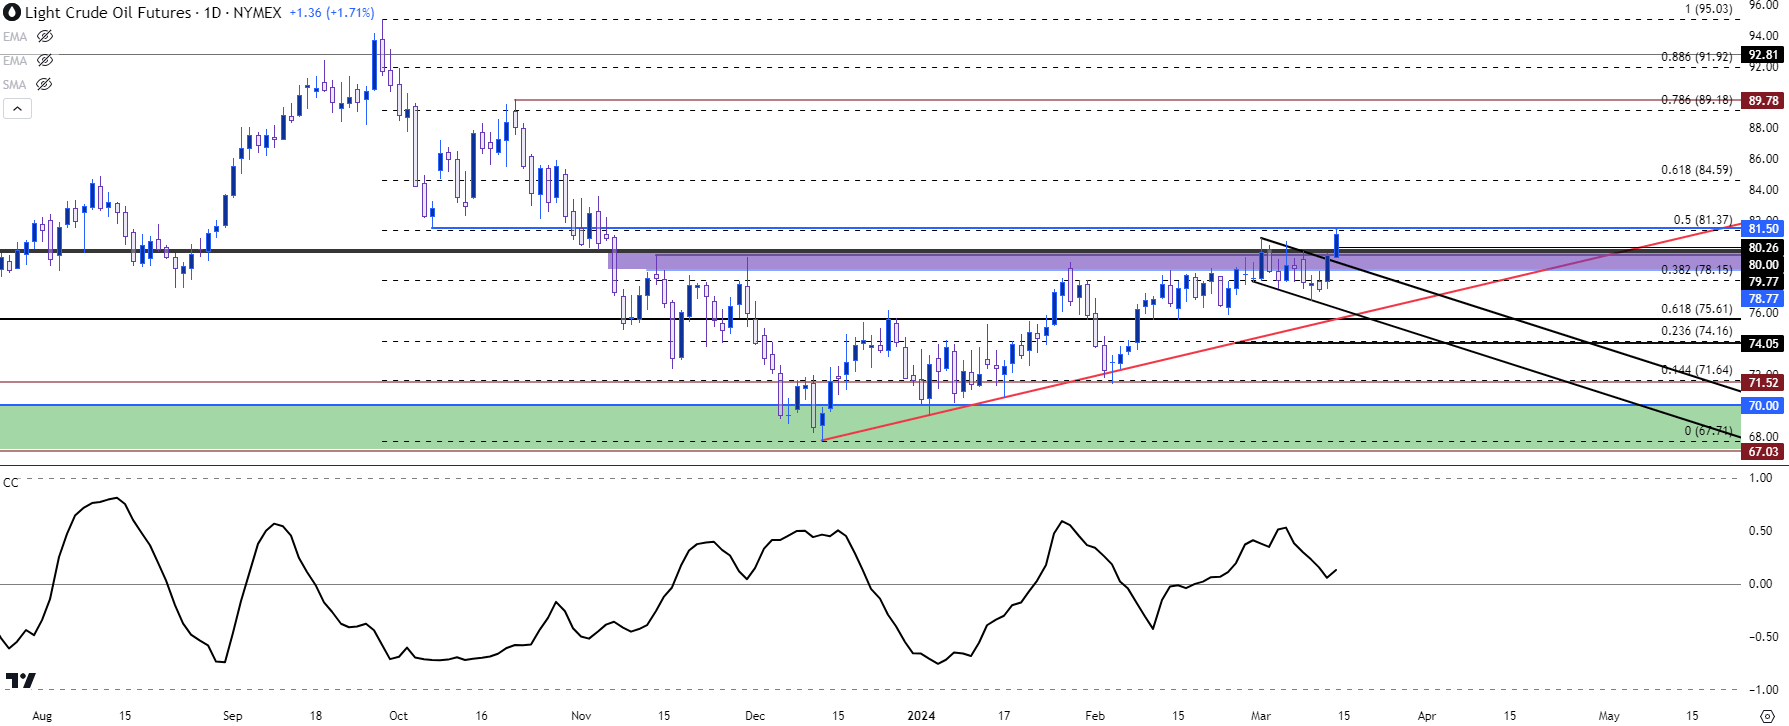 Chart prepared by James Stanley; data derived from Tradingview
USD/CAD
As oil is pushing that fresh breakout, the Canadian Dollar is sliding and in USD/CAD this has been a contentious matter of late.
The first part of the year brought at USD rally, which USD/CAD took part in during the first two weeks of 2024. But, it was around the time that the 1.3500 level came back into the picture that the move began to stall and that’s been the operative mode for USD/CAD for the two months since.
On the below weekly chart, I’ve synched the 1.3500 psychological level with the 1.3480 prior swing low, and this creates a zone that was resistance and is now turning into support.
USD/CAD Weekly Price Chart
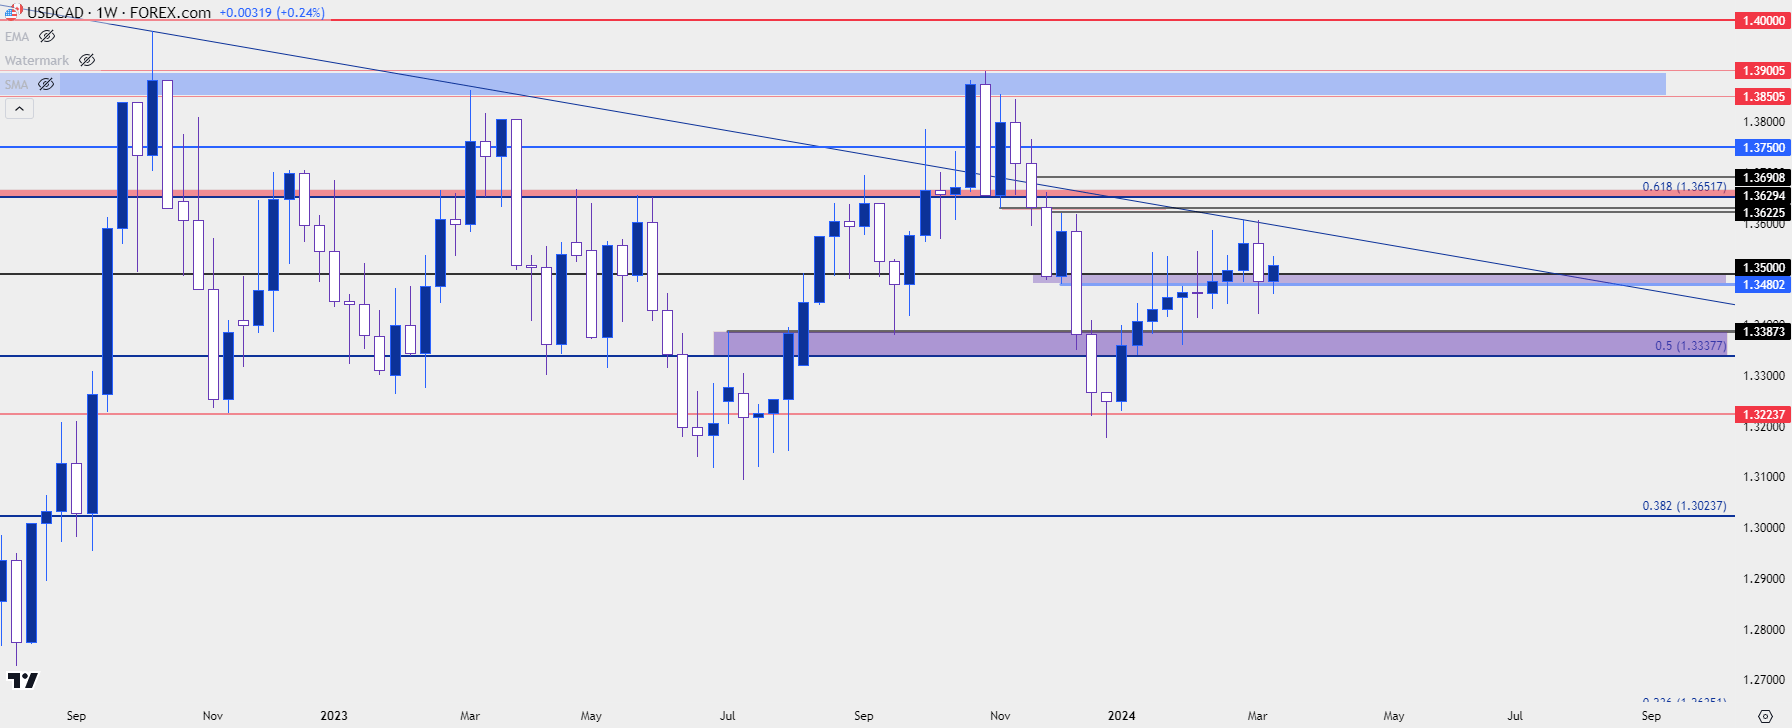 Chart prepared by James Stanley, USD/CAD on Tradingview
The daily chart of USD/CAD is messy, in my view, but there is a couple of key takeaways, such as the resistance that showed up a couple of weeks ago from an old descending trendline, right around the 1.3600 handle. Bulls were thwarted for about a week before sellers got some run, and were able to push back below the 1.3500 level. In the week since, bulls have returned and after facing resistance in the early portion of this week, they’ve been able to get price back above the big figure.
USD/CAD Daily Chart
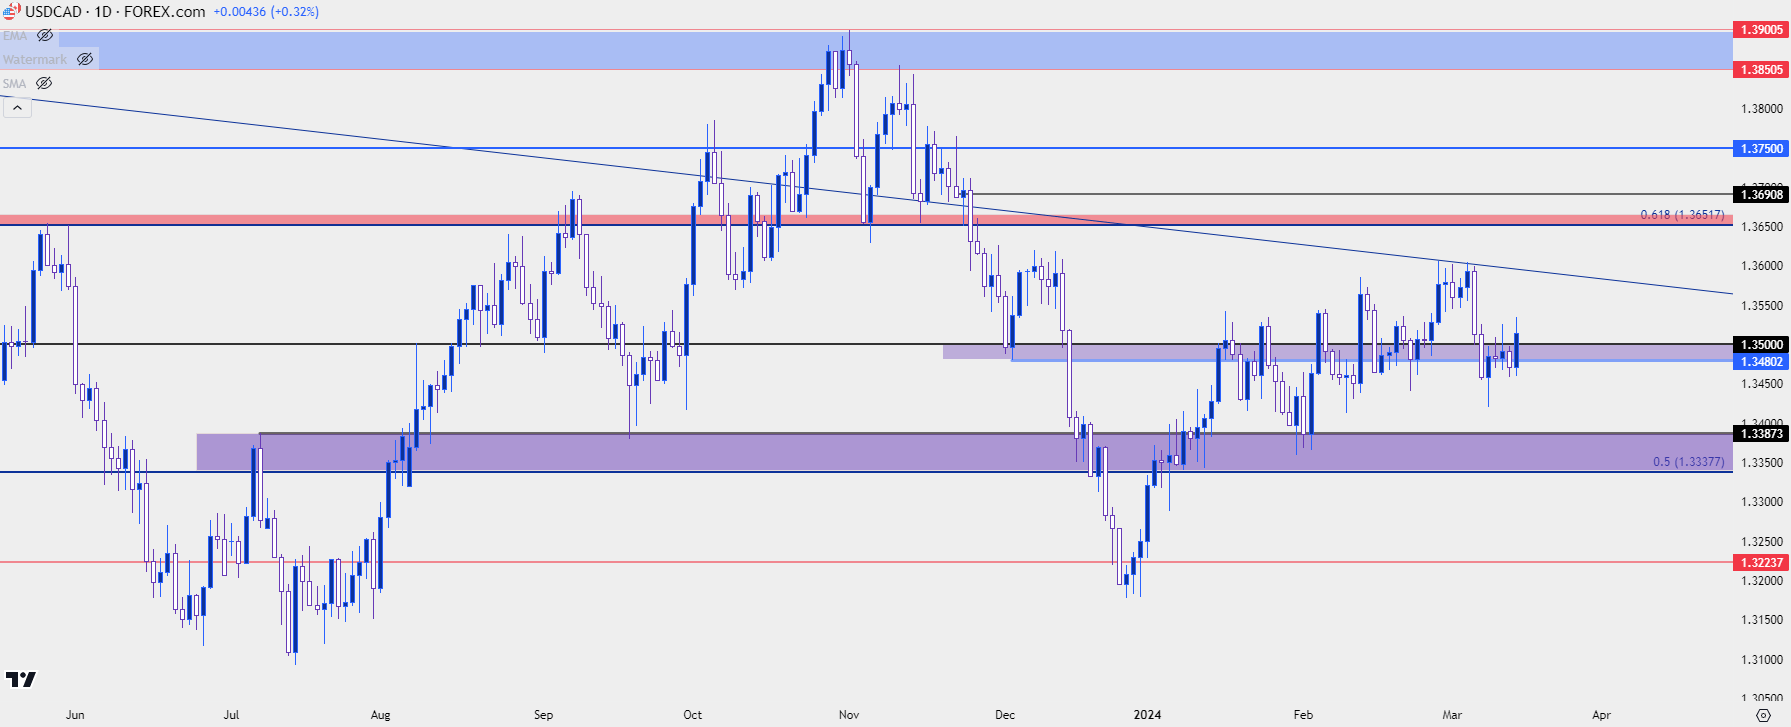 Chart prepared by James Stanley, USD/CAD on Tradingview
The four-hour chart is where matters can get a bit more interesting as we can focus in on that recent return of higher-highs and lows. This morning has produced yet another higher-high, which keeps the door open for bulls, but the big test is whether they can hold higher-low support. And, as of this writing, that could realistically show around the 1.3480-1.3500 zone. As you can see on the below chart the prior swing low plotted at 1.3459, and that would be the levels that bulls would need to defend to keep the bullish sequence alive. If they can, then there’s follow-through resistance potential around prior support, taken from the 1.3550 zone that was in-play during the 1.3600 resistance test.
USD/CAD Four-Hour Price Chart
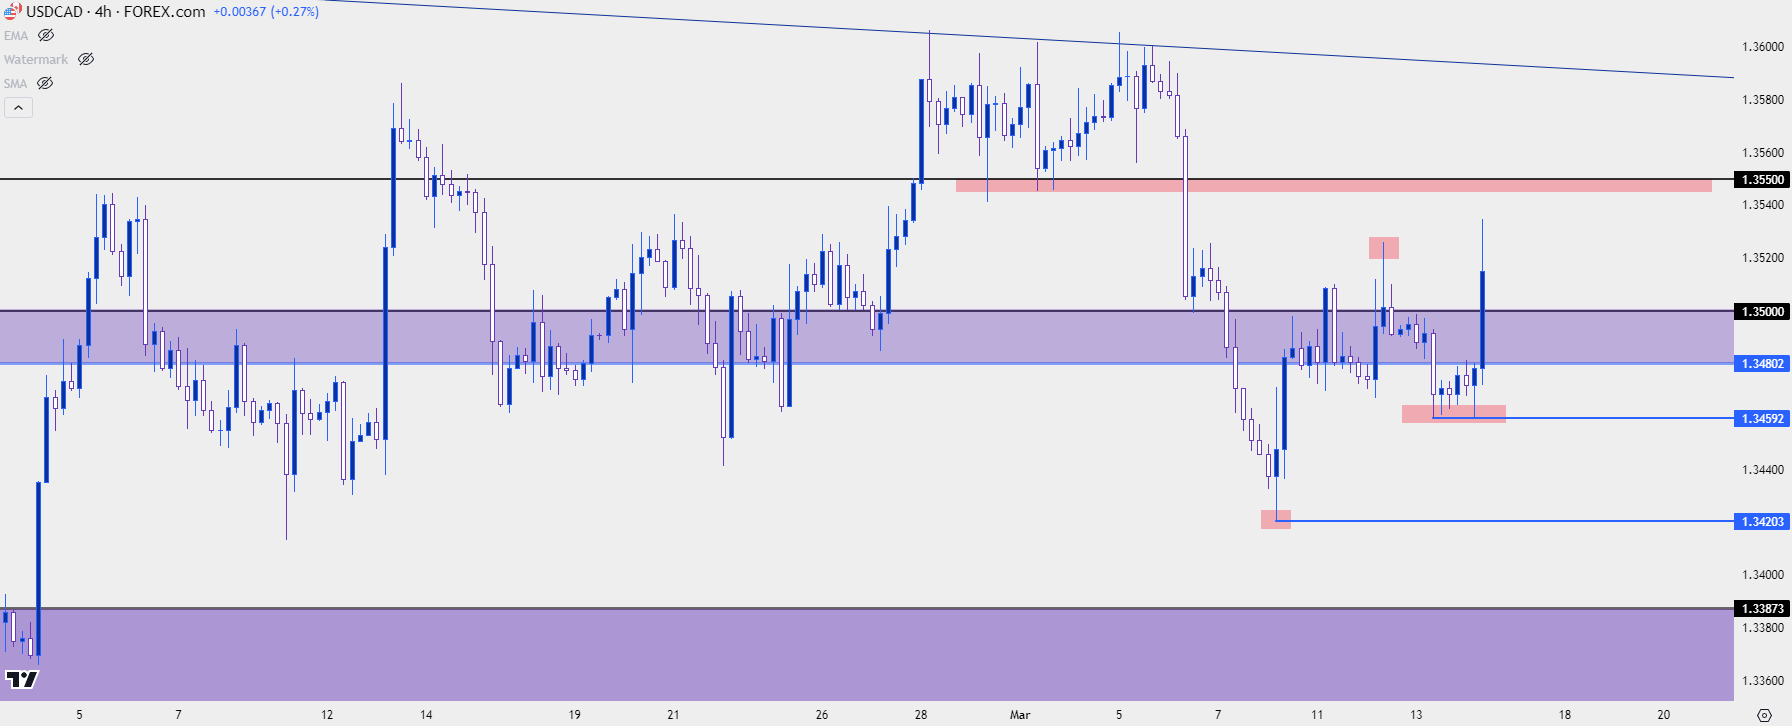 Chart prepared by James Stanley, USD/CAD on Tradingview
--- written by James Stanley, Senior Strategist


