What is a trend?
There are countless ways to answer that question, but I’ve always been partial to perhaps the simplest definition: an uptrend is when an asset moves from the lower left to the upper right corner of the chart, and a downtrend is when it moves from the upper left to the lower right corner.
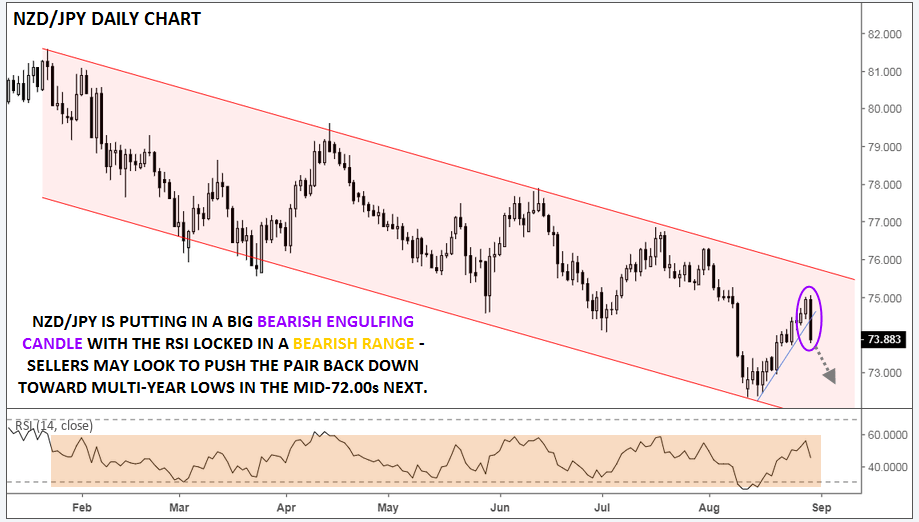
By that definition, NZD/JPY has undoubtedly been a in a downtrend through this year. The cross reached a peak around 81.50 back in late January and has been consistently grinding lower since then, shedding over 900 pips by the middle of this month. Rates have spent the last two weeks rallying off the lows, but the data released in today’s Asian session led to a violent reversal back in the direction of the dominant downtrend.
Overnight, the ANZ Business Confidence survey for August printed at -50.3, its lowest reading. Measures like this, while occasionally noisy, provide a leading indicator of economic health given businesses’ sensitivity to minute changes in underlying business conditions. The survey has now shown business confidence falling for six consecutive months; combined with the continued decline in Global Dairy Trade auction prices, there’s plenty for NZD bulls (and the RBNZ!) to worry about.
Turning our attention back to the chart, NZD/JPY has sliced through its corrective trend line, forming a big bearish engulfing candle in the process. This price action shows a dramatic shift to near-term selling pressure and suggests that the longer-term downtrend has resumed. Meanwhile, the RSI has been locked in a bearish range between 30 and 60 for the last seven months.
Moving forward, bears may look to push the pair the unit back toward the mid-month lows in the mid-72.00s, which also represents longer-term lows from back in 2015 and 2016.

Source: TradingView, FOREX.com
