The focus for much of the week has been on the FOMC statement, which is understandable given the lack of any clear trend for the dollar and especially for the EUR/USD pair. As it has turned out, the Fed left interest rates unchanged as expected but in a surprise move it has removed from its statement the reference to global risks, suggesting it is less concerned about economic and financial developments overseas. The initial reaction to the news was dollar positive but as we go to press, the USD has turned mixed.
There will be two other major central banks that will also be making decisions on monetary policy in the coming hours: first the Reserve Bank of New Zealand (RBNZ) and then the Bank of Japan (BOJ). Out of these central banks, the BOJ is the more likely candidate to loosen its policy. Speculation was rife at the end of last week that the BOJ may consider offering financial institutions a negative interest rate on some loans. Will this be enough or effective to push down the yen and underpin the Nikkei remains to be seen. Although the RBNZ is unlikely to make any changes to its policy after the surprise rate cut at its last meeting, it could nonetheless provide a bearish outlook on the New Zealand economy and hint at further interest rate cuts down the line. So, there is a possibility that the NZD could weaken. However that being said, the surprise rate cut last time only had a temporary influence on the NZD before the commodity currency surged higher.
If the NZD weakens then it makes sense to play it against a strong currency, such as the British pound which has surged higher in recent days on receding Brexit bets. Conversely, if the NZD rallies, then it makes sense to play it against a weaker currency. The JPY could be the ideal candidate, especially if the BOJ decides to loosen its policy further by cutting rates into negative or expanding QE.
- NZD bearish scenario: GBPNZD – we have already covered this earlier in the week HERE
- NZD bullish scenario: NZD/JPY
From a technical point of view, the daily chart of the NZD/JPY shows price is currently in consolidation mode ahead of the two central bank meetings. In recent days, price action has actually been bullish. The cross has formed a few bullish engulfing candles; the 50-day simple moving average has flattened and the 21-day exponential moving average has crossed above it. Meanwhile the RSI has been consolidating below the key 60 level after forming a clear bullish divergence with price earlier this month. However, the bearish trend is still in place for NZD/JPY and price is also below the 200-day moving average. What the bulls need now is a clean breakout above the trend line and the 38.2% Fibonacci retracement level against the most recent sell-off at 0.7690-0.7700. In contrast, the bears would want to see a break below the 75.55 short-term support level.
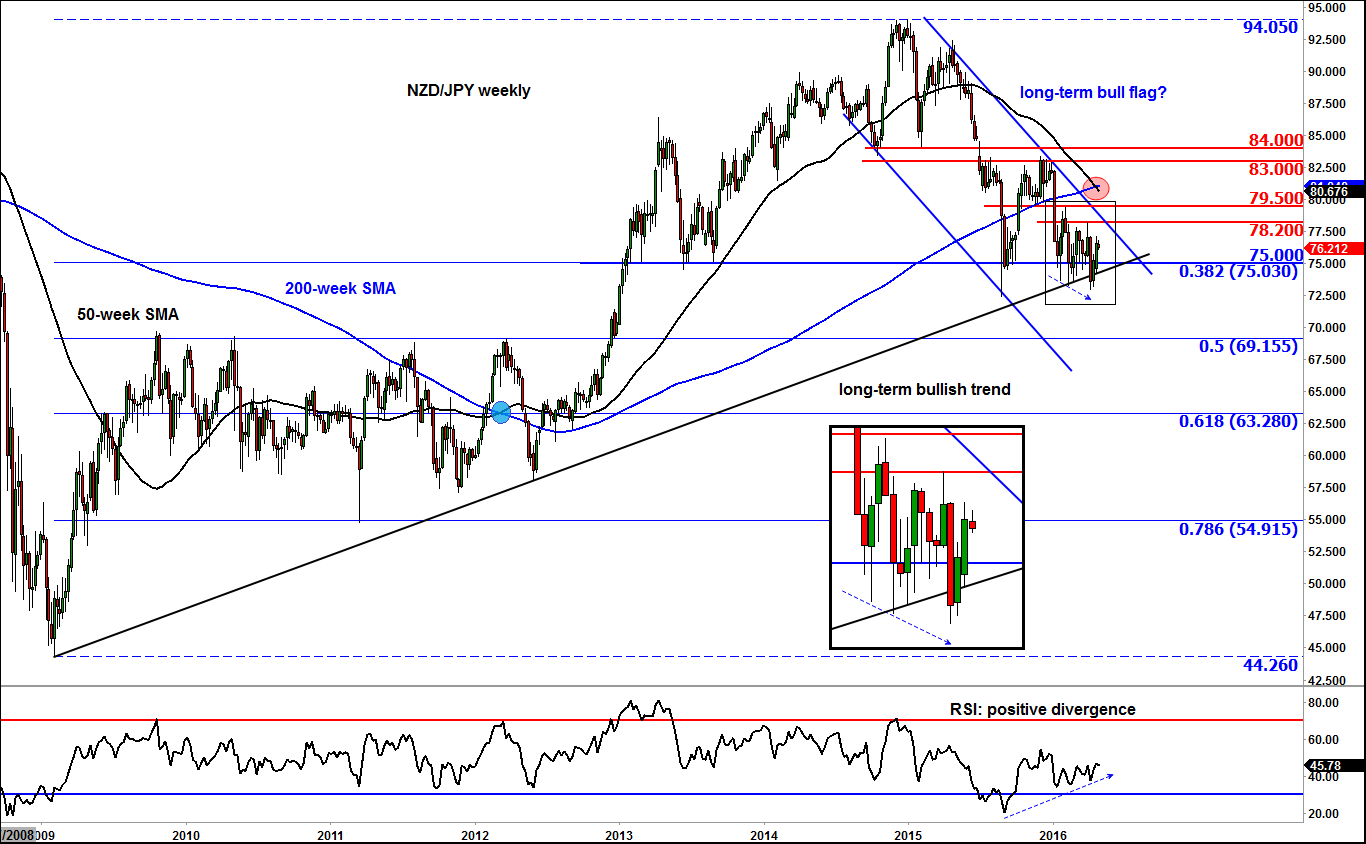
Zooming out to the weekly chart now and one can see that the NZD/JPY is hovering around the significant long-term support at 75.00 and the relatively shallow 38.2% Fibonacci retracement level. In addition, price is still holding above the long-term bullish trend line. So the long-term outlook is still pretty much bullish, judging by this chart. However price is now inside a downward sloping channel. But is this a long-term bullish flag pattern or a bearish channel? Only one way to find out: patience. If and when the NZD/JPY breaks above the resistance trend of the channel then this could be deemed a bullish scenario for this pair. However a move below the recent lows could pave the way for a significant drop for then the long-term trend would break down, potentially leading to follow-up technical selling.
So, in a nutshell then, the short-term trend for the NZD/JPY could become clear, possibility as soon as the RBNZ and BOJ meetings are out of the way. Depending on the direction of the break, there is a possibility that the long-term trend could also become crystal clear. Whatever happens, the meeting of the two central banks should provide plenty of short-term trading opportunities on this pair.
Figure 1:

Figure 2:


