
NVDIA, Nasdaq, S&P 500 Talking Points:
- NVDA is down by more than 15% from last Thursday’s high with prices gapping-lower to begin this week’s trade.
- This has had a noticeable impact in the Nasdaq with a lessened impact on the S&P 500. Dow futures are up sharply to start the week, however, with another test of the 40k level that’s so far been difficult for bulls to leave behind.
- I’ll be discussing these themes in-depth in the weekly webinar. It’s free for all to register: Click here to register.
The high-flyers are on their back foot.
NVDA printed a bearish engulf last Thursday and since then sellers have had their way. Last Friday saw support show at a prior gap from after the FOMC rate decision the week before; and sellers hit it again to begin this week’s trade, pushing a bearish gap that did not get filled. At this point, NVDA is down by almost -16% from the Thursday high but remains well-elevated from the earnings gap that showed up in late-May which I’ve marked in yellow on the below chart.
NVDA Daily Price Chart
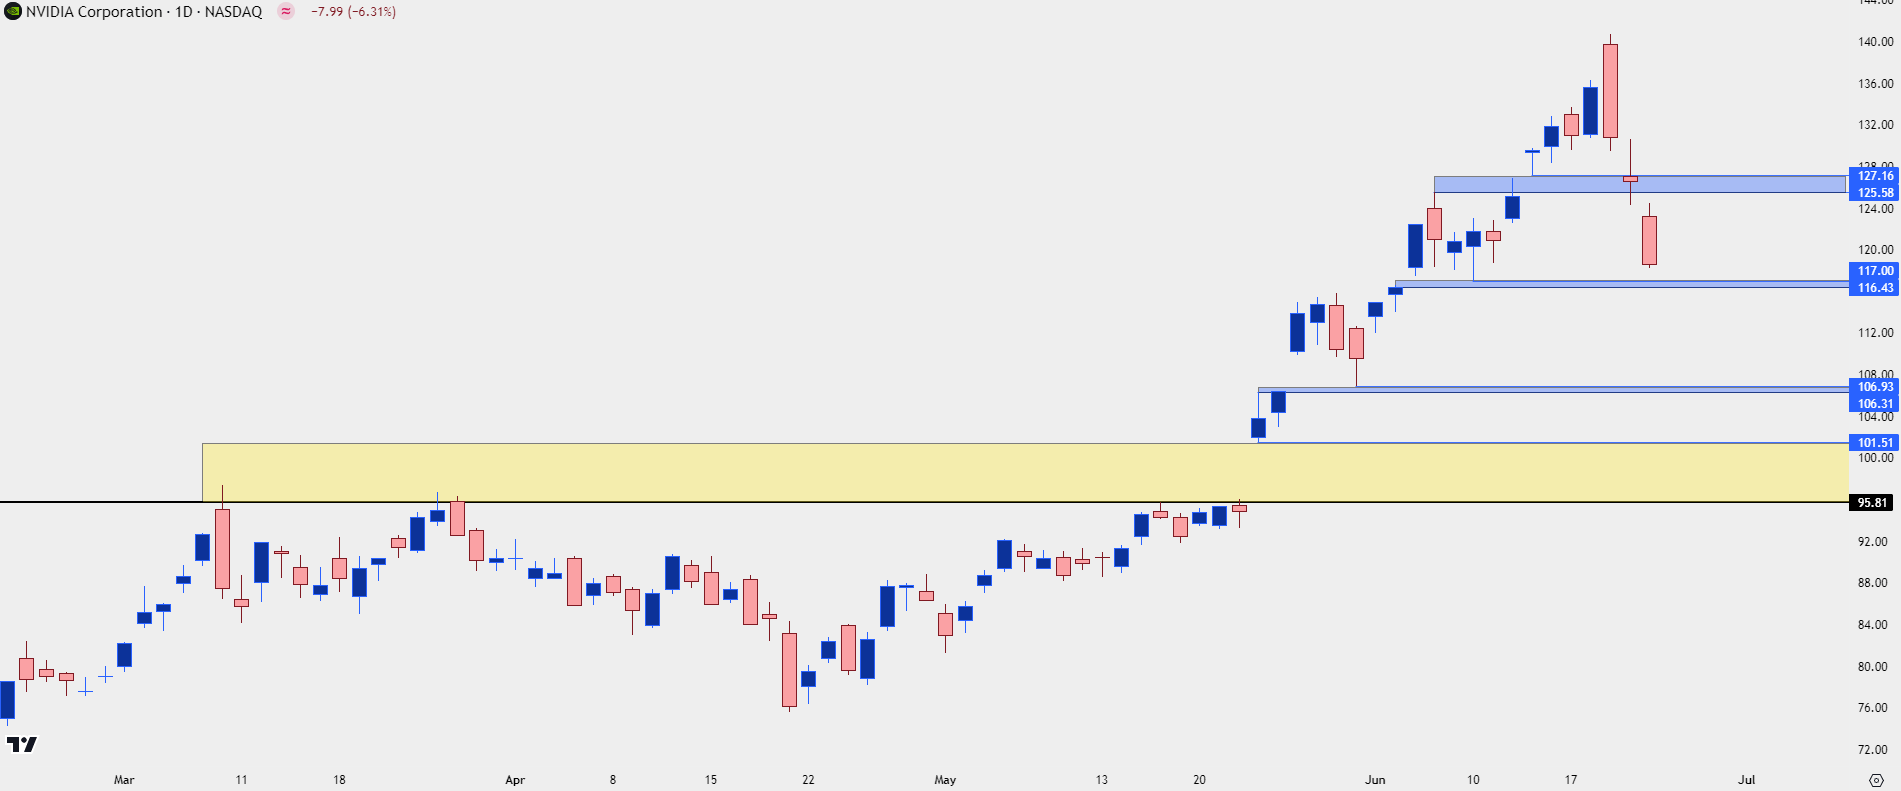 Chart prepared by James Stanley; data derived from Tradingview
It’s not only NVDA getting hit either, as Super Micro Computer (SMCI) is also down heavily from last Thursday’s high, with a current loss of more than 19% from that failed test above the 1k level.
Given that the AI-theme has been driving the excitement in equity markets, this could be a sign of concern.
SMCI Daily Price Chart
 Chart prepared by James Stanley; data derived from Tradingview
Is a Larger Retracement Brewing?
Given that the high-flyers are seeing sell-offs, the natural next question is whether the stock market is nearing a correction. But, putting this question in to scope by looking at the daily chart of the S&P 500, it would seem to be a bit early to start expecting such as the S&P 500 remains very near the all-time-high that was set last Thursday morning.
So far, there’s been defense of support at the prior high of 5517 and there’s scope for support at the 5500 level that set resistance while brewing two consecutive dojis to finish the prior week.
This puts into scope just how aggressive the Q2 equity rally has been after the first three weeks of the quarter gave way to pullbacks. Nasdaq futures gained as much as 19.04% and the S&P as much as 12.58% from the April lows. These are astronomical numbers, especially for two months of performance. So some settling or pullback makes sense and this is something that could, potentially, lead in to reversal. There’s just not that level of evidence yet.
In the Nasdaq 100, I have price currently testing a support level at 19,760, which had offered two days of support at the same time the S&P 500 was grinding at 5500, which was just a day after the FOMC rate decision.
I had looked at that level in the article published on StoneX over the weekend, and I had also shared another couple of levels, at 19,688 and 19,500, respectively, that remain in-play for support potential.
Nasdaq 100 Daily Price Chart
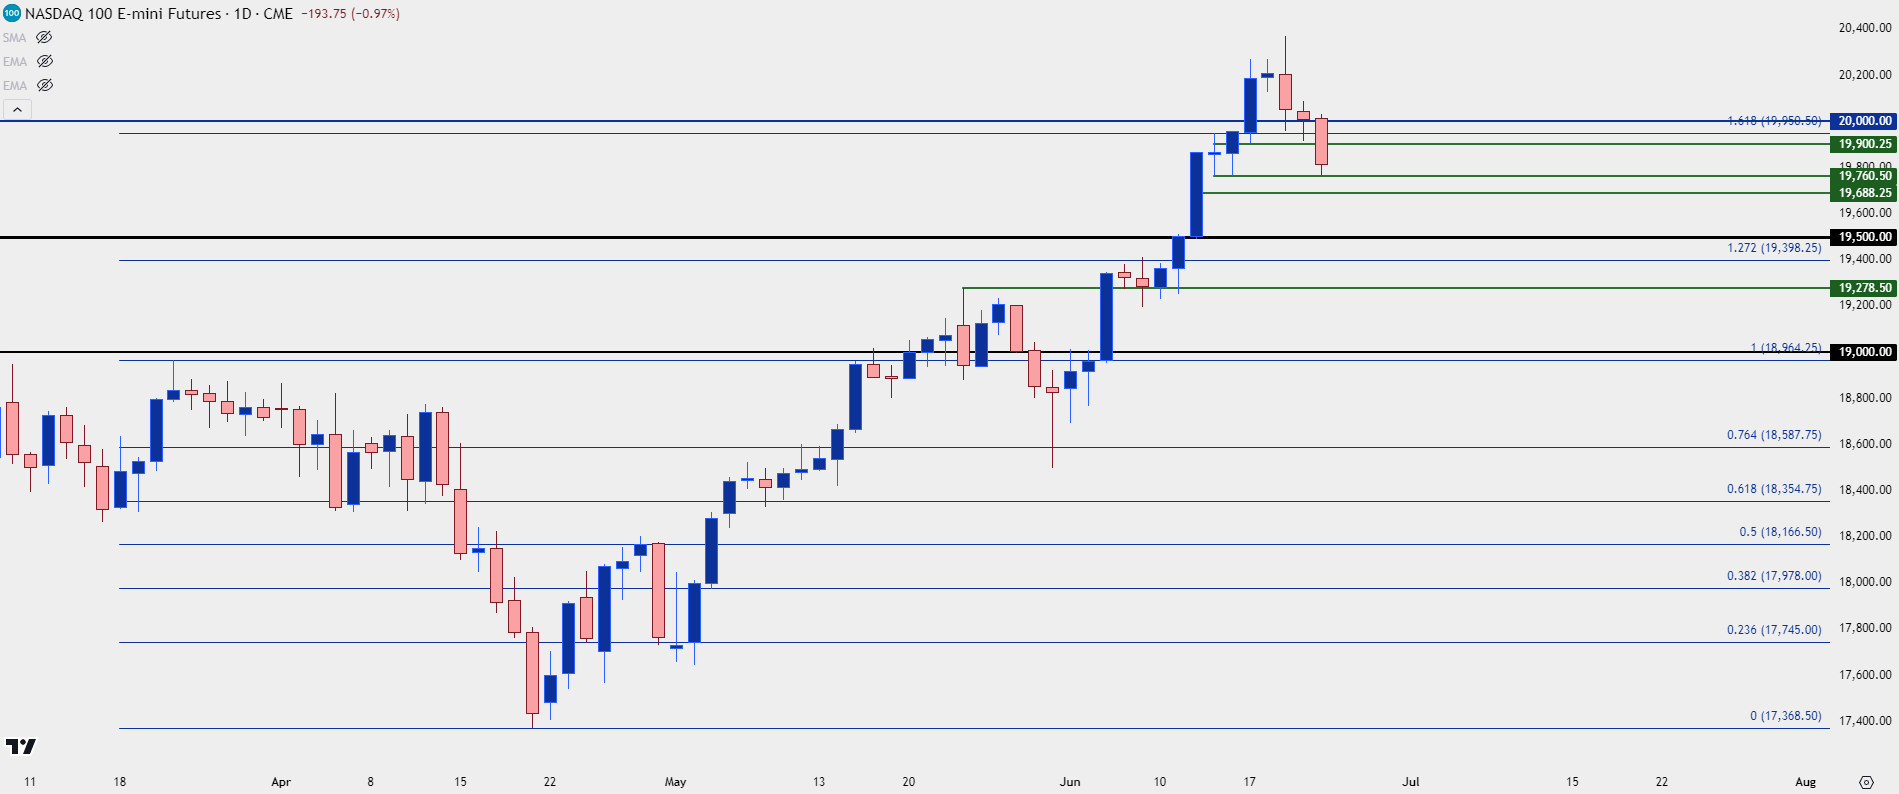 Chart prepared by James Stanley; data derived from Tradingview
Nasdaq Shorter-Term
The four-hour chart below highlights recent bullish structure. As I had shared last week in the Tuesday webinar, the 20k level is an obstacle as it’s a major psychological level and the index was already stretched when it came into play. The question now is whether sellers use prior supports as lower-highs while trying to push a deeper pullback. We saw something similar happen with the 20k level already as it helped to cauterize a lower-high, leading into this morning’s lower-low.
There’s also a level at 19,900 and 19,950 that could be of interest for such.
Nasdaq 100 Four-Hour Price Chart
 Chart prepared by James Stanley; data derived from Tradingview
S&P 500
While the Nasdaq has already started to dip, the S&P 500 has held up a bit better so far.
The 5,562.25 level has remained a sticking point for bulls: That’s the 161.8% extension of the Q2 pullback and it held resistance for three days last week. But the response to that so far has been mild as bulls have held support above prior resistance at the 5,517 level; and below that is another key level at 5,500 which remains as potential support until the market says otherwise.
That level formed two almost perfect dojis after the FOMC rate decision two weeks ago and given the prior show as resistance, this becomes an obvious level to track for buyer interest.
S&P 500 Daily Price Chart
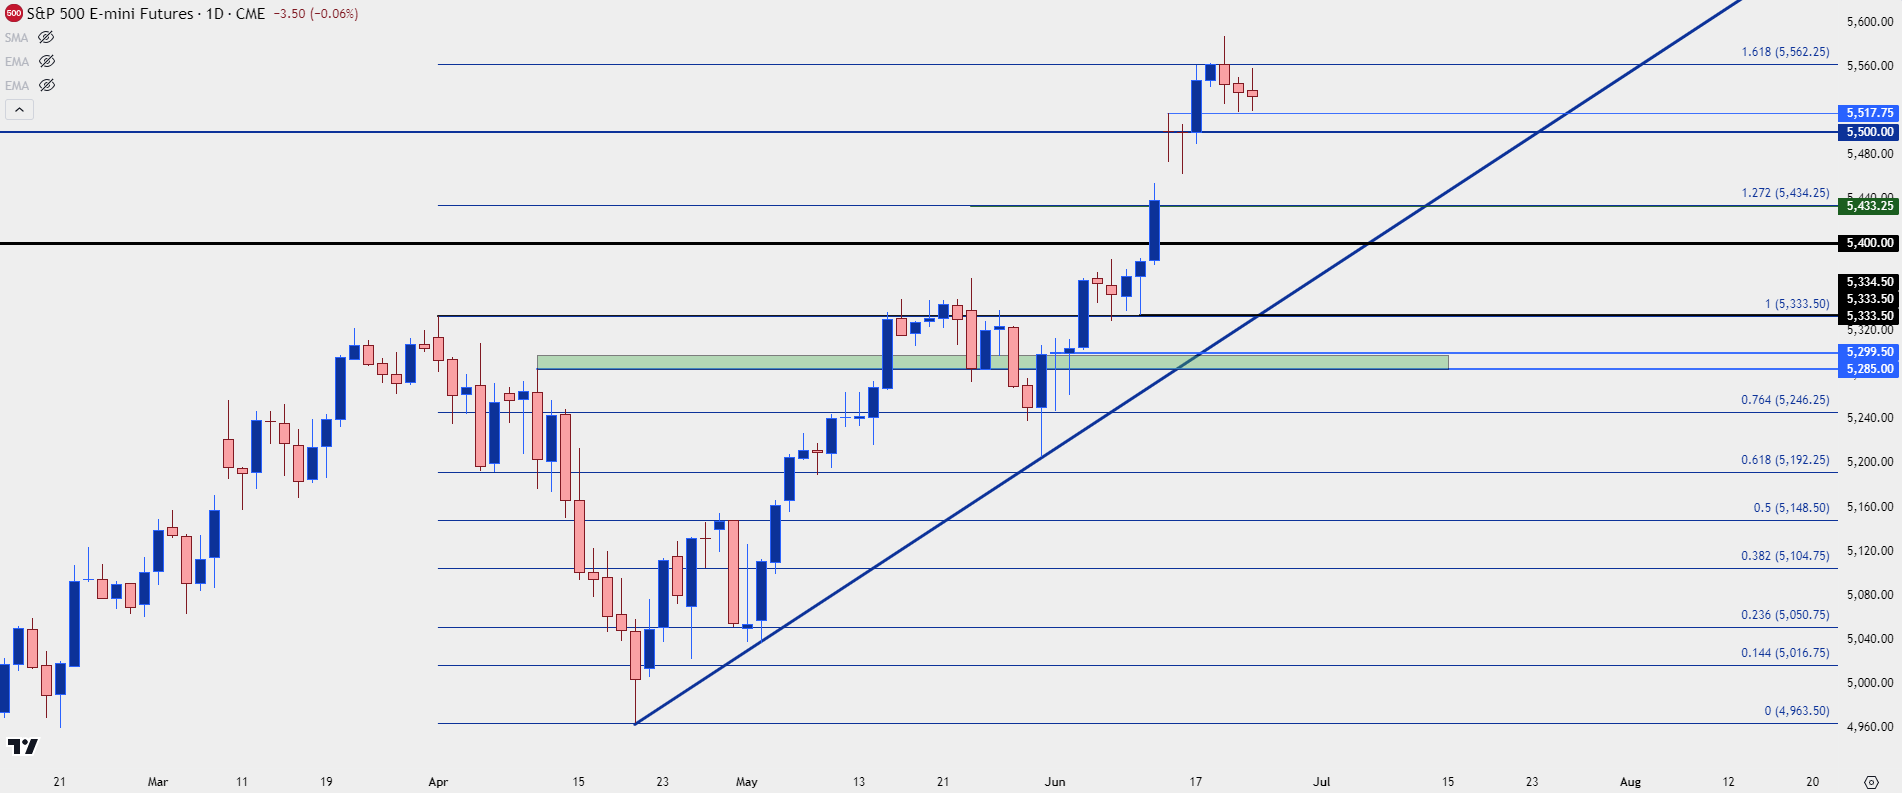 Chart prepared by James Stanley; data derived from Tradingview
Dow Jones
It’s not all doom and gloom out there even with the AI theme taking a step back. The Dow has been a laggard so far in Q2 and at this point, price remains below the all-time-high that printed on the first trading day of the quarter.
As I had written in the 2024 forecast, I was expecting 40k to become a problem point and to date, there hasn’t been much for bullish continuation there. The second test above the big figure in May ended with a lower-high, and as the Nasdaq was ripping in the aftermath of June’s FOMC rate decision, the Dow was lagging behind.
But today shows change, as the Dow is charging higher for another 40k test despite the Nasdaq (and NVDA’s) weakness. This could be illustration that the larger equity strength theme isn’t quite ready to rollover, although that doesn’t mean chasing the Dow would be well-advised.
There’s support potential at prior resistance, taken from the Fibonacci retracement at 39,655, which is the 61.8% marker of the Q2 pullback move. A hold there would allow for support potential at prior resistance, keeping the door open for another 40k test.
Dow Jones Futures Daily Chart
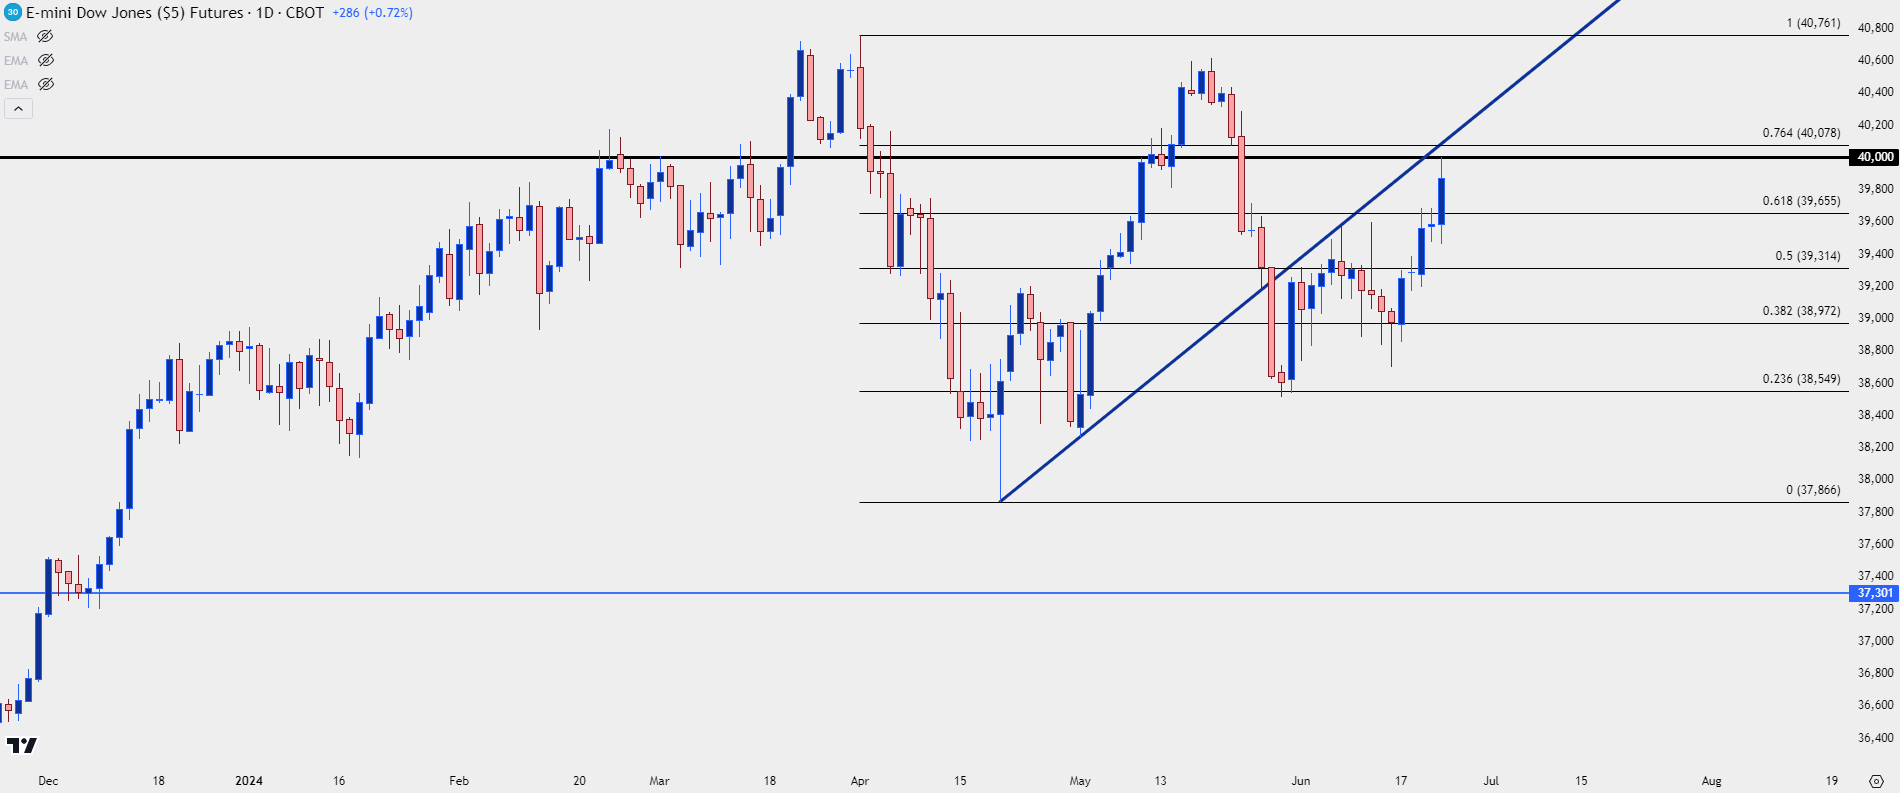 Chart prepared by James Stanley; data derived from Tradingview
Russell 2000
Also encouraging for equity bulls is the Russell 2000, which, like the Dow above has lagged behind for much of Q2. The Russell 2000 small cap index similarly set a fresh all-time-high on the first day of Q2 that hasn’t yet been taken out.
And even at last week’s open, with the index re-testing the 2k level, there was worry about divergence amongst the indices. But that support has since held and the index is nearing a key support test with a resistance zone spanning from 2,074 up to 2,104. There’s also been a bearish channel, which when taken in context of the prior up-trend could be construed as a bull flag formation.
Russell 2000 Daily Price Chart
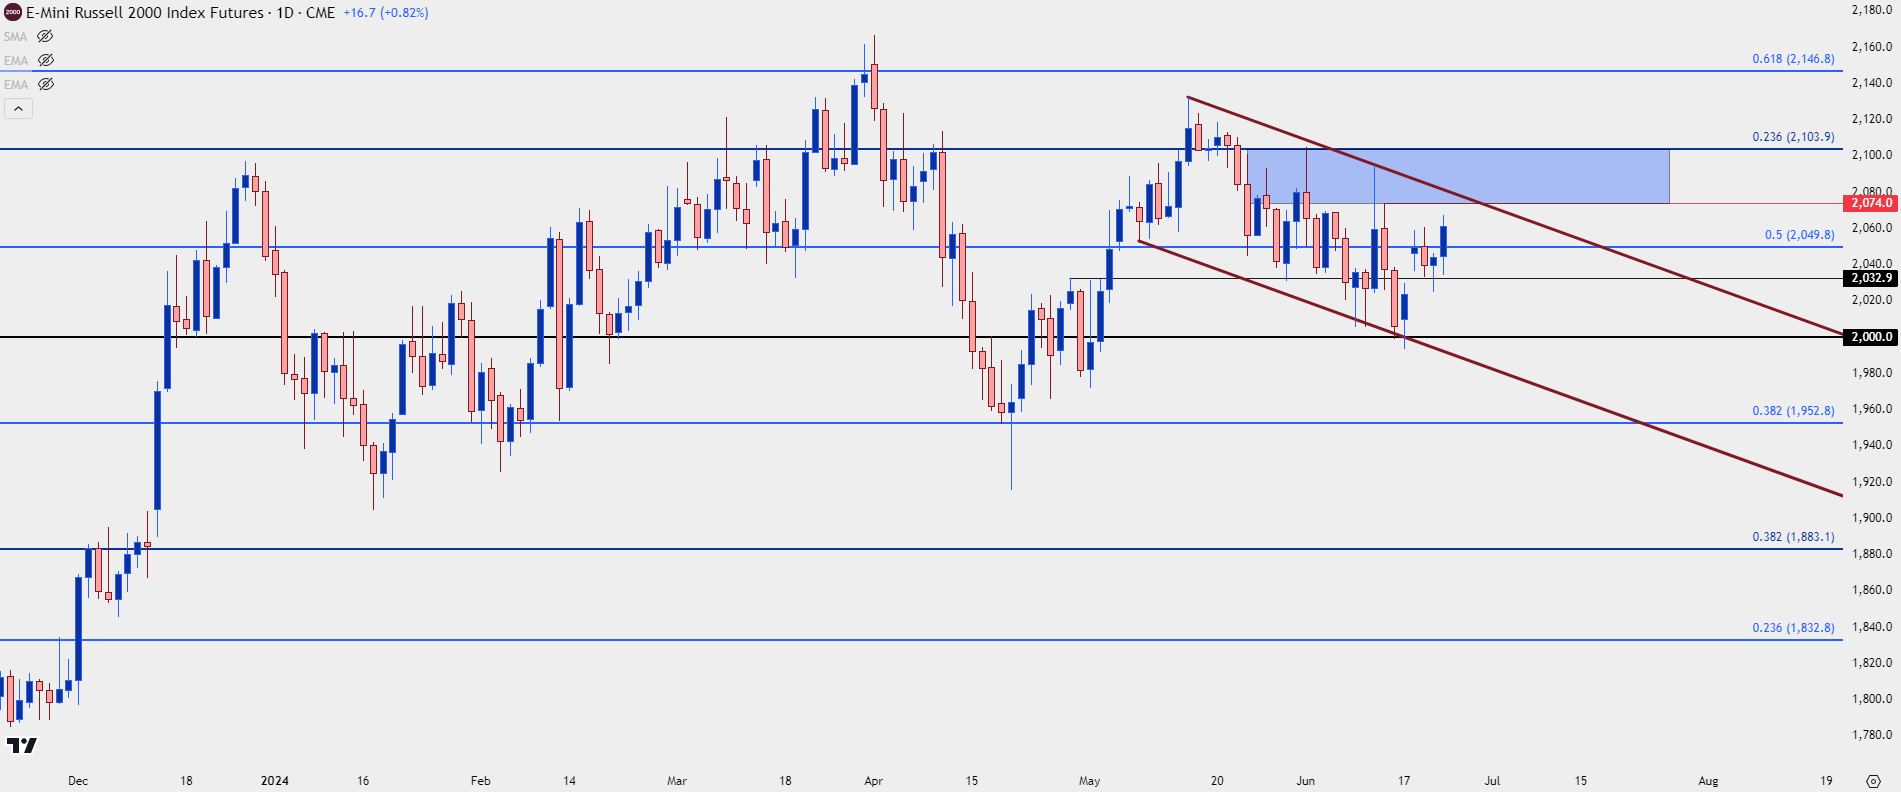 Chart prepared by James Stanley; data derived from Tradingview
--- written by James Stanley, Senior Strategist


