Nasdaq, S&P 500 Talking Points:
- It was a change-of-pace to start Q2 as both the Nasdaq and S&P 500 pulled back. But shortly after the Nasdaq completed a double top formation while flashing oversold conditions, the mood shifted, and it’s been strength for the past four weeks. The big push point for equities this week is the NVDA earnings announcement on Wednesday, and Jensen Huang of NVDA has been well-received by markets of late. There remains a considerable amount of unfilled gap in NVDA from his last earnings call on February 21st.
- Nasdaq 100 futures have already set a fresh all-time-high and the S&P 500 set a fresh all-time-high last week. This goes along with what I had discussed in the Q2 forecast, looking for a pullback that would be offset by a dovish Fed and help from the Treasury department. To get the full forecast, the following link will allow for access: Q2 Forecasts
- I’ll be discussing these themes in-depth in the weekly webinar. It’s free for all to register: Click here to register.
Coming into Q2 it seemed an opportune backdrop for a pullback. I talked about this at the Q2 open, while also writing about it in the Q2 Forecast for Equities. At the time, the S&P was still ripping and RSI on the weekly chart was nearing deeply-overbought territory.
The Nasdaq was perhaps even more interesting, however, as there was already a double top formation in play taking the swing highs from March 8th and 21st. This also highlighted a dose of divergence, as S&P 500 Futures set another fresh high on the first day of Q2 trade while the Nasdaq held below the previously-established highs from the 8th and 21st of the prior month.
Both indices were showing rising wedge formations, which are often approached with a bearish aim, looking for a reversal or pullback in a bullish trend. And for three weeks to start Q2 trade, that’s what we had.
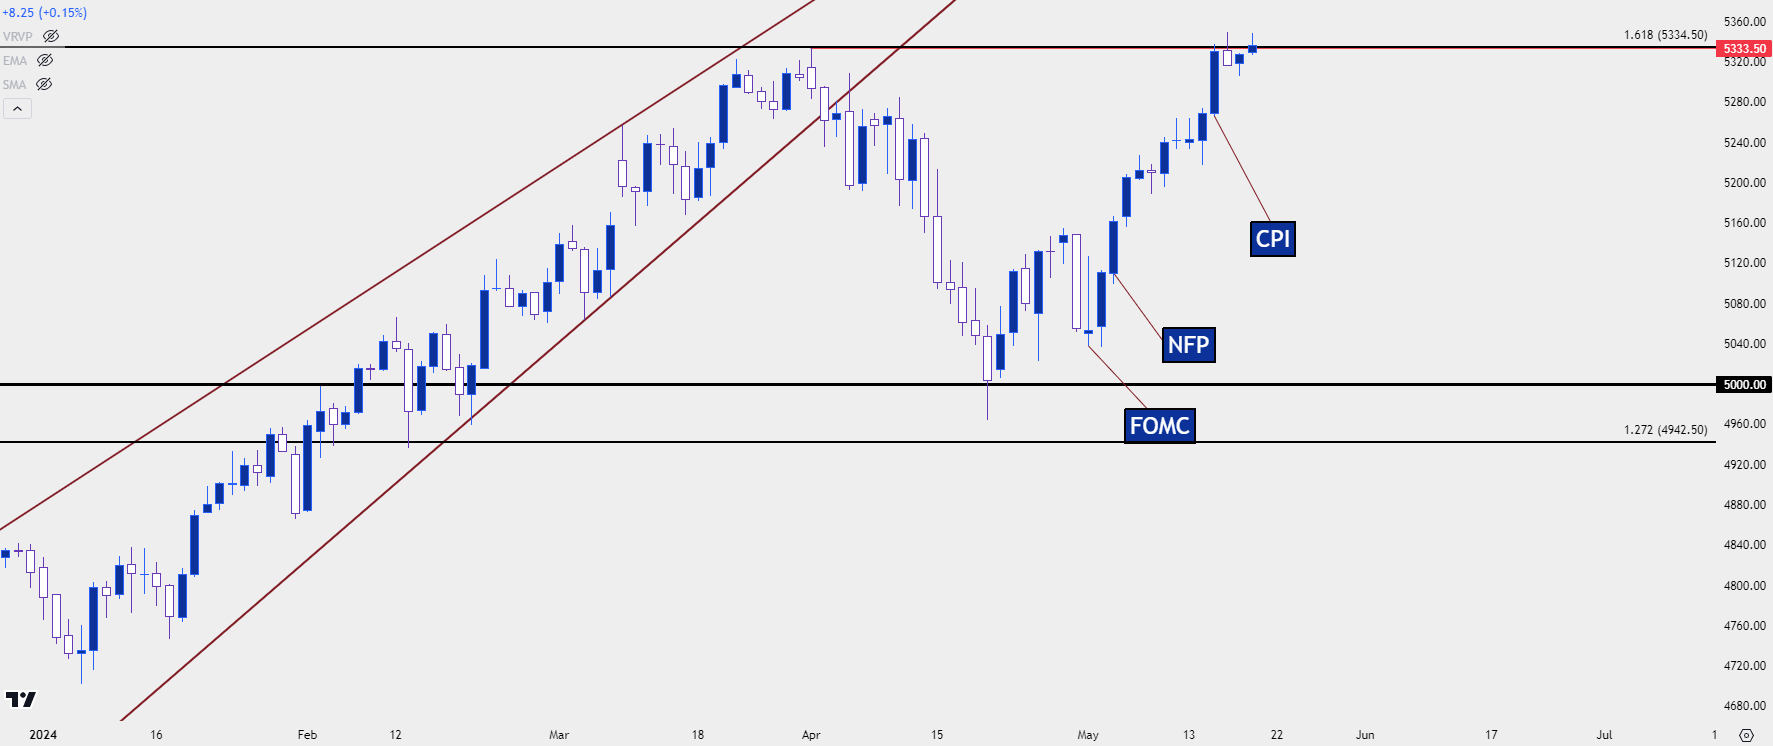
The major turn-of-events showed around the end of April and into the May open. The FOMC rate decision on May 1st saw the Fed strike a familiar dovish refrain. And then the Non-farm Payrolls report two days later showed the first miss on the expected headline number since last November. This gave a big boost to stocks and that ran into the CPI report that was released last Wednesday. Core CPI printed at fresh three-year-lows of 3.6% which, like NFP, brought a bit of excitement to bulls as there was additional progress towards rate cuts on the inflation front. And that’s what helped stocks to catapult up to fresh ATHs.
S&P 500 Futures Daily Chart
 Chart prepared by James Stanley; data derived from Tradingview
S&P 500 Resistance
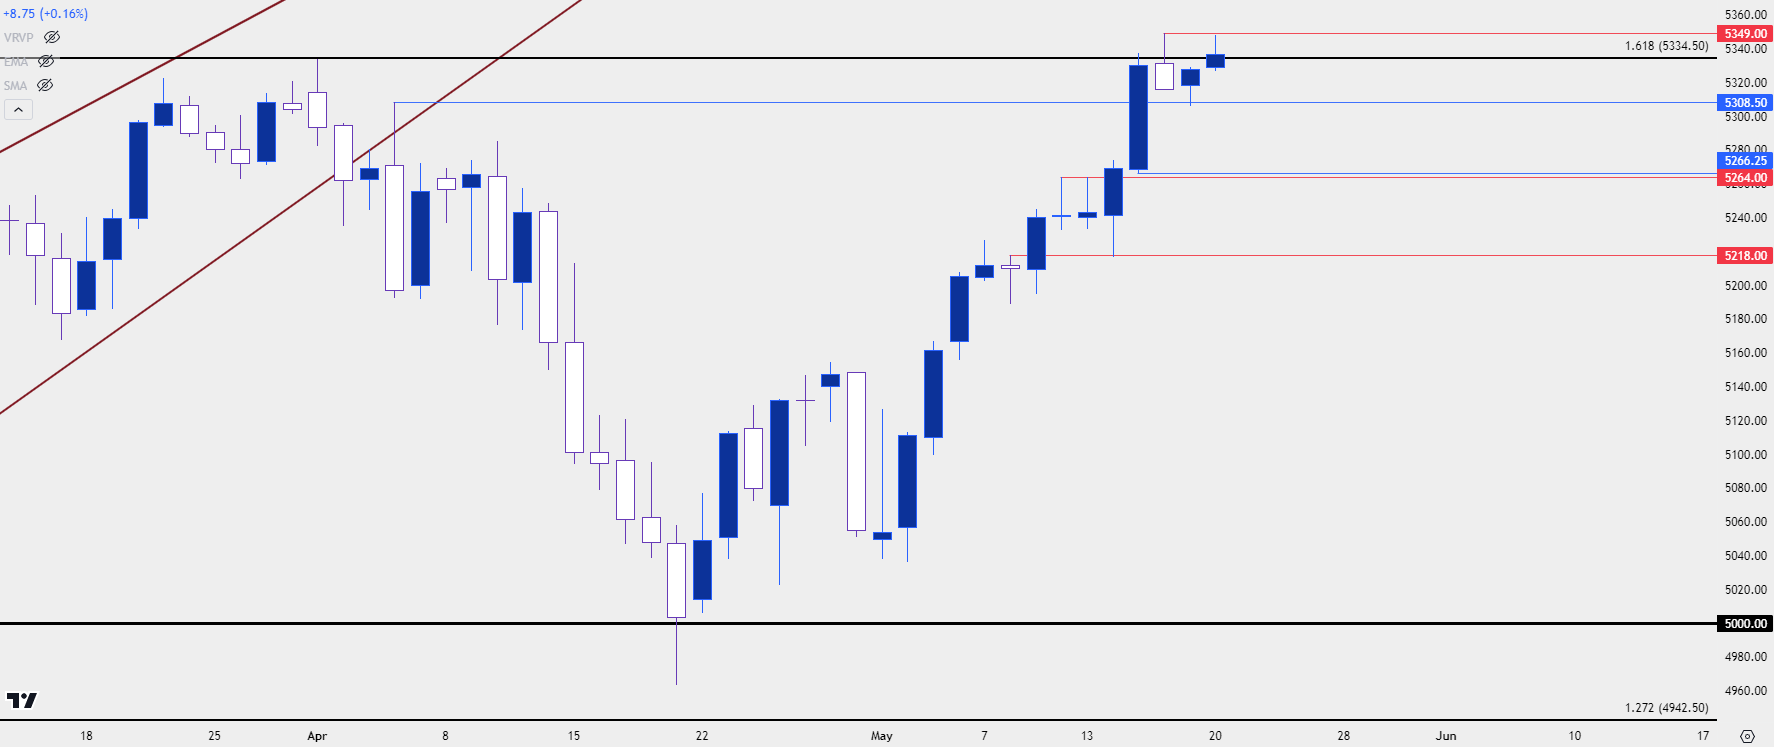
Current resistance in S&P 500 Futures remains at an interesting spot. The level at 5334.50 is the 161.8% extension of the 2022-July 2023 major move. Perhaps more importantly, that was the level that helped to carve out the high on the first day of Q2 trade.
There have since been breaches of that level but to date, no daily closes above that price. On Thursday of last week bulls were quickly turned around and that led to the build of a shooting star formation. That formation could quickly be invalidated by a push up to a fresh high, but that hasn’t yet happened.
So far, the pullback from the Fibonacci extension has been capped at 5308, which is a spot of prior resistance that’s since come back in as support. If bears can push below that, however, there are a couple of additional spots of interest at 5264-5266.25, and then a deeper zone of resistance-turned-support at 5218.
S&P 500 Futures Daily Chart
 Chart prepared by James Stanley; data derived from Tradingview
Nasdaq 100
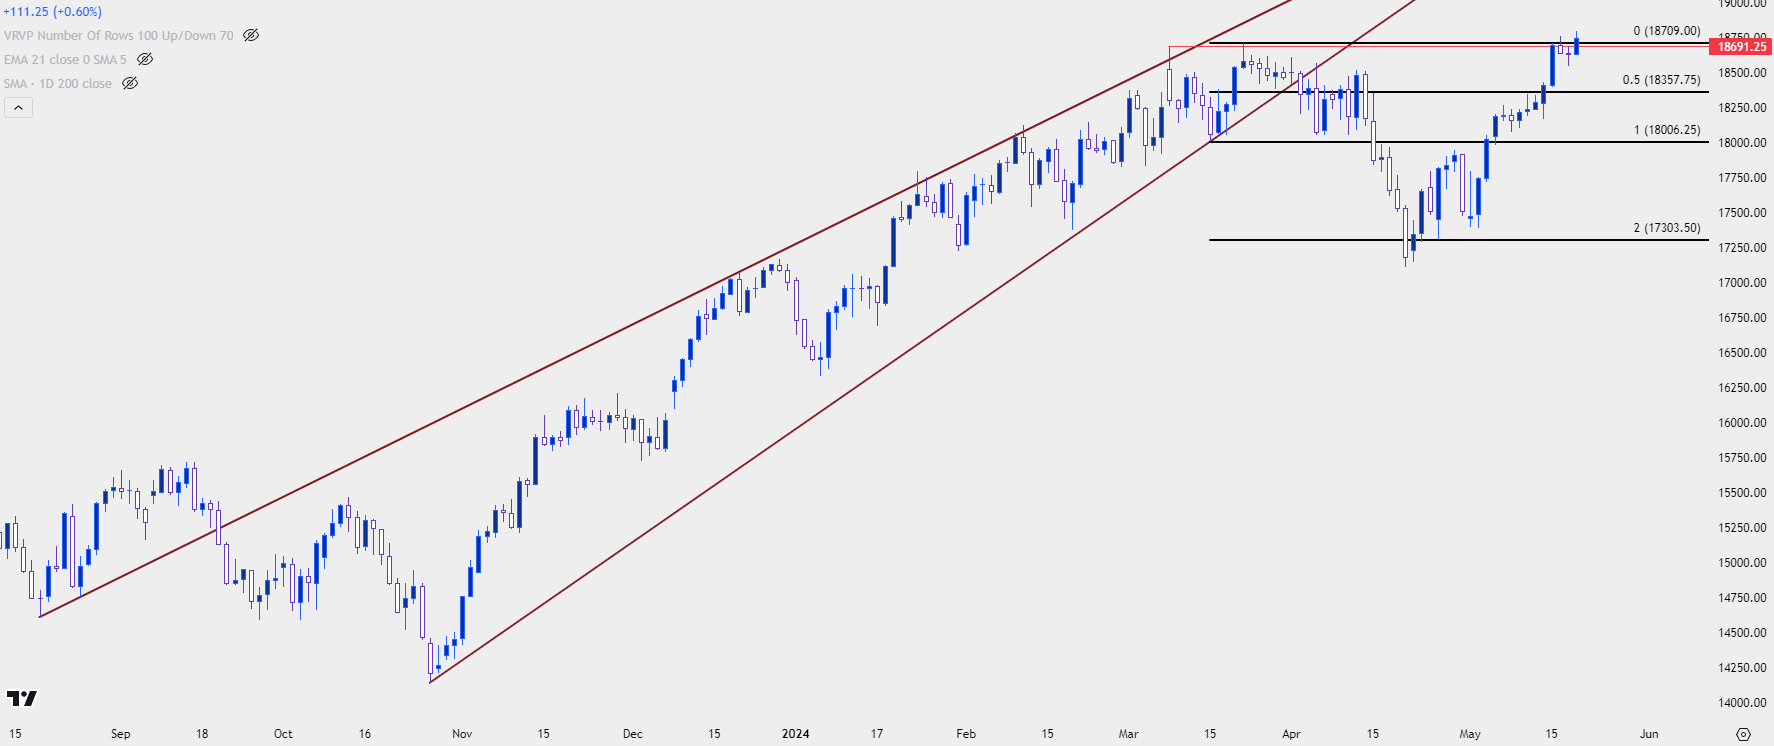
The Nasdaq 100 wasn’t quite as strong as the S&P 500 as we came into Q2 and accordingly, as the pullback developed the tech-heavy index showed a greater degree of weakness. But – after the double top completed by running down to the projected target of 17,303.50, the tides had begun to shift, and that was also around the time that RSI started to show something it hadn’t shown for a couple of years.
From the daily chart, the index went into oversold territory for the first time since September of 2022, just before the low was set. And like the S&P 500 above, it was the FOMC rate decision on May 1st and the NFP report a couple days later that helped to turn the tide; and last week’s CPI report pushed the index up to a fresh all-time-high.
There remains a bit of deviation, however. As we looked at above in the S&P 500, the index hasn’t yet set a fresh high to start this week. The Nasdaq has already done so. This is the polar opposite of the observation at the Q2 open, when stocks were setting up for a pullback, at which point the Nasdaq was holding below previously-established highs while the S&P 500 set a fresh ATH on April 1st.
This type of deduction may have something for market participants to work with.
Nasdaq 100 Daily Price Chart
 Chart prepared by James Stanley; data derived from Tradingview
NVDA Setup
The above chart of Nasdaq 100 Futures bears resemblance to the chart of NVDIA, who is reporting earnings on Wednesday. This, of course, could have a large push point for both indices given the AI-craze that’s been behind equities’ momentous push.
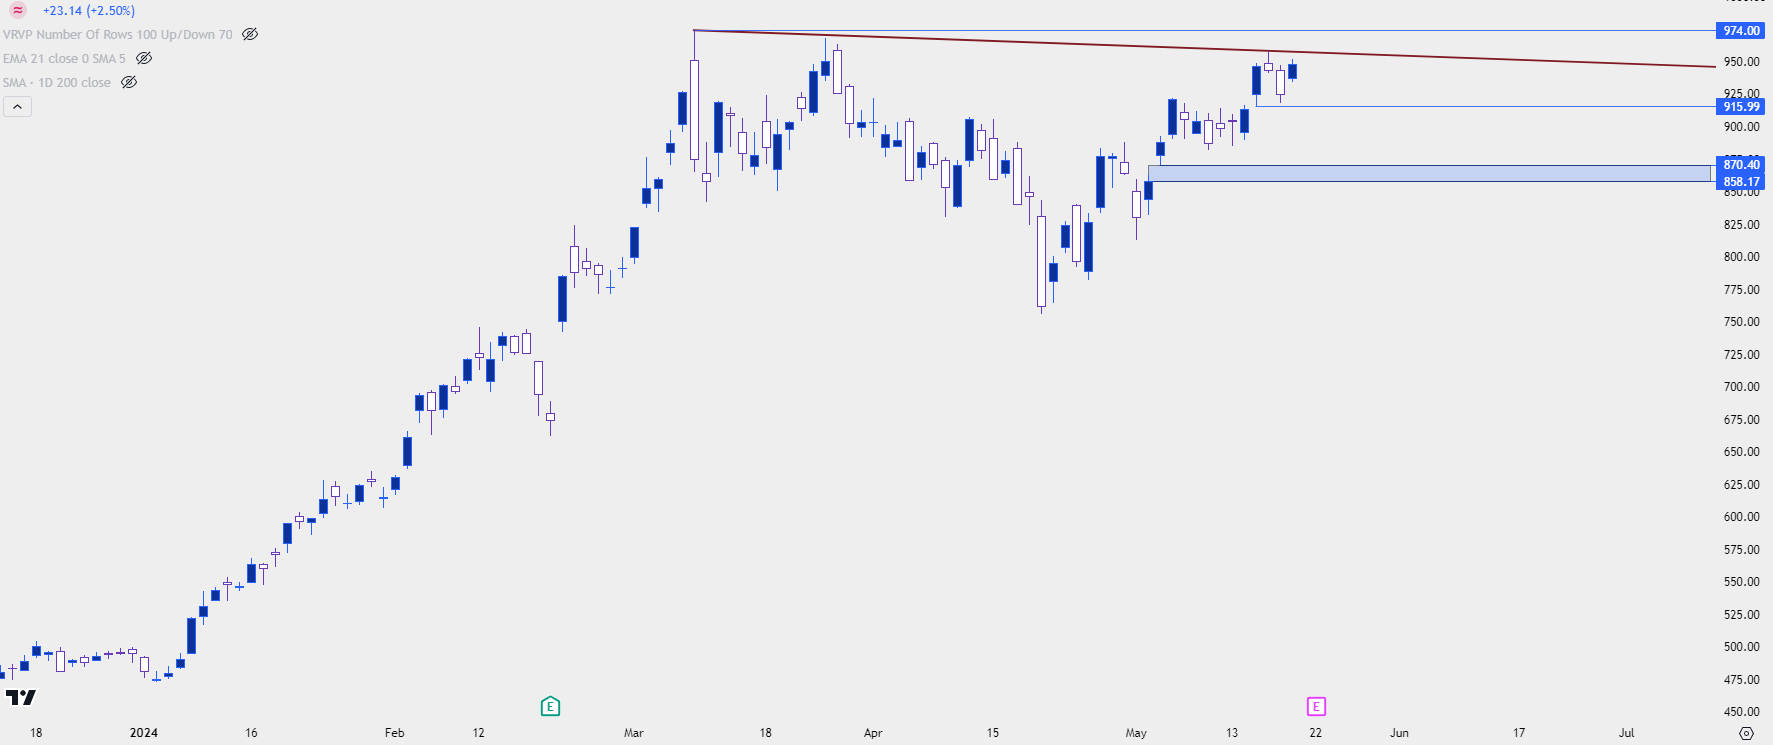
From the daily chart below, we can see that recent pullback that’s largely been clawed-back, but there’s also been a progression of lower-highs as bulls haven’t yet shown a willingness to test through the $1k level.
From the daily chart, there’s also the appearance of an inverse head and shoulders pattern which could point to continued upside, and perhaps even a test above the major psychological level. Jensen Huang of NVDA has guided the stock higher through earnings reports; and there remains a considerable amount of unfilled gap from his last earnings announcement on February 21st.
He could help to drive the stock up to a fresh high, which could similarly benefit equity indices like both the Nasdaq 100 and S&P 500.
NVDA Daily Price Chart
 Chart prepared by James Stanley; data derived from Tradingview
--- written by James Stanley, Senior Strategist


