- US stock futures reversed big early losses on Wednesday, led by tech
- Rather than fundamental factors, the move looks to have been technically driven
- S&P 500, Nadsaq 100 break above known levels, presenting bullish setups for traders
Do not adjust your screens
A lot of traders in Asia must have wondered whether they were still dreaming when they woke up and saw the huge gains on the S&P 500 and Nasdaq 100 on Wednesday, reversing a big opening plunge sparked by a hotter-than-expected US CPI report for August.
There were all kinds of fundamental narratives being pitched in the media and in market chat groups I’m part of, but none provided a definitive answer as to what exactly sparked the reversal. From my perspective, the uptick inflation does has positive readthroughs for revenue growth, especially if accompanied by evidence of firm demand as we’ve seen recently. But yeah, nah. I’m not even buying that.
Rather than anything fundamental, once glance at S&P 500 and Nasdaq 100 futures suggests the move may have been technically driven, sparked by an inability to break through lows set earlier in the month.
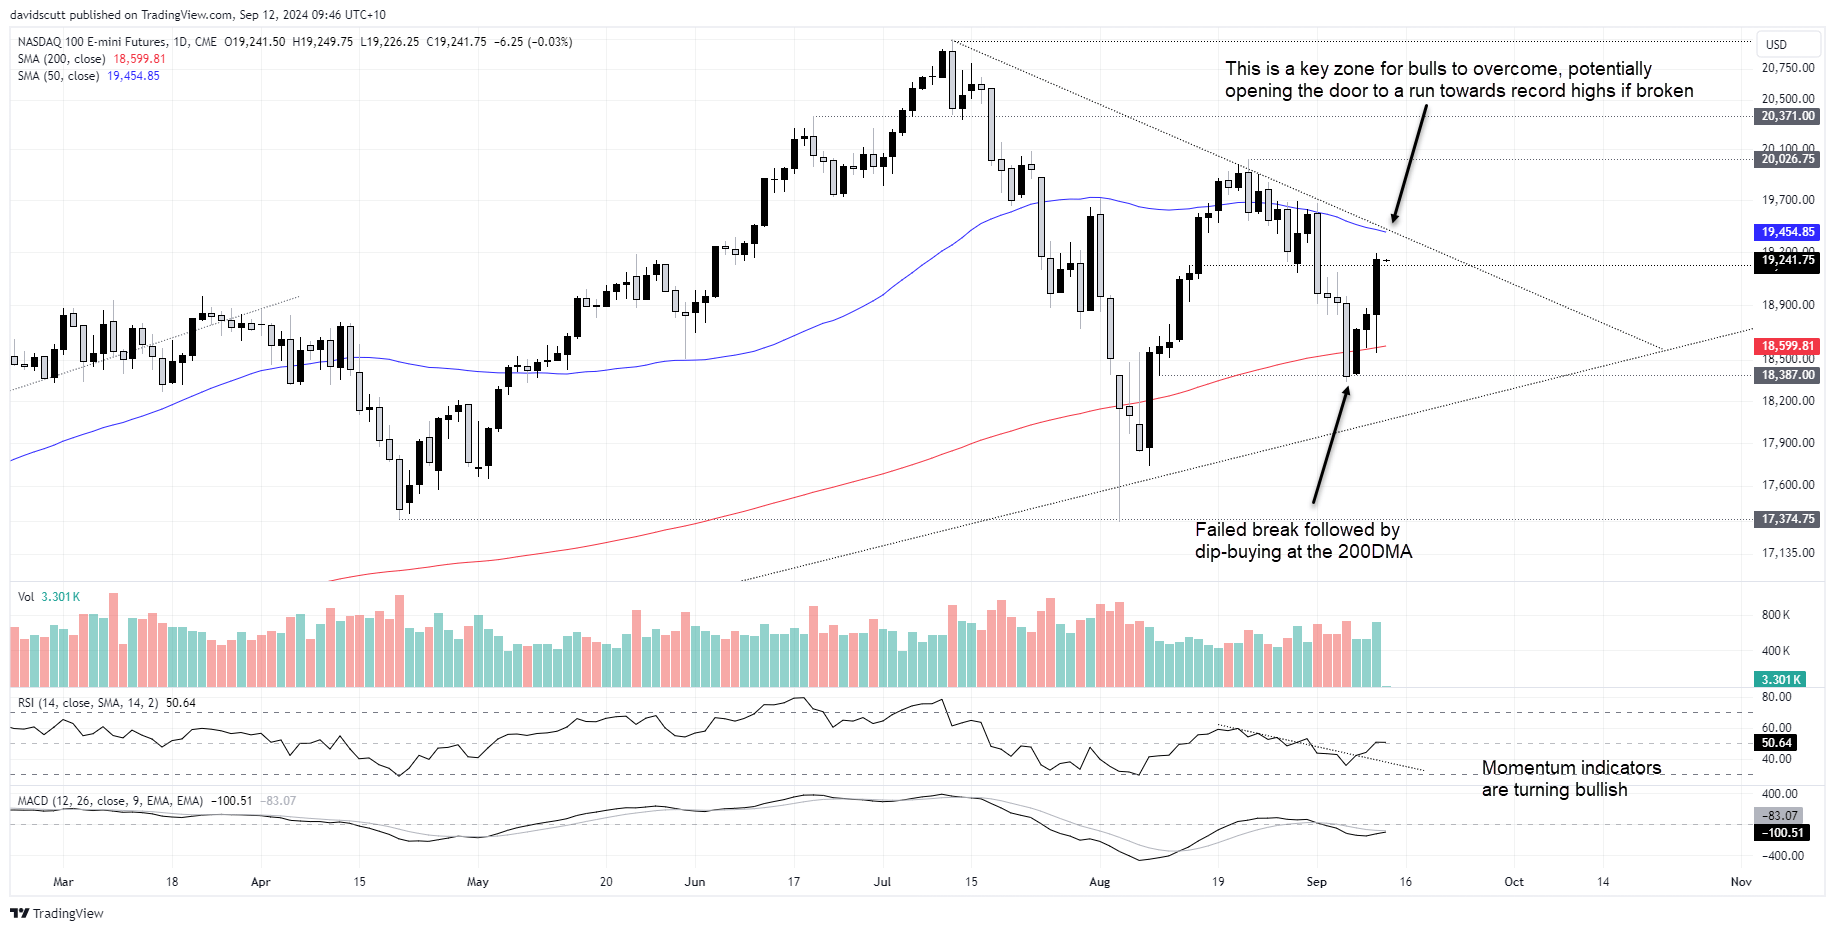
Nasdaq 100 surges after testing 200DMA
Let’s start with Nasdaq 100 E-minis which, like they did a session earlier, attracted decent buying from the 200-day moving average given the lift in trading volumes. With the price managing to break through minor horizontal resistance at 19200, it presents a decent long setup, especially with the bullish breakout in RSI (14) seemingly about to be confirmed by MACD which is also turning higher.

Traders could buy around these levels with a stop below 19200 targeting the 50-day moving average and downtrend running from the record highs set in July. If those levels were to be breached, you could start thinking about a potential push to 20026.75 or 20371 which are the next known levels on the topside.
If the price were to reverse back below 19200, traders could potentially flip the trade around, selling beneath the figure with a stop above for protection. The initial target would be the 200-day moving average with 18387 the next after that.
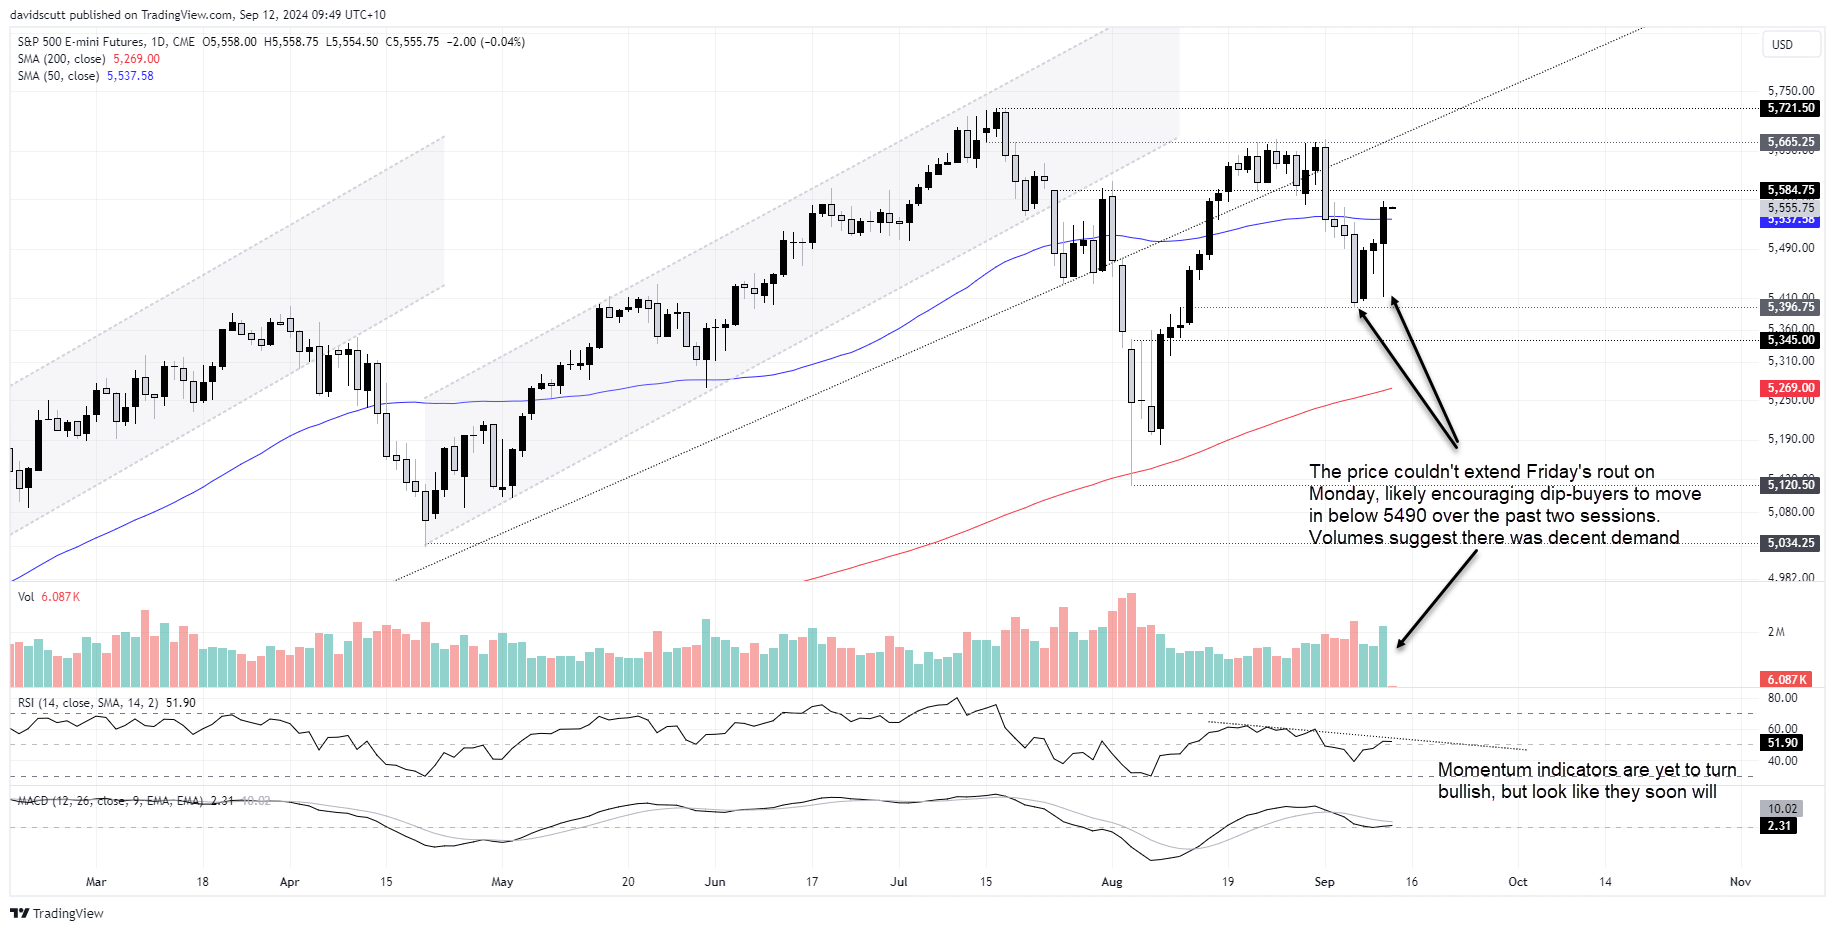
S&P 500 dip buyers are lurking below
Turning to S&P 500 E-minis, Wednesday’s reversal came after yet another failed attempt beneath 5490, as had been seen the session earlier after the price failed to extend Friday’s rout to start the trading week. Like the Nasdaq, the lift in volumes accompanying the move suggests there were plenty willing to buy the dip. The inability to break through 5396.75 signals the path of least resistance may be higher in the near-term.

Having successfully cleared the 50-day moving average on Wednesday, traders can now use this to build trade setups around. As seen during periods earlier this year, the moving average is often tested but broken far less frequently.
Now that the price has closed above, those considering longs could buy around here or wait for a possible pullback to the 50-day, allowing for entry with a stop below for protection. Above, the price did a lot of work either side of 5584.75 in July and August, making that a key level to overcome to make the trade work from a risk-reward perspective. If it can, 5665.25 is a known level with the record highs at 5721.50 the next after that.
Unlike Nasdaq 100 futures, momentum indicators are yet to turn bullish, but they look like soon may. RSI (14) is set to test its downtrend while MACD is starting to flick higher towards the signal line.
If the price is unable to hold the 50-day moving average, the bullish setup would be negated, allowing for traders to consider setting up for a short targeting 5396.75.
-- Written by David Scutt
Follow David on Twitter @scutty


