
Nasdaq, U.S. Dollar Talking Points:
- The U.S. Dollar set a fresh three-month high this week with a strong push on Tuesday following a higher-than-expected CPI print.
- Stocks initially pulled back on that CPI release but the move was short-lived, helped along by dovish comments from Fed officials. There was a strong response in leading names like NVDA helping the Nasdaq 100 to push right back up towards prior highs and this helps to illustrate sentiment as even ‘bad news for stocks’ is getting quickly shrugged off. At this stage NVDA is holding an ascending triangle pattern and they report earnings next week.
- I’ll be discussing these themes in-depth in the weekly webinar. It’s free for all to register: Click here to register.
It’s been a busy week for global markets and the big takeaway out of the U.S. was the continued strength showing in inflation, taken from the Tuesday release of CPI and the Friday release of PPI. Elsewhere, however, there were some data points that suggest some element of slowing, albeit slight, with the Thursday release of retail sales and the Friday release of U of M Consumer Sentiment numbers.
The Tuesday CPI report seemed to be especially impactful, at least in the immediate aftermath. While Treasury Secretary Janet Yellen cheered the continued progress with inflation, Core CPI has remained very sticky near the 4% level, speaking to prior fears of the Fed about inflation ‘entrenchment.’ This brought a near-immediate response of USD strength and a push higher in Treasury yields, which also drove pullbacks into equities at the Tuesday open.
U.S. Core CPI Since Jan, 2021
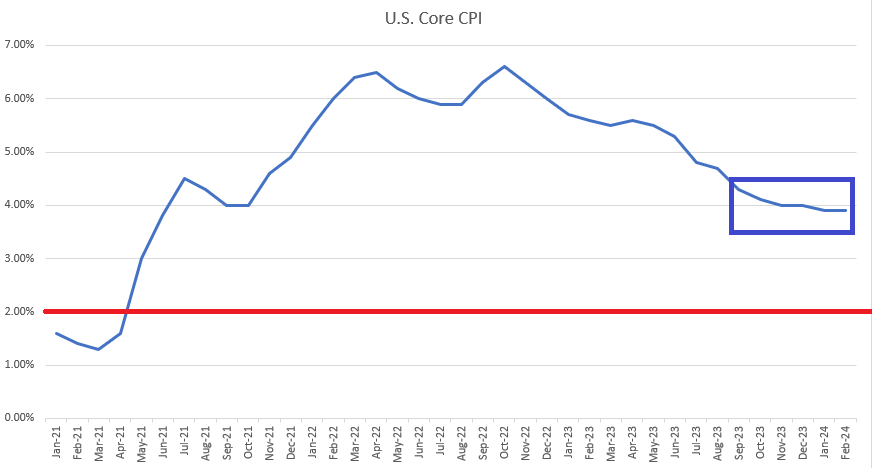
Chart prepared by James Stanley; data derived from Tradingview
But, much as we’ve seen over the past three months, bulls returned quickly and got right back on the bid in equities. And then on Wednesday morning, we heard one of those likely reasons as to ‘why’ when Chicago Fed President Austan Goolsbee said that markets should avoid getting ‘flipped out’ about the prior day’s inflation data, and given that it’s a singular data point, that makes sense, even if it does avoid the flattening that’s shown in Core CPI over the past five to six months. But that was also very much on brand for the Fed that we’ve seen since the November 1st rate decision, which has seemed to be a very dovish push despite data that indicates that the U.S. economy has held up very well.
Given the fears of slowdowns in China, Germany and Japan going into recession this week, it makes sense that the Fed may want to avoid ‘sticking out’ from the global fray, fearing that an intense capital flow into U.S. markets could, in essence, create even larger problems down-the-road.
We can see that dynamic playing out in the U.S. Dollar, below, with a mark at the time of that comment. And, as you can see, the USD was holding very near resistance at 105 at the time before a strong pullback developed to erase much of the CPI-driven spike that showed the day before.
U.S. Dollar 30-Minute Chart
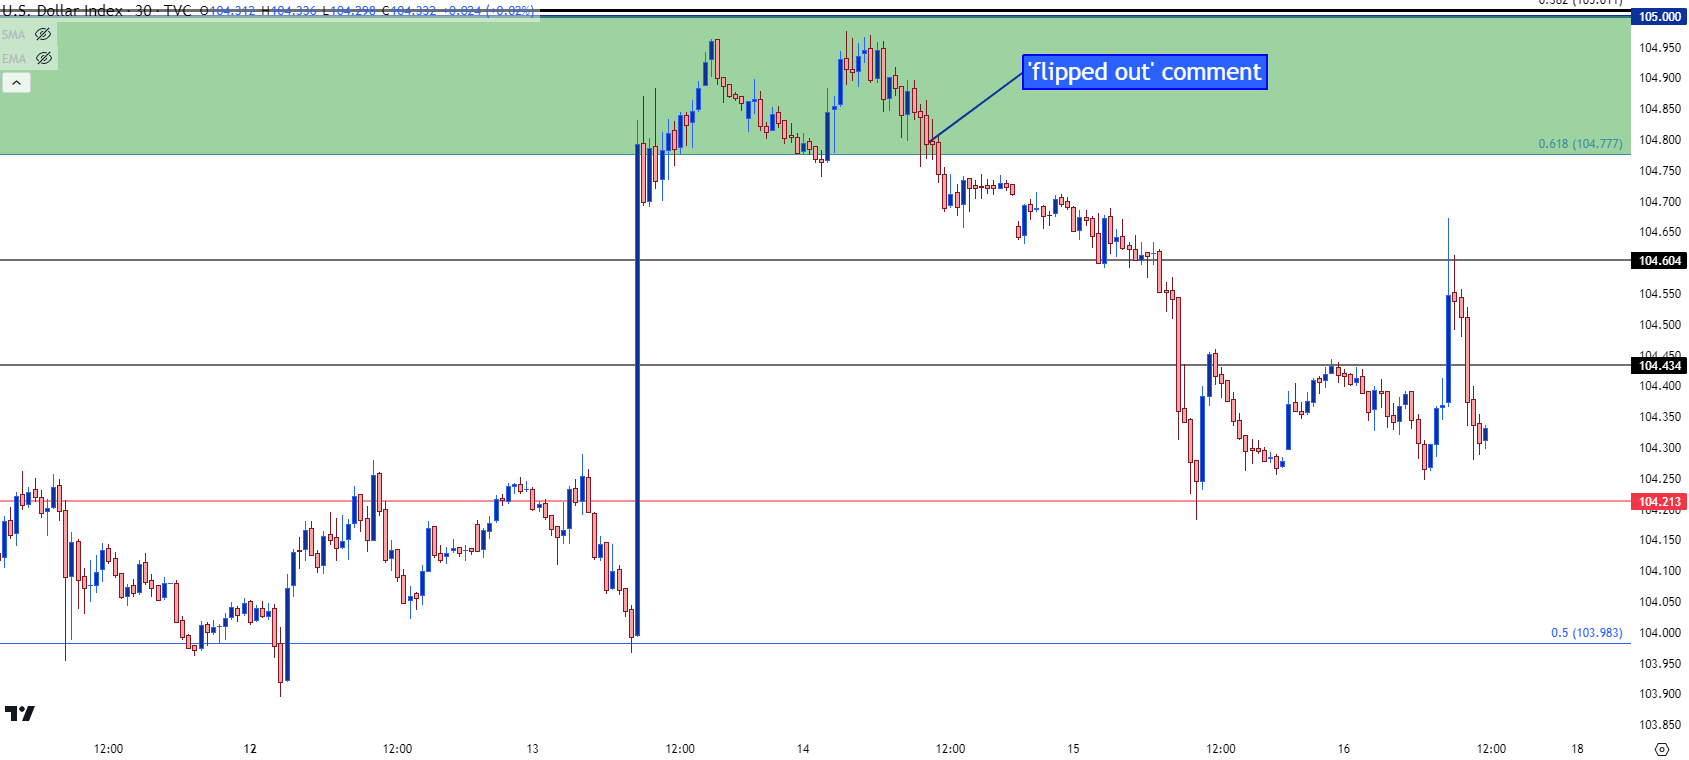 Chart prepared by James Stanley; data derived from Tradingview
Will The Failed Breakout Drive a Larger Reversal in the U.S. Dollar?
This goes to something I’ve been speaking about in webinars of late, in which the ‘natural flow’ from the U.S. Dollar chart appears to be bullish. But this has also been met with a considerable number of dovish pushes from Fed members. That’s not all too different than what started to show in November, however, and that pushed an aggressive two months of USD weakness.
The difference here is that since the 2024 open, U.S. data has been pretty strong while counterparts, such as the Euro, haven’t had the same backdrop. In Europe there are very real fears of recession but unlike the bearish EUR/USD trend from last year or the year before, Euro strength has held up incredibly well on a relative basis; and it seems as if one main reason for that is just how dovish the Fed has been even in light of strong economic data.
On the chart, the big question is whether bulls hold higher-low support. I looked at a series of levels in the webinar highlighting this theme and price remains very near the 3rd support level at 104.21, which had held the lows on Thursday. There’s a couple of additional spots, at the 103.98 Fibonacci level and then at the 200-day moving average; the latter of which held resistance for almost three full weeks but, as yet, hasn’t been tested for support.
U.S. Dollar Daily Chart
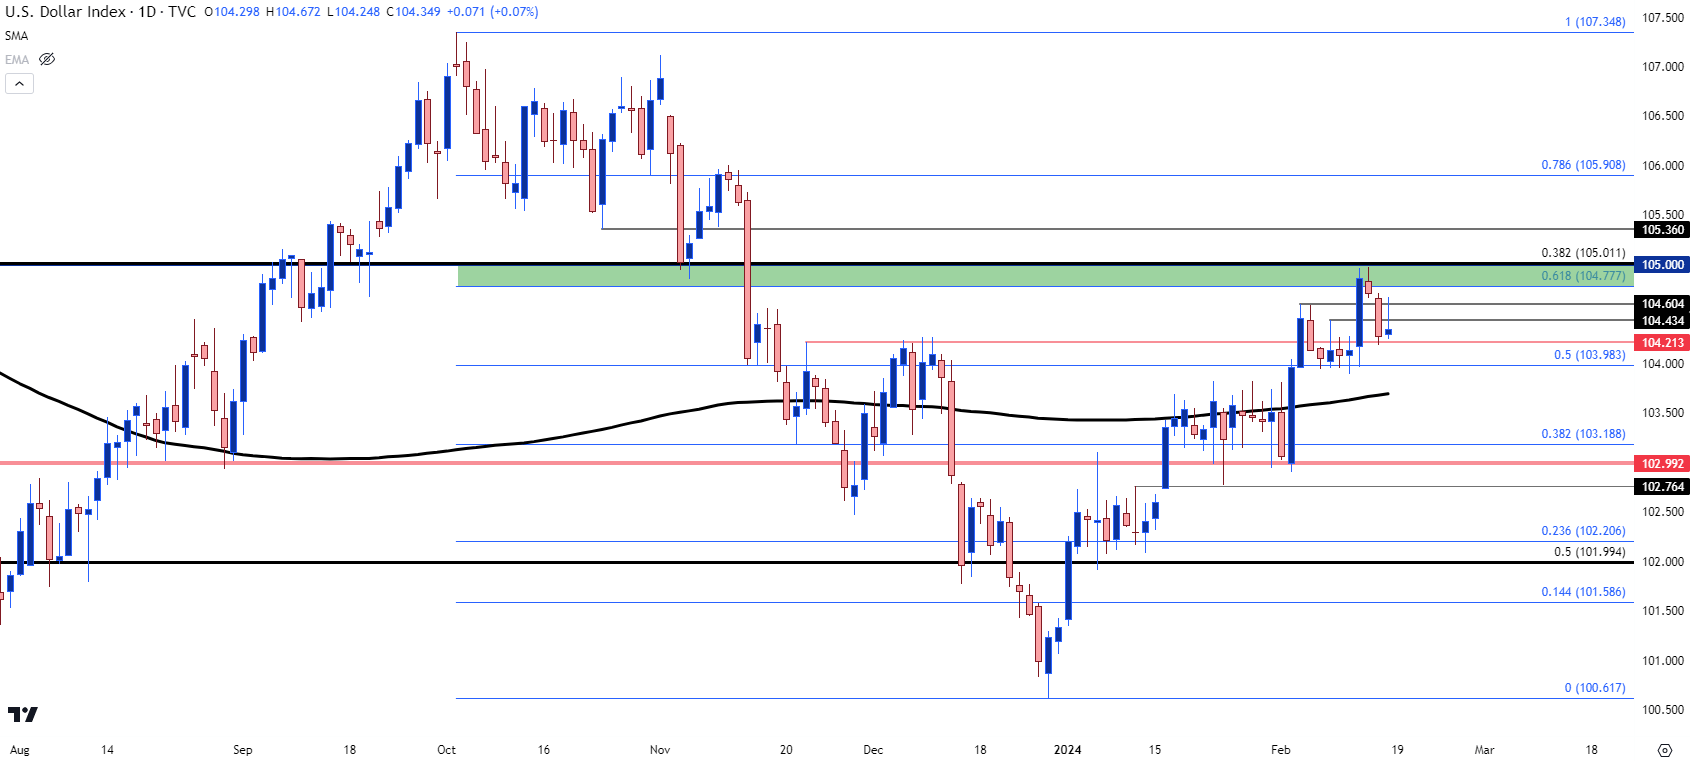 Chart prepared by James Stanley; data derived from Tradingview
Nasdaq 100
As the USD spike set up after CPI, risk assets showed a pullback and for the Nasdaq 100 there haven’t been many of those over the past few months. A bullish trendline connecting October and January swing lows came into play shortly after the U.S. open on Tuesday morning, following that CPI print. At the time, the trendline was confluent with a prior resistance-turned-support swing at 17,569 and bulls jumped in to hold the lows.
But it wasn’t until the morning after, helped along by those comments from Austin Goolsbee, that buyers were able to push another break while making a run at the prior highs.
Nasdaq 100 Futures Four-Hour Chart
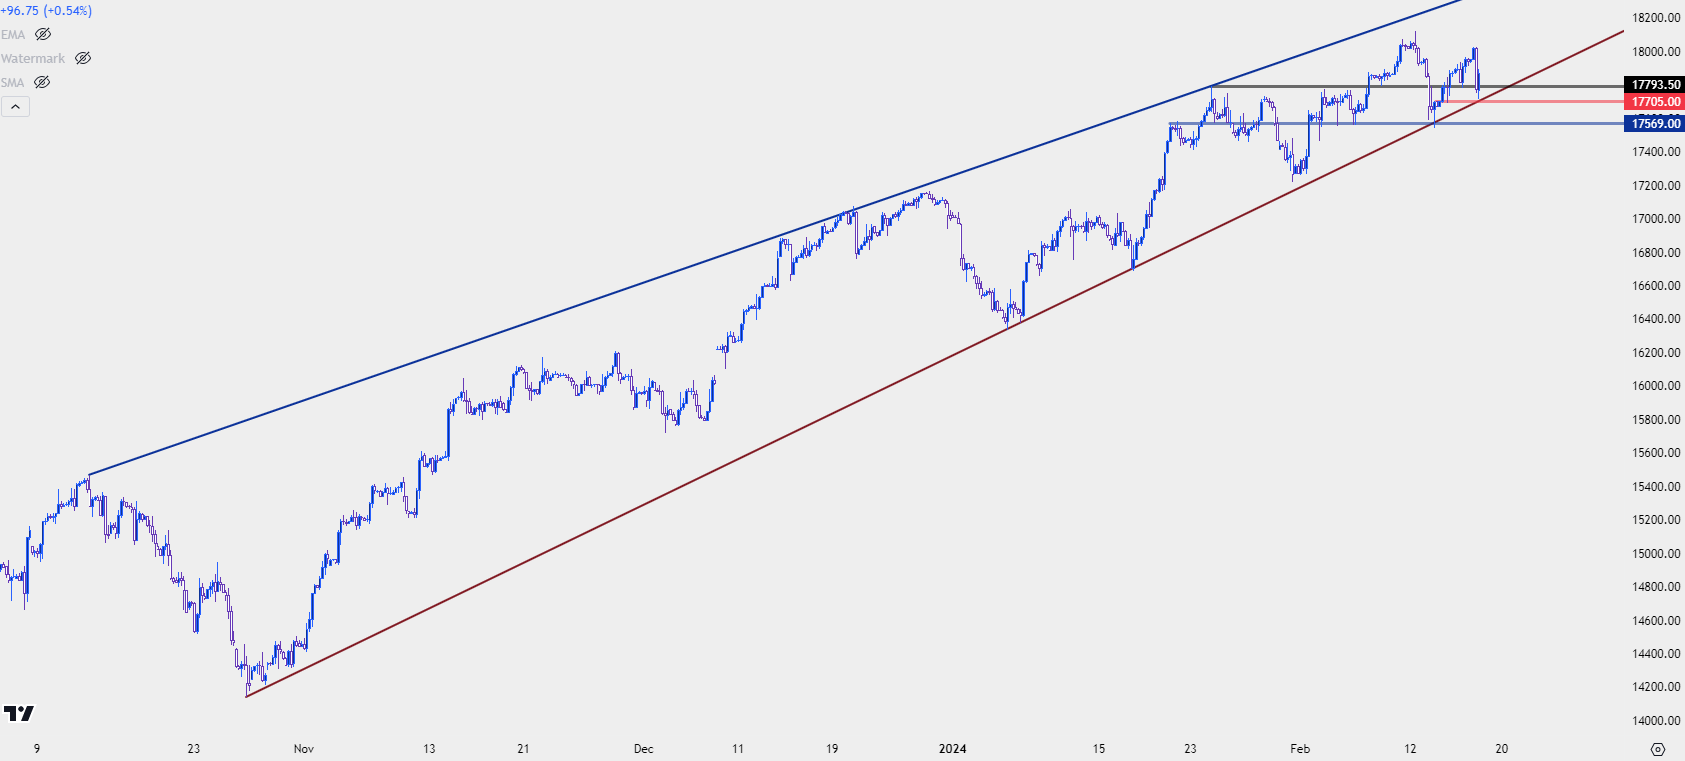 Chart prepared by James Stanley; data derived from Tradingview
Equity Rally
As I had written in the 2024 forecast for equities, I continue to expect support from Fed commentary until or unless they have little choice. Given the state of global markets, with worry in China and Europe along with Japan recently going into recession, hawkish talk from the U.S. Central Bank could open up a host of problems that would be difficult to deal with down-the-road.
One way of tracking that theme is by following the high-flyers that have driven through much of the rally, which would be AI stocks here. While the Nasdaq got a pullback and a support hold around the CPI print, the move in NVDIA was intense, as there was a quick pullback below the $700 handle after the Tuesday open but that only lasted for about 10 minutes as buyers jumped on the bid.
A situation like that can be an excellent show of sentiment as seemingly ‘bad news for stocks’ was shrugged off very quickly. At this point, NVDA has an ascending triangle formation which keeps the door open for bullish breakout potential. On the below chart you can see the rather intense response after CPI highlighted in green.
This will be in the spotlight next week when NVDA reports earnings.
NVDA Two-Hour Chart
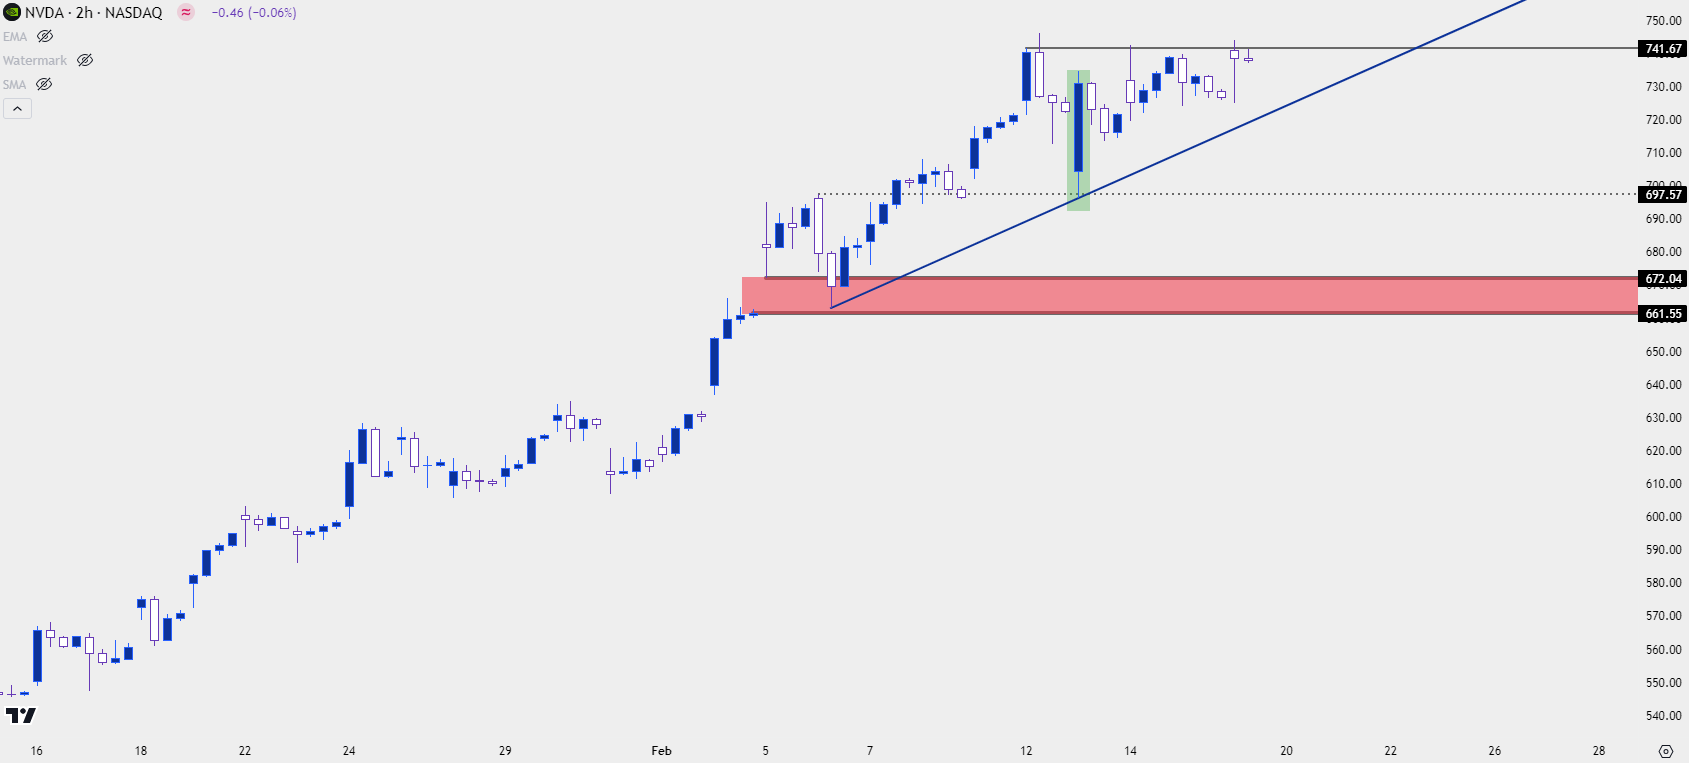 Chart prepared by James Stanley; data derived from Tradingview
--- written by James Stanley, Senior Strategist


