
Nasdaq, SPX, Treasuries Talking Points:
- It’s been another big week for Treasury Yields as the 10-year touched 5% for the first time since 2007.
- The short-end of the curve saw the 2-year touch 5.25% before starting to pullback, and the 30-year set a fresh 15-year high at 5.15%.
- Rates are rising as US economic data remains strong and the Fed has had to decrease their expectations for cuts next year. But when the Fed does finally signal that hikes are finished and cuts are on the way, will equities be free to fly-higher or might there be a rising opportunity cost that could diminish the attractiveness of equities? And is this playing a role already as equities remain on their backfoot even as bond prices fall?
- I’ll be discussing these themes in-depth in the weekly webinar on Tuesday at 1PM ET. It’s free for all to register: Click here to register.
It’s been a massive week for Treasury yields. This continues the ramp that got a shot-in-the-arm at the September FOMC rate decision, with this week getting a boost from Chair Jerome Powell at a speech on Thursday.
Some highlights of note: The 10-year touched 5% for the first time since 2007.
US 10 Year Treasury Yields Monthly Chart – Touch at 5% (indicative only)
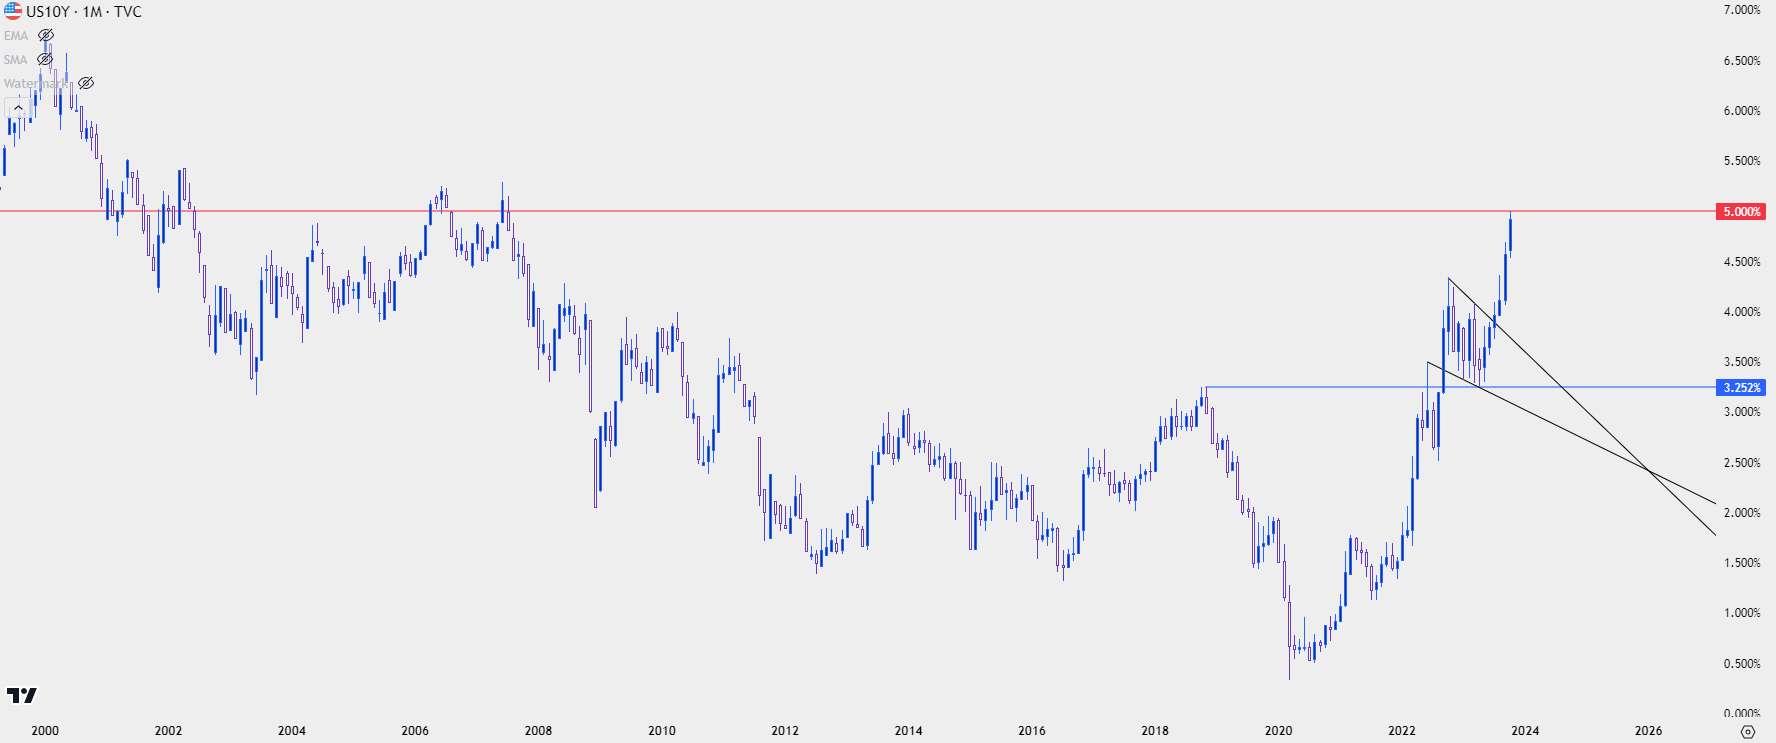 Chart prepared by James Stanley; data derived from Tradingview
Yields on 30-year Treasuries touched their own fresh 15-year high at 5.146%, showing a very similar spike as the 10-year above.
US 30 Year Treasury Yields Monthly Chart (indicative only)
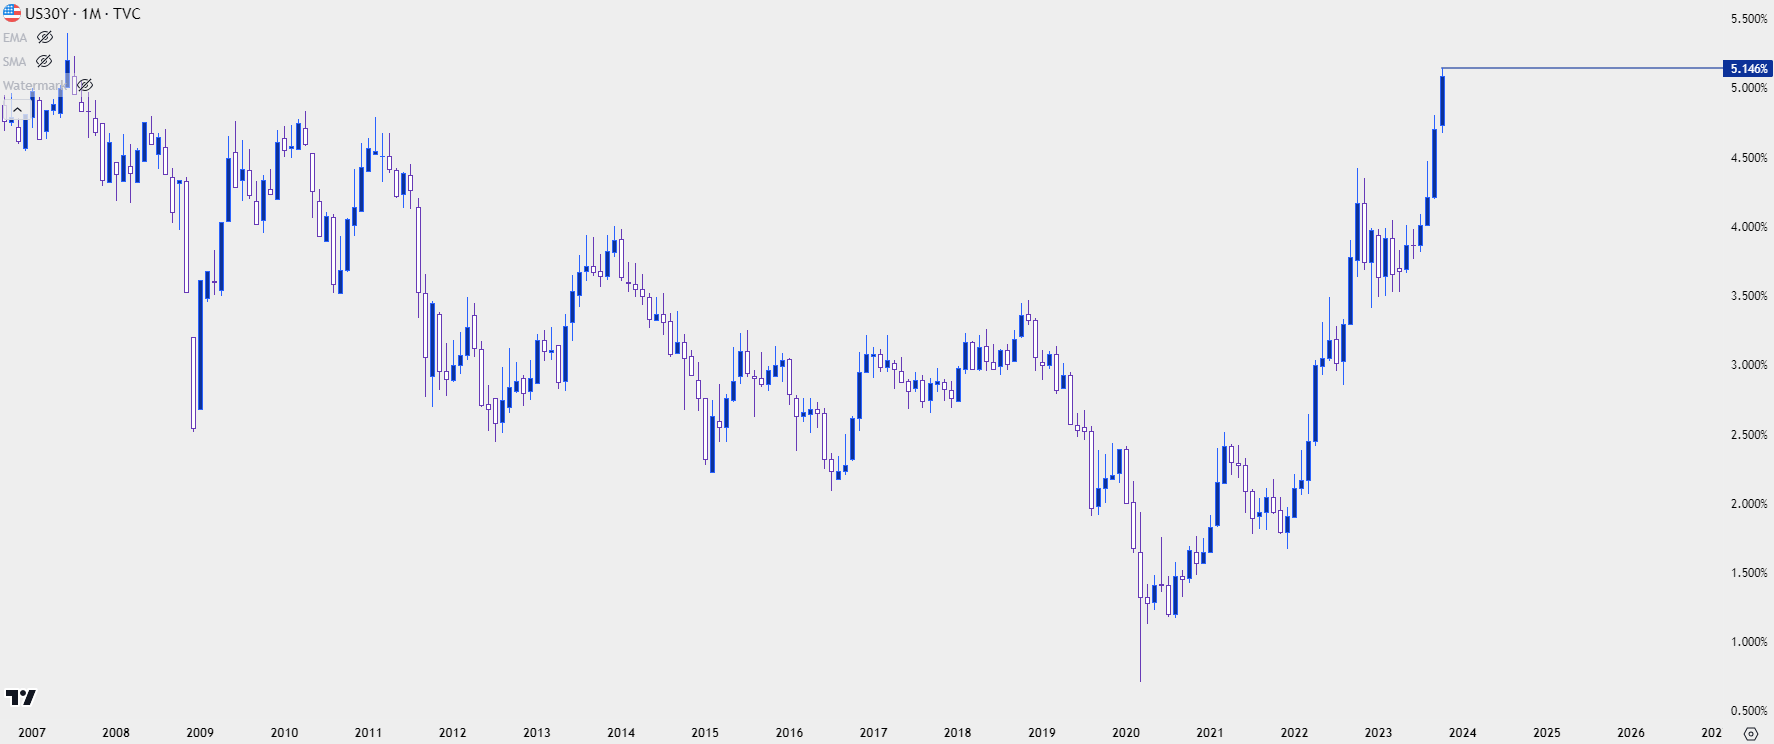 Chart prepared by James Stanley; data derived from Tradingview
The short-end of the curve, interestingly, appears to have found a more active response as the 2-year touched 5.25% and as you can see from the monthly chart below, technically, yields are now negative for the month. That 5.25% test happened briefly on Thursday morning, after which buyers responded and that’s so far helped to push yields back-down, below the monthly open.
This is of interest as we begin to take a closer look at stocks below.
US 2-Year Treasury Yields Monthly Chart (indicative only)
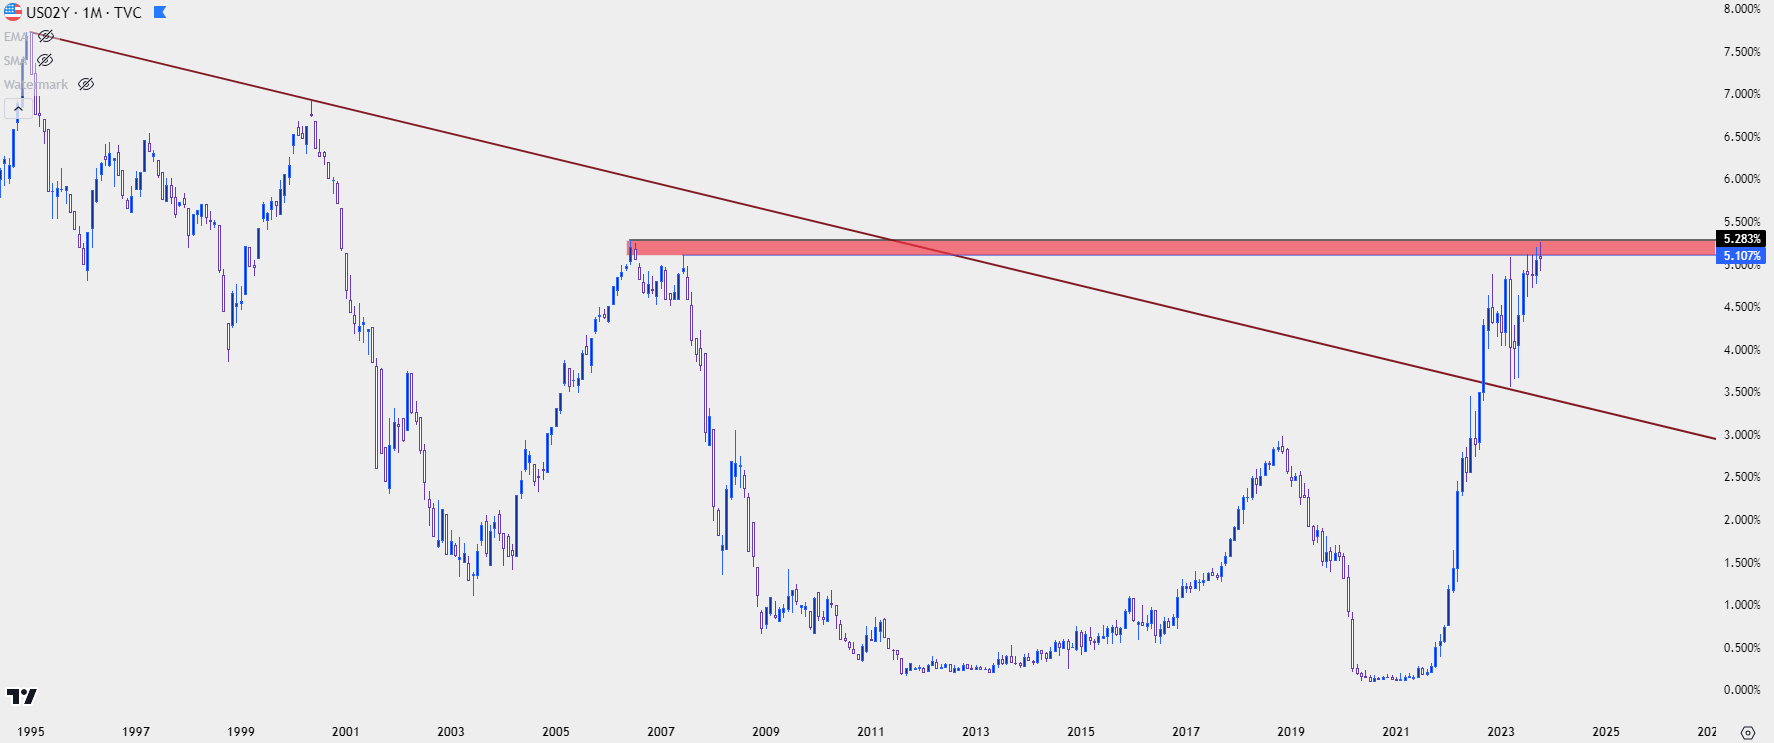 Chart prepared by James Stanley; data derived from Tradingview
Will Rate Cuts Draw Capital Flows to Bonds?
Low rates can be seen as beneficial for equities for two reasons: Not only do they make the backdrop more friendly for corporates, as companies can borrow at lower rates, but it also creates a lessened opportunity cost for investors. Investors will normally investigate some element of asset allocation in their portfolios amongst both stocks and bonds; with stocks serving as the generally lower-risk, more stable part of the portfolio while equities usually provide the growth kicker. The generally higher levels of volatility in equities can often be offset to some degree by the stability in the Fixed Income portion of the portfolio, so as investors grow closer and closer to retirement, the allocation towards the safer but lower yielding bonds will often increase, with the allocation towards risker but higher-growth potential equities decreasing.
One of the drives from the low rates that permeated markets after the Financial Collapse was that investors were disincentivized away from bonds and towards stocks. Because bonds were carrying such low yields that they weren’t all that interesting, and the other side of low rates was that the operating backdrop for corporates was more forgiving and that could allow for continued outperformance in equities. This created historic bull markets that the world has become accustomed to in equities after the past 14 years of central bank support and accommodation.
This was good and fine for much of the time since the GFC, but as inflation began to lift in 2021 another problem began to show, and that was the fact that the Fed may have to unsettle the bond market in effort of containing inflation.
That’s been the case for much of the past eighteen months after the Fed began hiking in March of 2022. As rates lift, bond prices fall as investors demand a higher rate of return to buy bonds. Why would any investor buy a 2% coupon in a 4% environment? They probably wouldn’t, so for an investor to sell that bond with a sub-standard coupon rate, they’ll have to price it at a discount which would make the total return roughly equivalent to 4%.
This is what explains the precipitous fall in TLT, the Exchange Traded Fund covering Treasuries with 20+ years of maturity. This has hit a fresh 15-year low, which goes along with the fresh 15-year highs that we’ve seen in yields on the above charts. A couple of important notes: TLT is now 53.57% from its high in March of 2020, and 46.22% below the high from December of 2021. This is a massive movement in a bond-based ETF that was largely being pushed by the effect of rate hikes.
TLT – 20+ Year Treasury ETF (indicative only)
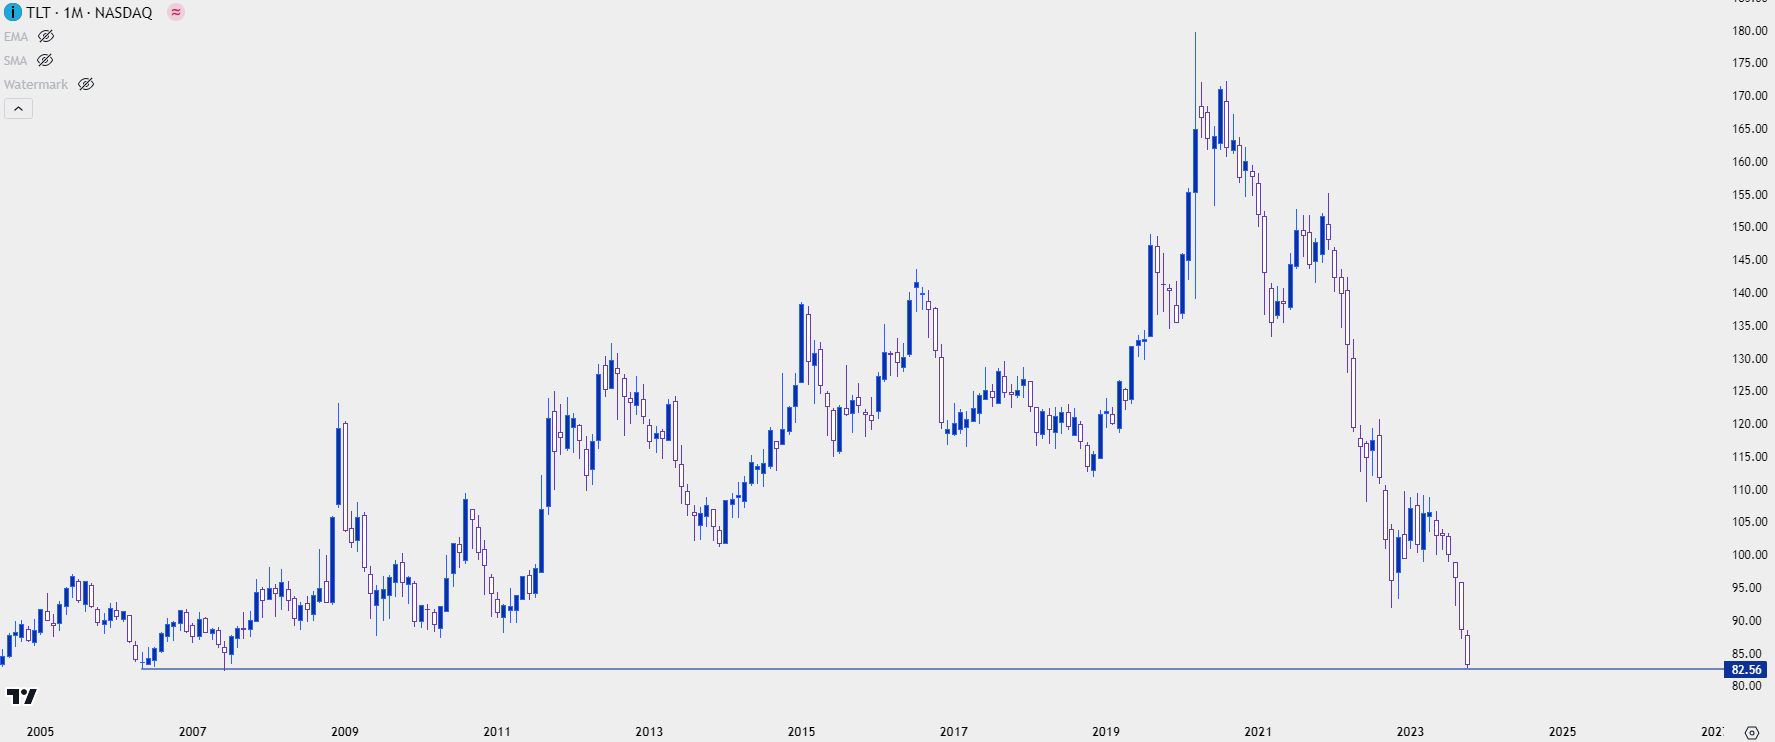 Chart prepared by James Stanley; data derived from Tradingview
Falling Rates Can Bring a Bull Market in Bonds
When rates fall, the coupons on current debt will be quite attractive. As noted above for a rising rate environment, market participants are unlikely to pay market rates for below-market coupons or rates of return. The opposite also holds true, where bond prices can appreciate in a falling rate environment, very similar to what we can see on the left side of the above chart.
Not only can investors lock-in yields at higher rates ahead of those rate cut announcements, but they also have the opportunity to see the principal portion of the bond appreciate on the back of that falling rates dynamic.
In essence, a falling rate regime presents a trade opportunity for market participants, and they can, in essence, treat fixed income in a manner more like equity investments, looking for the principal to gain on the back of market themes after which the bond can be sold for a capital gain. The big question is when rate cuts might begin. And that’s the question that market participants continue to ponder as the Fed has highlighted the possibility of cuts beginning next year.
Can Falling Rates, Rising Bond Prices Draw Capital Away From Stocks?
While most investors seem to consider low rates as a positive for equities, the actual act of rates falling may be less supportive as there’s legitimate opportunity cost. When we’re in a low-rate environment for years on end, investors are continually motivated to take on more risk in their portfolio and this even seemed to be part of the design of the Fed’s strategy of low rates and QE, helping to keep yields low which made the idea of allocating more of the portfolio to fixed income as a risky idea. Risky – because when or if rates rise, that fixed income portion of the portfolio is vulnerable. As we saw above, TLT has moved down by roughly 50% from its highs, and that doesn’t make for a very attractive investment case.
This is precisely the same type of thing that started to hit banks in March, as they were holding so much duration in their portfolios that lower bond prices from rising rates put them in a precarious position, which they’re likely still in today to some degree as rates have continued to rise.
The big question for next year is whether a well-telegraphed shift from the FOMC from their current hiking stance and into cuts will drive capital out of equities and into bonds. To be sure, this is the opposite effect that we saw in March, when falling rates on the back of risk in banking helped to buoy stock prices, and that theme of equity strength hung around into the August open. But that didn’t come with a pivot announcement from the Fed, as the bank merely skipped hiking at a couple of meetings after banking risk came into the picture.
When the bank does finally signal that they think that rate hikes are done – and that the next move may be a cut, this can create demand in bonds, particularly on the short-end of the treasury curve, and that can begin to lift bond prices and sink bond yields.
Equities on their Back Foot
So with stock prices facing headwinds since the August open, is this investors preparing for what’s next? Or is this merely the pricing in of additional uncertainty after a very strong rally to begin the year?
That remains to be seen and the pullbacks in stocks over the past couple of months have certainly been notable. But that must be considered with the prior run-ups, as the Nasdaq retains a bullish posture on weekly and daily charts, and there can even be a bullish case to be made for the S&P 500.
The Nasdaq 100 is currently showing a falling wedge formation which is taking on the form of a bull flag, with somewhat orderly consolidation after the print of a fresh high a couple of months ago. There’s a longer-term zone of support around the 14,500 level on the index, and if buyers can hold that zone, the door could remain open for bullish scenarios. A breach of the 38.2% retracement of this year’s bullish move would start to bring more question as the falling wedge formation probably would’ve been negated at that point and this would show a greater effect from bears taking a toll in near-term price action.
This becomes a big spot for next week, which will lead into the next FOMC rate decision in the week after, scheduled to be announced on November 1st. Falling wedges are generally tracked with aim of bullish reversal, and if that support can hold, bulls can retain a positive bias.
Nasdaq 100 Weekly Price Chart (indicative only)
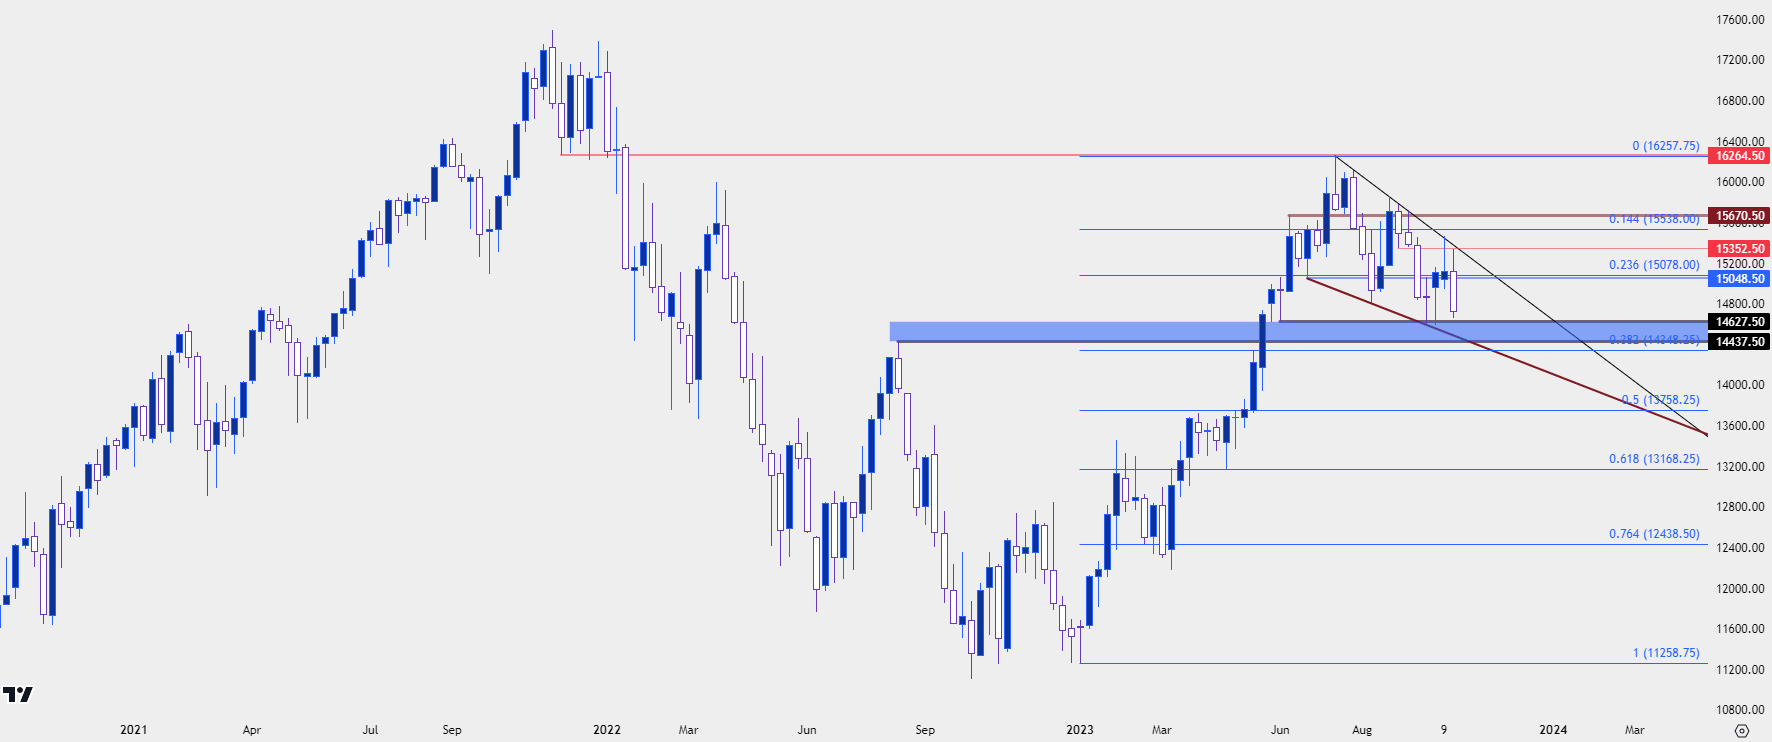 Chart prepared by James Stanley; data derived from Tradingview
S&P 500
At this point, the S&P 500 has a similar long-term setup that retains bullish potential with prices holding in a bull flag formation. This can change, of course, but it also highlights the fact that the pullback that started in August has been but a portion of the larger bullish run that began last October.
Bears are testing below a big spot on the chart, with bears pushing back-below the 200-day moving average yesterday. This highlights the lows that were in-place earlier in October, around 4235. And below that at 4204 is the projected support from the double top formation that triggered after the FOMC rate decision last month.
For next week, that support zone could come into play with the bull flag remaining in-place, but buyers would need to show a response to that support in rather quick fashion or else the formation would risk being nullified.
S&P 500 Daily Price Chart (indicative only)
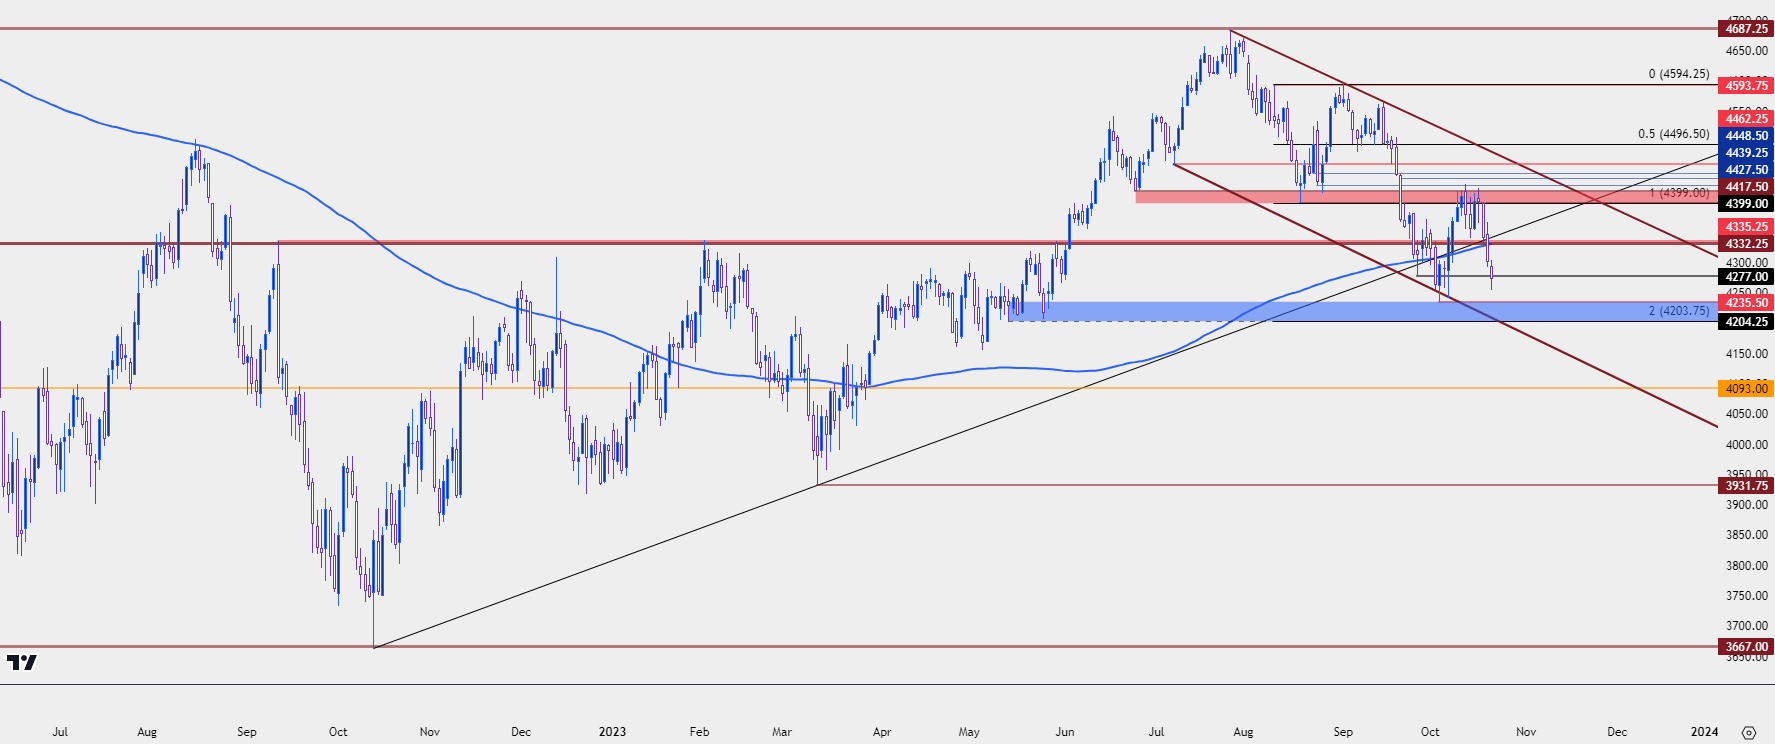 Chart prepared by James Stanley; data derived from Tradingview
Are Equities Vulnerable Next Year?
This is the big question for stocks and it may even be something that’s playing a role in the current pullbacks that are showing in equities. But with the Fed highly expected to begin cuts next year, this could prod a bit of motivation to bonds, at some point, which could in-turn bring some impact to equities. The thought should at least be entertained, but it must be qualified to some degree.
If there’s anything that this year has taught us, and the Fed, it’s the fragility of projections. Chair Powell has opined on this in practically every press conference, but there are no assurances that we will see rate cuts next year and after the recent tweaks the Fed’s projections that remains an unknown variable. We have seen markets beginning to position for rate cuts, as evidenced by the pullback in yields in March. But this did not play through as inflation has not cooperated and elsewhere, US economic data has remained quite strong.
With yields shooting higher, there’s still no sign that the move in bonds is yet finished so traders would probably want to keep an open mind here. This is showing uncertainty in the market specifically behind those projections, and investors generally address uncertainty with paring risk. But even the announcement of rate cuts may be initially cheered by equity investors and that would remove a hindrance from corporates, who are now forced to operate with higher rates and a less-friendly operating environment. The Fed removing some of that pressure could be a positive, in that regard.
The bigger question is whether asset allocation and rising bond prices will begin to draw capital investment away from stocks, who haven’t really had to compete with bonds and a falling rate regime for quite some time.
--- written by James Stanley, Senior Strategist


