Mexican Peso Talking Points:
- USD/MXN continues to show signs of bullish reversal, jumping to a fresh six-month high earlier today.
- I looked into the matter last month as bulls started to show a larger presence in the pair. Initial signs of reversal were starting to show with a higher-high and that has since extended with a higher-low leading into a push to another higher-high.
- The bullish trend stretched this week in a big way, with USD/MXN showing its largest weekly gain since November of 2021. This, combined with confluent resistance showing around highs, could make for a difficult backdrop to chase. There is, however, multiple spots of interest for higher-low support to show if bulls are to continue to the trend.
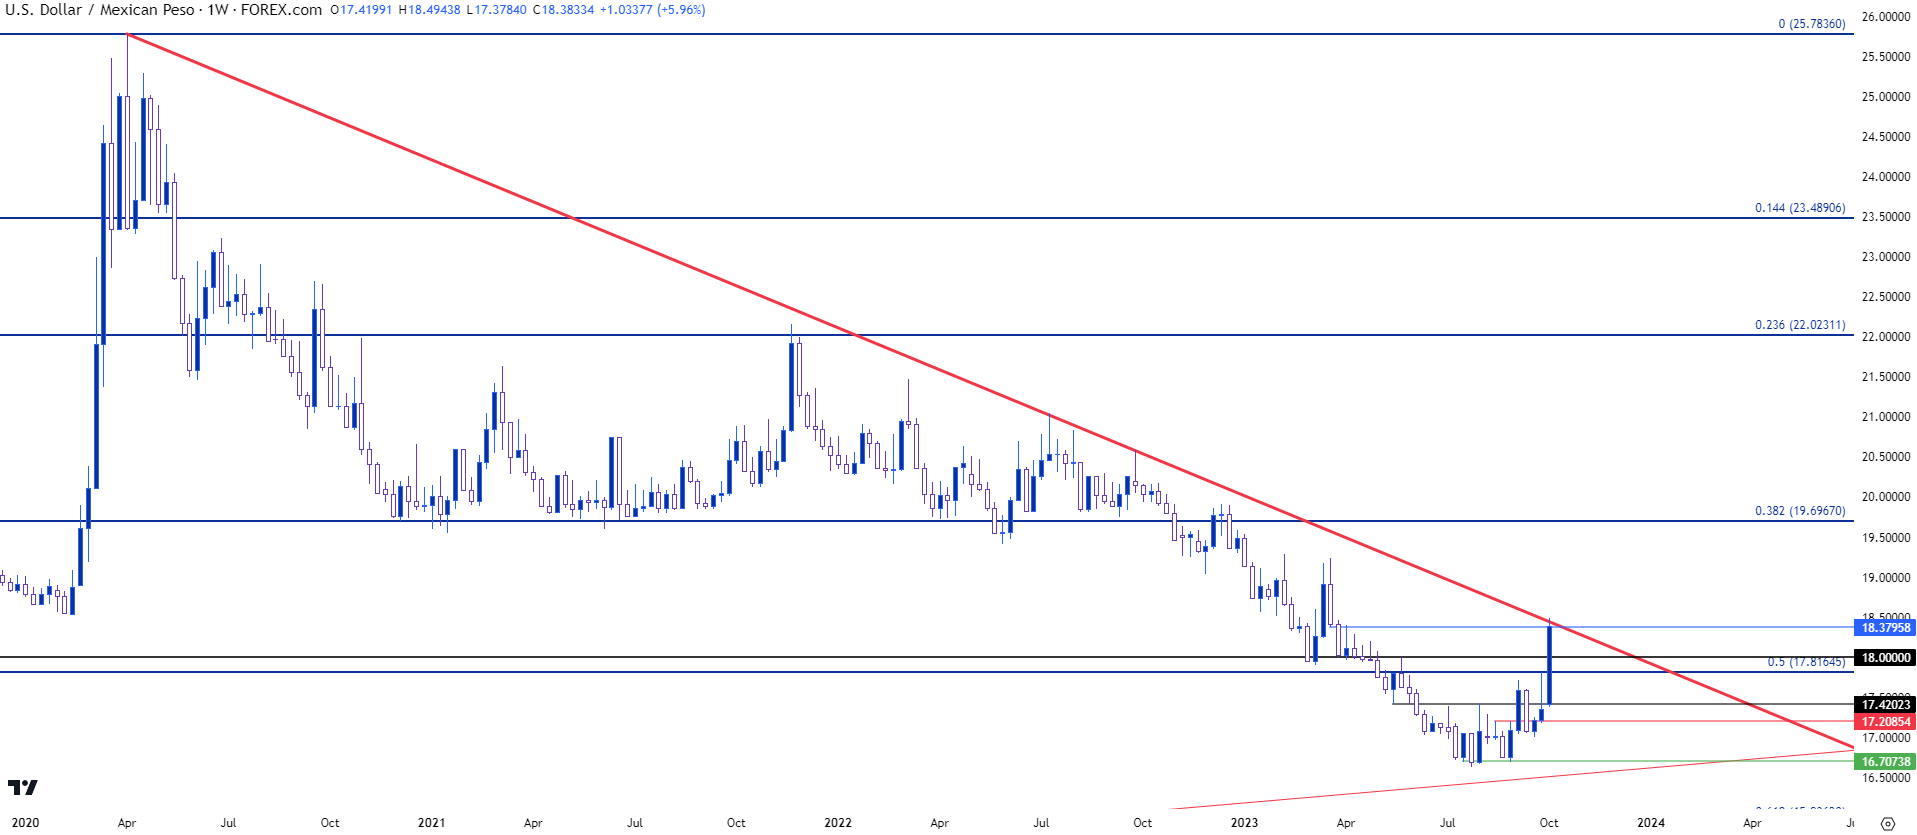
USD/MXN continues to show evidence of bullish reversal. Last month I asked whether the tide was turning in the pair and now that we’ve entered Q4 trade there’s been continued evolution in that theme. At this point the pair is trading at a fresh six-month high and testing a trendline that has guided the pair lower ever since the highs were set in April of 2020.
USD/MXN Weekly Chart

Chart prepared by James Stanley, USD/MXN on Tradingview
USD/MXN Daily
Last week the pair held resistance at a key spot: The 50% retracement of the long-term move that started in 2008 and ran until the high was established in 2020. That led to a pullback into last week’s close, which helped to establish the most recent higher-low as prices jumped to start this week’s trade.
And the breakout has been at fever pitch, with USD/MXN showing its largest weekly gain since November of 2021. There’s also the issue of confluent resistance, as price is also testing the swing level that I had highlighted last month at 18.3795.
This could urge caution from chasing as a really big move has made an advance to a confluent area of resistance, which could lead to some motivation for profit taking. It also highlights some possible areas for higher-low support to show if bulls are to continue the trend, such as the same 17.8165 level that was in-play last week as resistance. If bulls don’t allow for a pullback to run that deep, there’s also the 18.00 handle that could remain of interest for higher-low support, as this price had held a resistance inflection in May and since price broke above that level earlier this week, there hasn’t been much for support tests.
USD/MXN Daily Price Chart

Chart prepared by James Stanley, USD/MXN on Tradingview
--- written by James Stanley, Senior Strategist


