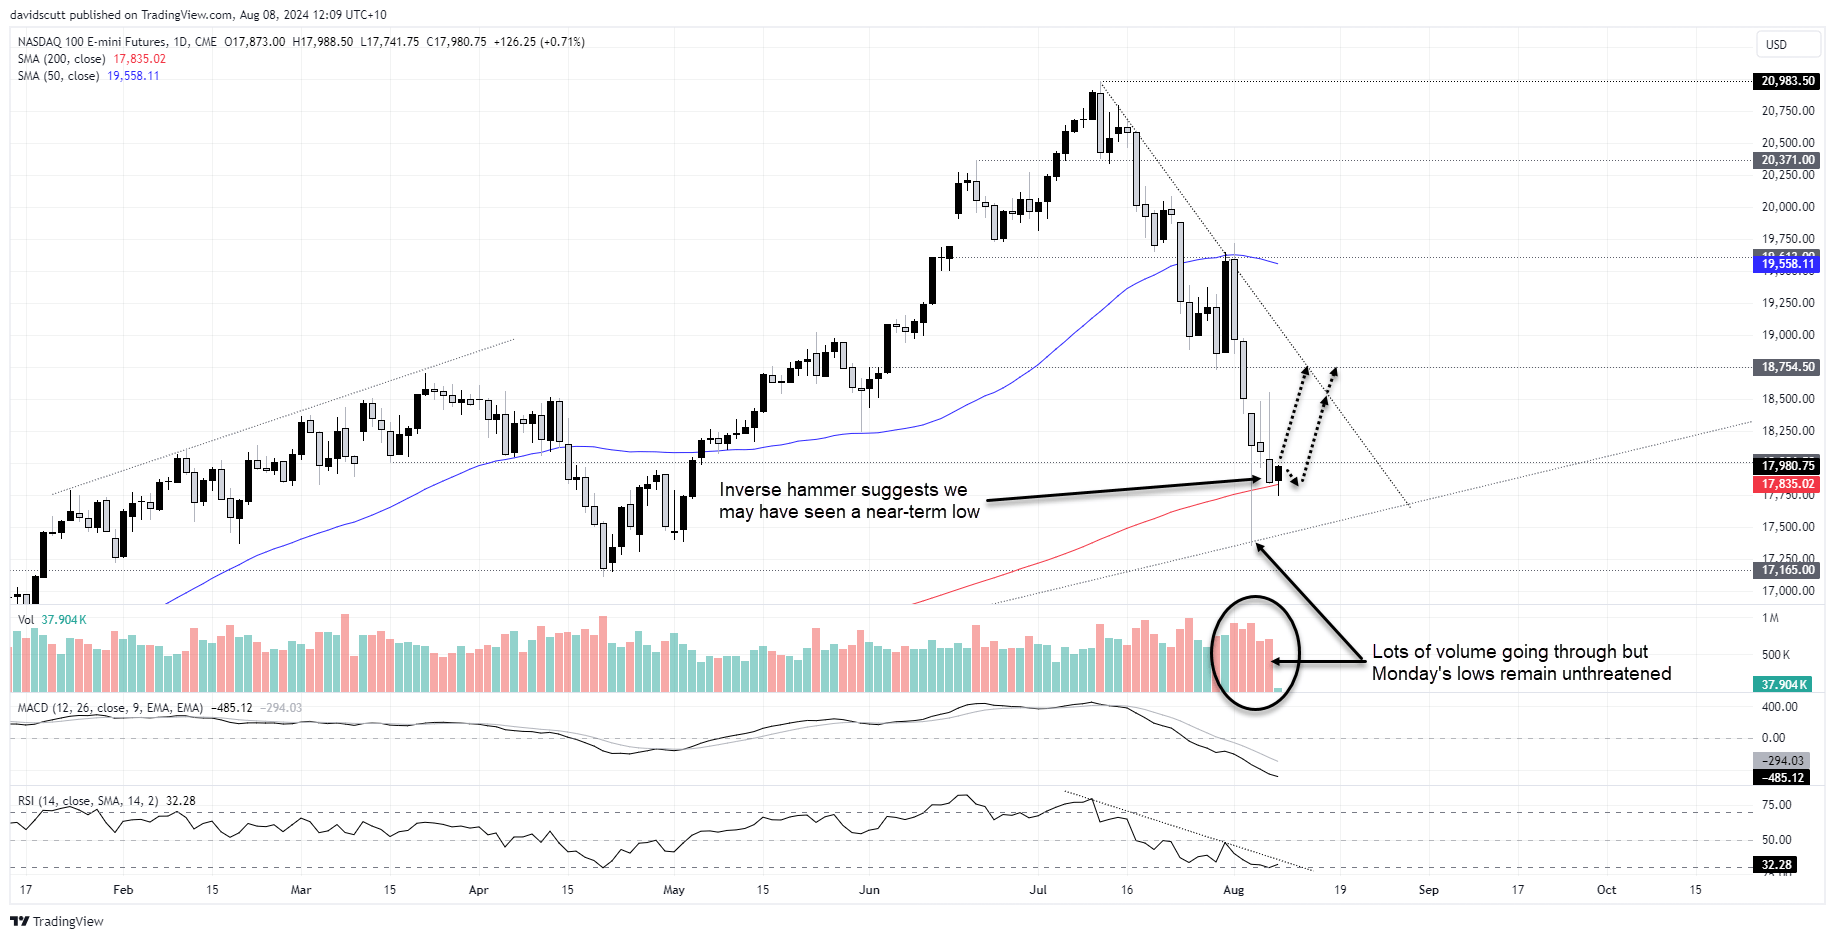
- US stock indices see plenty of selling pressure but are yet to take out Monday’s lows
- Both S&P 500 and Nasdaq 100 futures printed inverse hammers on Wednesday’s daily candle
- Risk management, position sizing is key in these whippy markets
- Perceived US recession risk likely to influence near-term performance
Everyone knows it’s been a tough period for the S&P 500 and Nasdaq 100. But substantial moves in one direction rarely last long, especially when they occur quickly. With bulls successfully defending Monday’s lows despite significant selling pressure, and with price signals on Wednesday hinting we may have seen a near-term bottom, long setups may be worth pondering. Just remember to keep risk management and positioning sizing at the forefront of your thinking.
S&P 500 futures may settling into new range
S&P 500 futures have absorbed plenty of selling pressure over the past few sessions but are yet to take the lows struck on Monday. While that doesn’t mean they won’t, it looks like futures may be settling into a new sideways range between 5350 on the topside and 5154 on the downside. Granted, the latter is only a minor level that was breached in the peak of the market puke on Monday, but the dip was bought aggressively below the level. The inverse hammer candle on Wednesday is another signal that we may have seen a near-term bottom.
While signals on momentum like RSI (14) and MACD point to downside risks, sitting near the bottom of the newly established range, a long setup could be on the cards if we see risk-reward of the trade improve. It’s not a high probability setup, so if we’re going to go against the trend, we don’t want to be risking a lot.
Pullbacks towards 5154 offer one entry point, allowing for a stop to be placed below Monday’s low for protection. The trade target would be the top of the range at 5350. Those wishing to get in now could do so with a stop below 5154 for protection. Targets would be the same.

Nasdaq 100 finds buyers beneath 200DMA
The setup is not dissimilar for Nasdaq 100 futures with bulls successfully absorbing plenty of selling without Monday’s lows being threatened. The difference is we have more certainty about levels with the price bouncing off long-running uptrend support on Monday. Buying has also been noted beneath the 200-day moving in Asia, a noteworthy development after the inverted hammer candle print of Wednesday.
Like S&P 500 futures, signals from MACD and RSI (14) remain bearish on the daily timeframe, although there are signs RSI may be in the process of troughing as it approaches a test of the downtrend it’s been in since the record highs.
There are a couple of options for those looking to take on the long trade.
One is to buy here with a stop below today’s low for protection against reversal. Wednesday’s high above 18550 would be the initial target with 18754.50 the next after that. For those with more patience, waiting for a potential pullback to the 200-day moving average is another option, allowing for a stop to be placed below today’s low or the uptrend the price bounced off on Monday. Targets would be the same as those above.

Economic sentiment key to trade performance
From a fundamental perspective, Thursday’s US jobless claims data may be influential on the trades with a stronger-than-expected outcome likely to ease concerns about the US economic trajectory, and potentially the outlook for corporate earnings. Next week has plenty of catalysts that may influence perceptions about whether the US is entering recession, including CPI, PPI, retail sales, industrial production and several regional Fed activity surveys.
-- Written by David Scutt
Follow David on Twitter @scutty


