
LIVE ELECTION ANALYSIS
from our Global Experts
Find out how the election is moving markets as results come in.

As the results roll in, our team of global analysts will share their insights on how the market is responding to key developments.
November 7, 2024
Time to wrap it up, thank you for joining us!
James Stanley 11:10 ET (16:10 GMT)
With results almost completely tallied it looks like Republicans have secured a supermajority with the Presidency and both the House and Senate under control. House votes are still being tallied and it’s possible for a last-minute surprise but, at this point, if there was a surprise, I think it would stoke volatility to a degree where the market reaction would become an entirely ‘new thing.’
As such, we’re going to wrap up this live blog, and I wanted to do a re-cap before we conclude. But first, I want to thank you for your time.
This was a first for us as an analyst team and I don’t think it’ll be the last as the results seem positive all-around. Speaking for myself, I enjoyed sharing this election with our readership and I think that echoes the sentiment from the rest of the team. And we hope that it brought you value and that you were able to see the election through a market lens as we often try to do.
The positive news for traders over the past few days is that markets look set for continued volatility and, as traders, analysts, and market strategists, that’s about the most that we can ask for: Opportunity. The coming days and weeks will no doubt bring change, and this will probably reflect through markets, and we’ll do our best to help our readers navigate those waters.
There’s an FOMC rate decision later today and it feels like one of the least suspenseful meetings in years. The bank is widely expected to cut and there’s still expectation that they’ll cut again in December. But it’s that meeting that’s likely the ‘big deal’ as that will be the first set of updated projections and guidance released by the FOMC since the election. At this point, there’s a 75.7% probability that the Fed cuts at least two more times next year, assuming cuts in November and December of this year. And that’s also a 47.6% probability of at least 75 bps of cuts by the end of next year.
Fed Rate Cut Expectations, Per CME Fedwatch
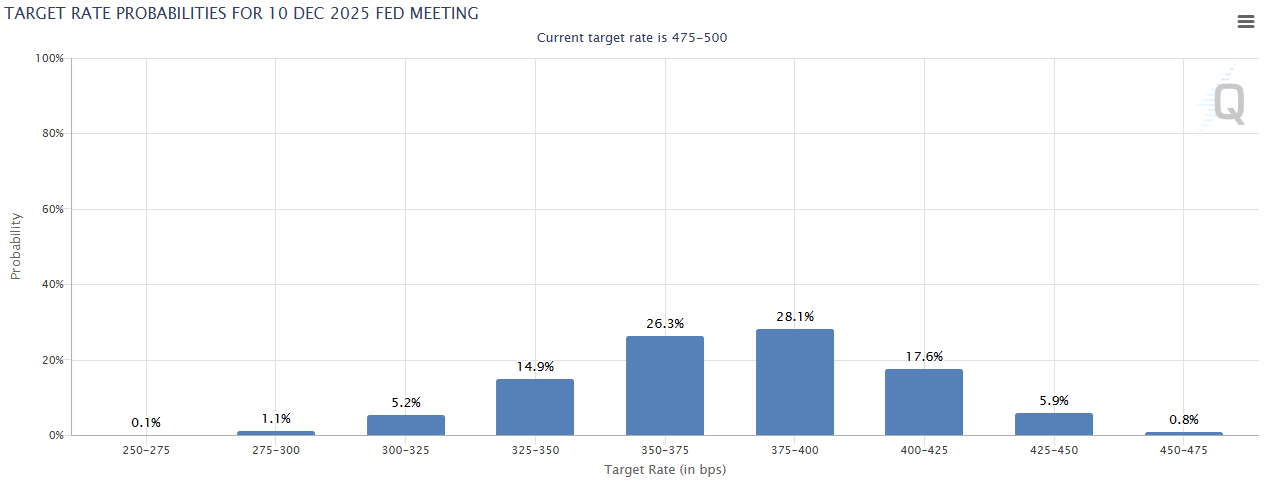
Source: CME Fedwatch
At this point, the US Dollar has been range-bound for two years and I’m expecting that to continue. The initial reaction on the night of the election was an aggressive run of USD-strength. But, if that’s to continue it could create complication from several other economic vantage points and it’s difficult to imagine that USD-strength continues to show along with higher stock prices and a continued rally in Bitcoin.
When Trump won the Presidency the first time in 2016, a similar initial reaction of USD-strength showed. And the currency continued to rally for another month as the Fed started to sound more and more hawkish. But the currency also fell for most of 2017 even as the Fed hiked three times, standing in stark contrast to the two hikes they had pushed in the previous seven years.
US Dollar Weekly Chart
Source: TradingView
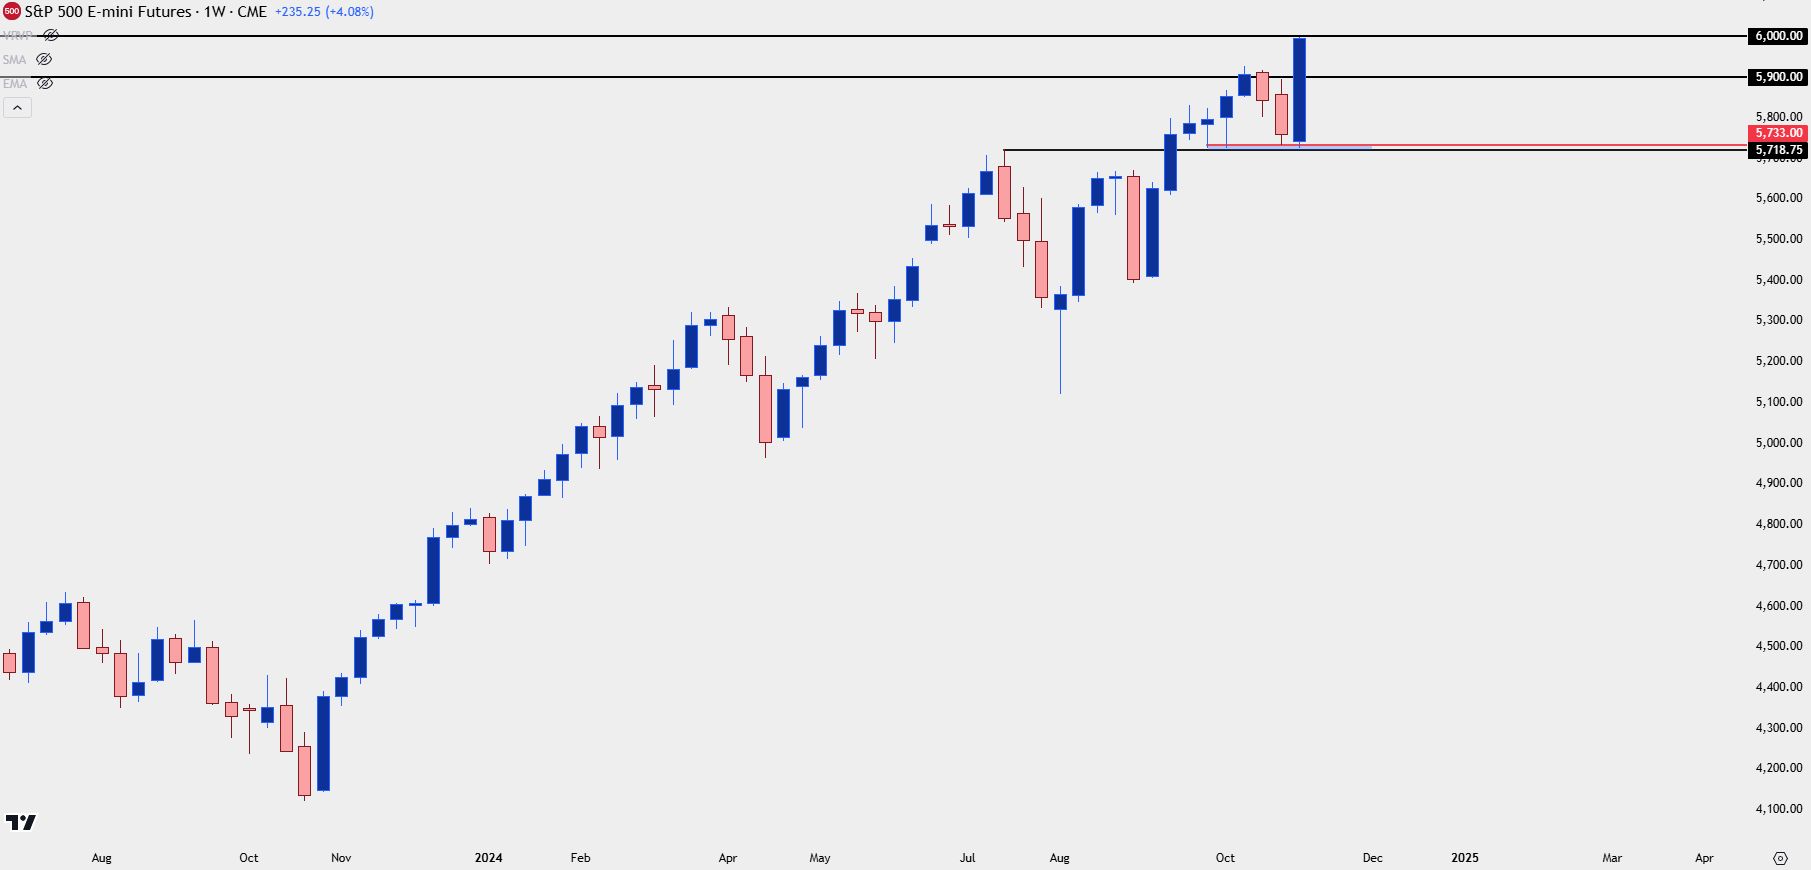
With a Republican supermajority and a currently-dovish Fed, stocks have continued to show strength. S&P 500 futures are making a fast run at the 6k psychological level and the excitement there is quite visible. That can be a difficult move to chase but, as we saw earlier in the week, patience can be of extreme value as ES had spent four days testing support into the morning of the election.
With fresh all-time-highs now in the equation, there’s several spots to look for pullbacks to find support which can allow for bullish continuation scenarios, particularly if that 6k level shows as some resistance in the near-term.
S&P 500 Futures Weekly Chart

Source: TradingView
November 6, 2024
Bitcoin the Big Winner, USD and Stocks Surge on Trump Victory
James Stanley 13:57 ET (18:57 GMT)
Kamala Harris has now conceded the election and word on social media is that she’s called to congratulate Trump on his win. Votes for the House are still being counted but at this point more and more signs are pointing to a republican majority so it looks like we may have the Republican sweep outcome with a supermajority.
I looked into this in an article on Bitcoin, Gold, the USD and stocks.I also put together a video on this, looking at the backdrop in the USD compared to Trump’s first win in 2016. In that episode, the Fed suddenly got hawkish which led to about a month of strength in DXY. The Fed hiked four times after his election win in 2016 and through 2017, with another four hikes in 2018. They over-hiked and had to cut rates three time sin 2019 but, interestingly, despite that hawkish stance at the Fed in 2017 the US Dollar spent most of the year selling off. I dug into that and quite a bit more in the video.
Increased oil drilling could weigh on WTI after Trump victory
Fawad Razaqzada 1:00 ET (18:00 GMT)
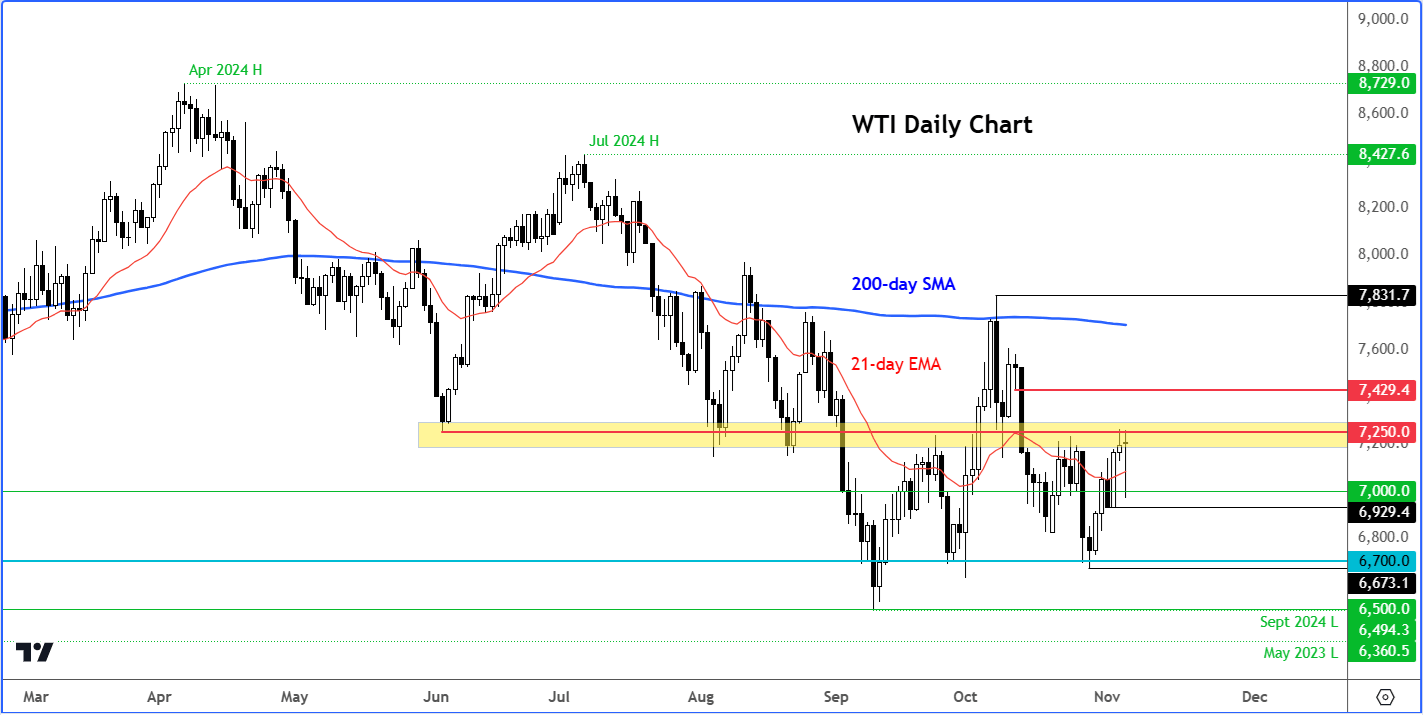
Source: Tradingview
While campaigning, Trump promised to lift restrictions on domestic fossil-fuel production, and said he plans a wide range of tariffs on imported goods. Crude oil could come under pressure because of potential for increased drilling activity could lead to more US oil production. Today, the downside has been limited so far because of the risk rally with US indices hitting record levels. But oil is more likely to test recent lows I would say, and the trigger would be if WTI breaks Friday’s low around $69.29. As well as increased drilling in the U.S., and a stronger U.S. dollar, tariffs could hurt demand in key markets such as China.
Not all races are over yet – votes for the House still being counted
James Stanley 10:22 ET (15:22 GMT)
Markets have already put in large moves on the back of Trump’s victory but the election isn’t completely over yet. At this point Republicans have won the executive branch and the Senate, but votes are still being tallied in a few key races for the House of Representatives. A Republican win here would be key for solidifying some of these market moves, particularly in Bitcoin and equities. Without a win in the house, there’s the prospect of gridlock that could encumber the administration from passing legislation.
But, at this point there is a pathway for the supermajority and Kalshi is currently showing a 91% probability of a Republican win for the House, and only a 7% probability of a win for Democrats.
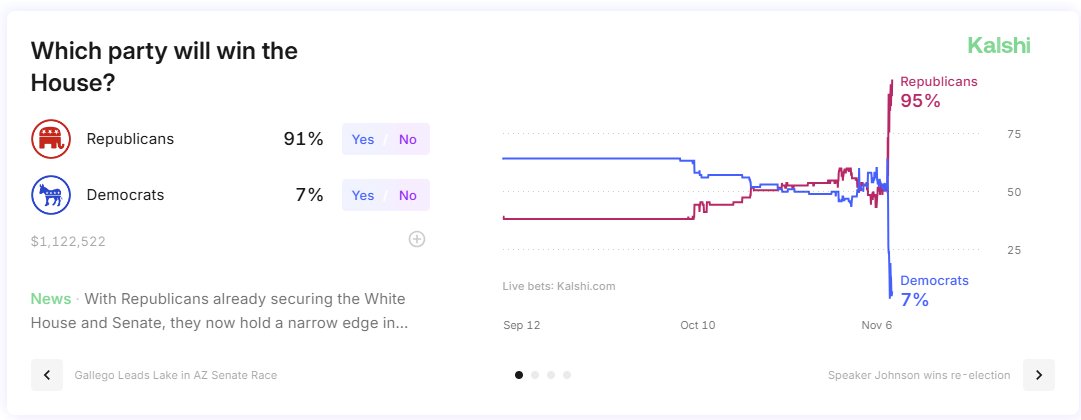
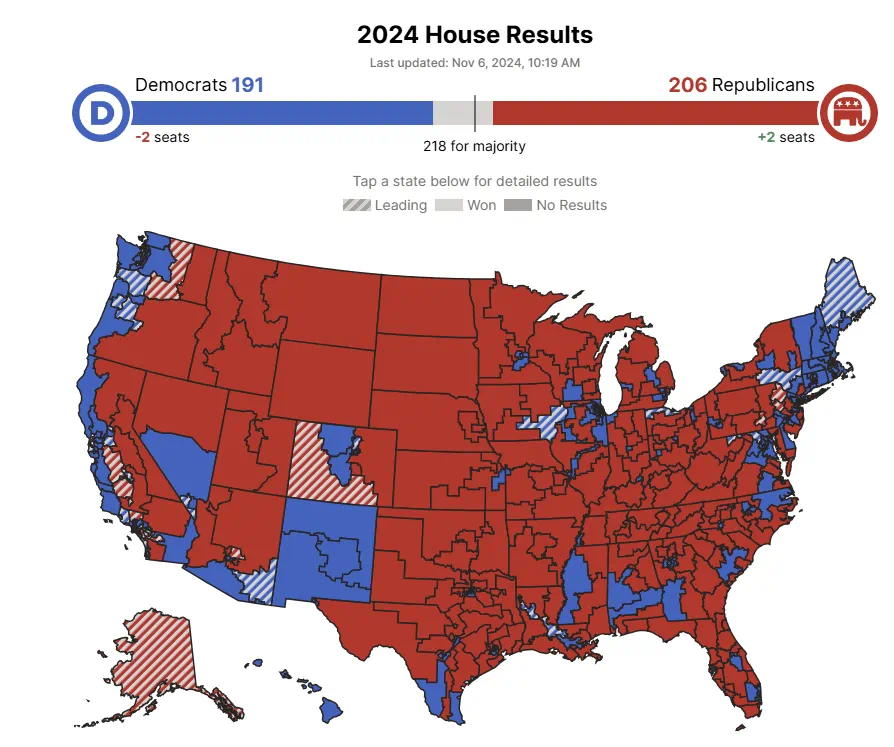
As for the actual vote tally, Decision Desk HQ currently shows Republicans with 206 seats and Democrats with 191 seats, although their projection does indicate favor towards Republicans.
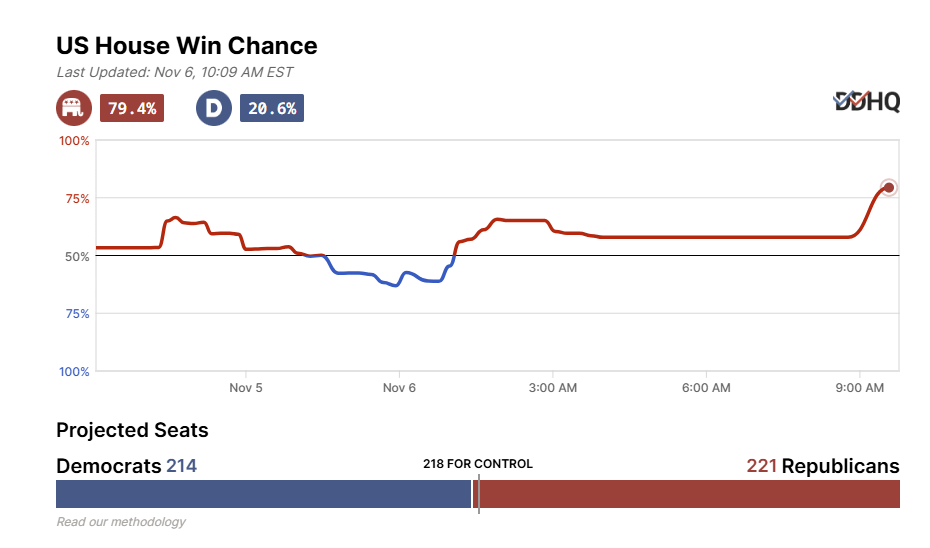
As for the projections: Decision Desk HQ is currently showing Republicans with a 79.4% probability of winning the House and Democrats at 20.6%. They’re implying a total of 221 seats for Republicans and 214 seats for Democrats.
If this result comes to fruition, I’d expect a continuation of the upward move in both US equities and Bitcoin along with a continued sell-off in gold.
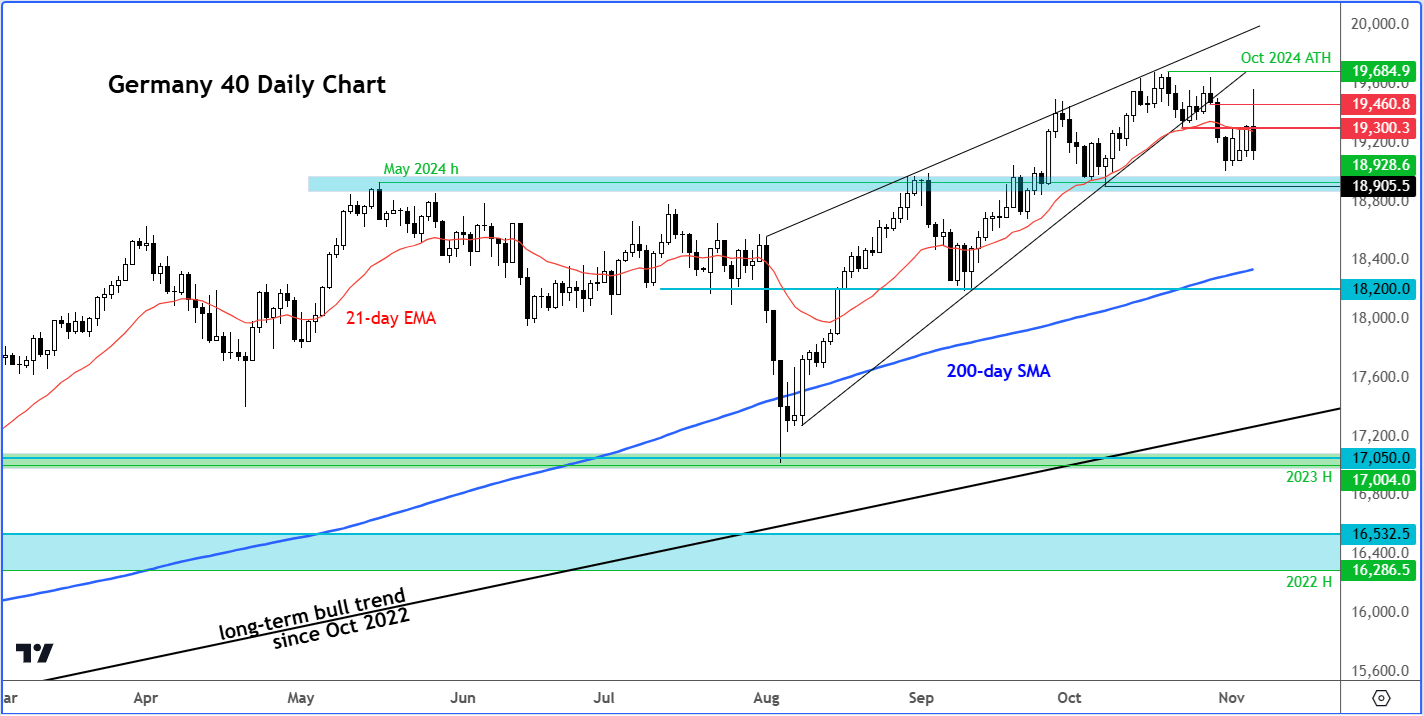
DAX among EU indices to turn lower amid Tariff concerns
Fawad Razaqzada 9:15 ET (14:15 GMT)
Source: Tradingview
European indices were higher earlier, finding support from the big rally in US index futures. But as I warned earlier, European investors are waking up to the reality that Trump’s tariffs could negatively impact European exports to the US. The threat of tariffs, the potential for a relatively tighter US monetary policy, as well as slumping commodities, are factors that are coming back to hurt the European indices, now that the dust is settling somewhat.
USD/CHF Rally Pushes RSI to Highest Since April
David Song 8:45 ET (13:45 GMT)
USD/CHF Daily Chart
Source: Tradingview
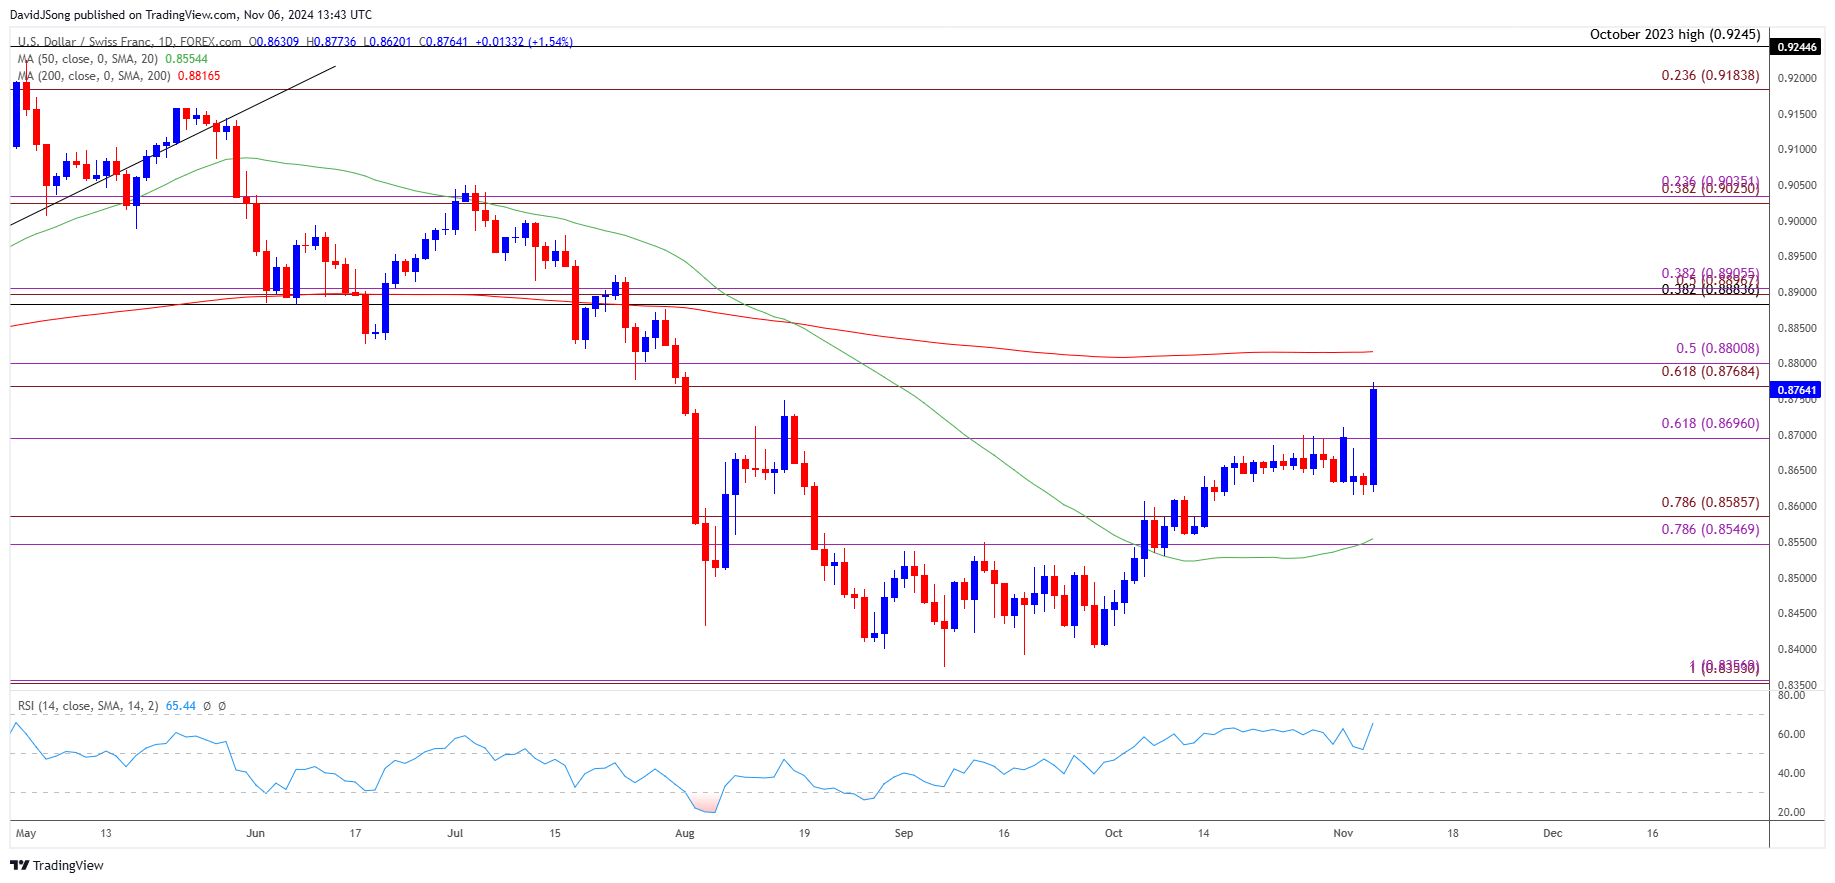
USD/CHF appears to be on track to test the August high (0.8788) as former President Donald Trump wins the 2024 election, with the recent advance in the exchange rate pushing the Relative Strength Index (RSI) to its highest level since April.
A move above 70 in the RSI is likely to be accompanied by a further advance in USD/CHF like the price action from earlier this year, with a break/close above the 0.8770 (61.8% Fibonacci extension) to 0.8800 (50% Fibonacci extension) region opening up the 0.8880 (38.2% Fibonacci retracement) to 0.8910 (38.2% Fibonacci extension) area.
At the same time, the RSI may show the bullish momentum abating if it struggles to push into overbought territory, and failure to hold above 0.8700 (61.8% Fibonacci extension) may push USD/CHF back towards the monthly low (0.8615).
USD, Bitcoin, S&P 500 Big Winners of the Night
James Stanley 8:38 ET (13:38 GMT)
Both Bitcoin and the S&P 500 have set fresh all-time-highs on the back of Donald Trump’s win and the US Dollar has also put in a major move to new highs.
But, all three markets continuing to gain seems unlikely for the long-term and that’s not necessarily a bad thing.
When Trump was elected in 2016 there was a similar move of USD-strength that had priced-in on the back of his victory. That was also around the time that the Fed started to sound more hawkish, as then-FOMC Chair Janet Yellen alluded to the fact that a Republican supermajority would likely drive fiscal initiatives to push growth of the American economy, something that would need to be offset by tighter monetary policy from the US central bank.
Sure enough, it was just about a month after Trump’s 2016 election that Yellen pushed only the second Fed hike since the Financial Collapse. And then in 2017 the bank hiked three times and then four times in 2018. Along the way, Trump replaced Yellen with current FOMC Chair Jerome Powell.
Despite the hikes in 2017, the US Dollar continued to sell-off. That bullish reaction in the currency lasted from the election in November of 2016 into the rate hike in 2017 – and then DXY spent much of the next year selling off.
At this point the US Dollar is nearing some major points of resistance in the two-year range, with 105.51 almost in-play after which 106 and 107 come into the picture.
US Dollar Weekly Chart

Source: Tradingview
Trump’s victory fuels the US Dollar Index against major currencies
Razan Hilal 7:44 ET (12:44 GMT)
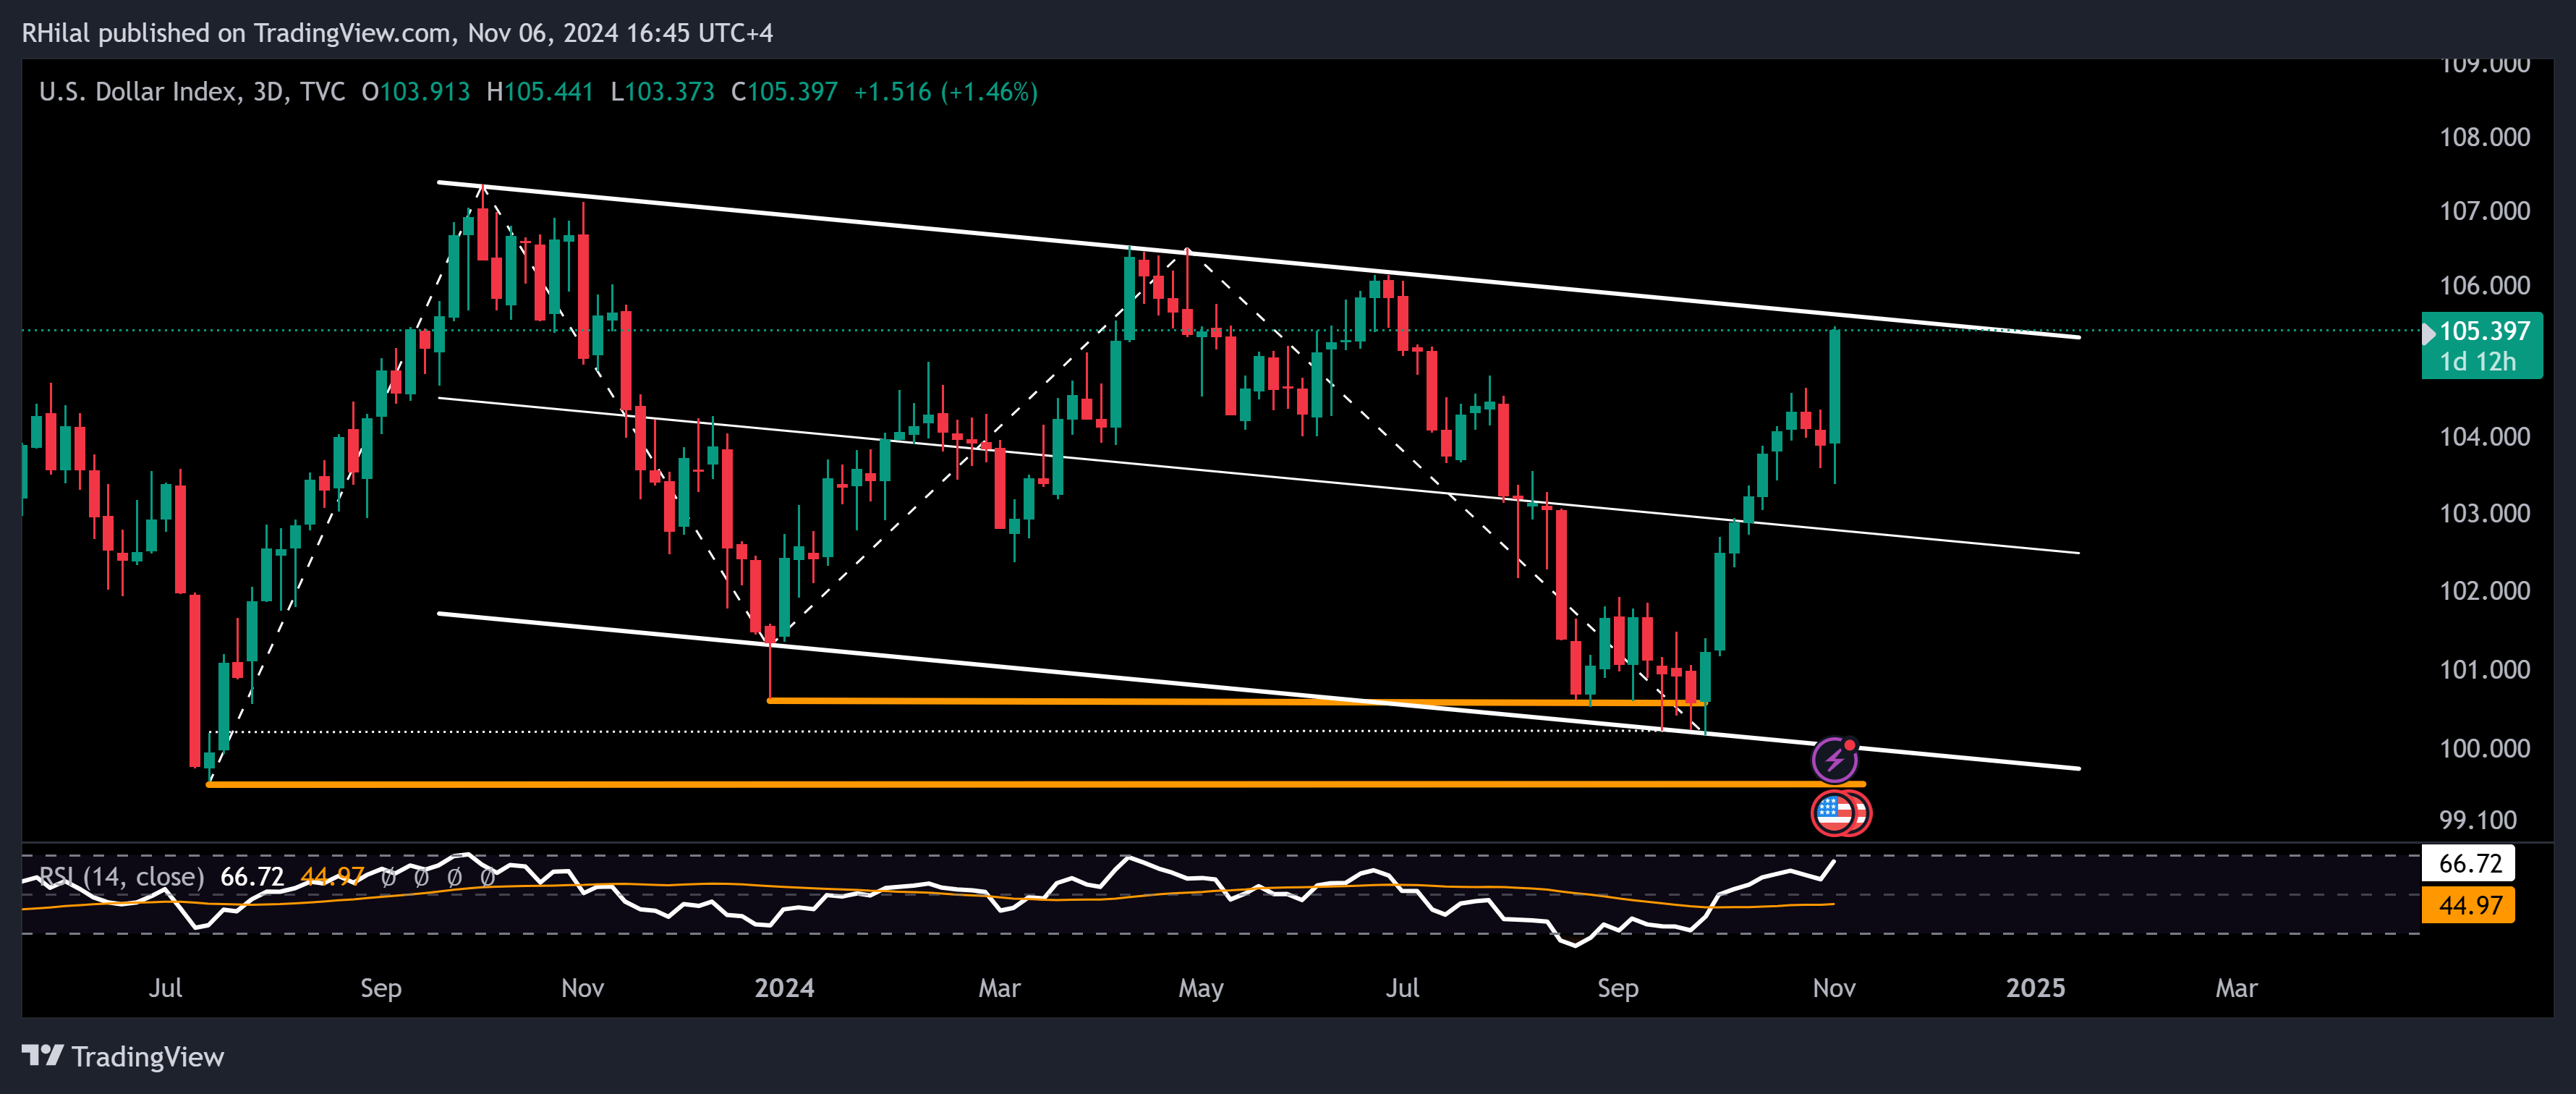
DXY 3-Day Time Frame
Source: Tradingview
The DXY’s bull run following Trump’s victory is pushing it toward 5-month highs, with an overbought RSI revisiting levels previously seen in April 2024 and September 2023. The index is now nearing a key trendline connecting consecutive highs from October 2023, April 2024, and June 2024. Amid this overstretched momentum, heightened election-driven volatility, and anticipation around the Fed’s upcoming decision and FOMC meeting—fueled by the ISM Services PMI rising to its highest level since December 2022—the DXY’s uptrend is at a critical turning point. This could either support an extended rally against major currencies or signal a potential bearish reversal.
Trump wins, US futures and dollar surge, commodities drop
Fawad Razaqzada 06:16 ET (11:16 GMT)
Good morning, USA! Donald Trump has won majority of the votes to become the next President of the USA and the Republicans have also won the senate. The big win has given “an unprecedented and powerful mandate” declared Trump, as his party won swing states of North Carolina, Wisconsin, Pennsylvania and Georgia. The Republicans could also win the house, but this is not confirmed yet. With 5 results to go, Trump has already won 51% of the vote with Harris only securing around 47.4% - a massive victory for Trump and a massive response from the markets!
US futures point to a new record on S&P 500
US index futures have rallied strongly with the S&P futures showing a 2.3% gain. The rationale behind the US stock market rally is that Trump is seen as business-friendly and will be able to pass on his tax cuts through easily without much resistance from the democrats who have lost control of the senate.
Could European indices come under pressure?
European stocks are higher too even though Trump’s tariffs could negatively impact European exports to the US. This is something that might come back to hurt the European indices, once the dust settles.
Dollar surges on inflation concerns
The dollar is higher across the board while commodities have taken a hit amid the dollar strength and threats of tariffs hitting demand. With the Republicans having also taken a majority in the Senate, Trump has been given a powerful mandate and platform to implement his policies, including tax cuts. This could boost inflationary pressures and result in a slower pace of rate cuts from the Fed relative to other central banks. It could even prevent the Fed from cutting rates significantly in 2025 should the disinflation process stops and reverses. This is why the US dollar has rallied as we had expected.
Commodities drop
Crude oil is coming under pressure because of potential for increased drilling activity could lead to more US oil production. The downside has been limited so far because of the risk rally. But oil is more likely to test recent lows I would say, and the trigger would be if WTI breaks Monday’s. As well as increased drilling in the U.S., and a stronger U.S. dollar, tariffs could hurt demand in key markets such as China.
Commodities could remain under pressure given Trump’s promise of tariffs on imported goods, especially from China. Industrial metals could be a particular weak spot and we have seen copper and iron ore being hurt overnight. The stronger USD and yields are also hurting gold as the opportunity cost of holding the non-interest-bearing asset climb.
There is now the risk that the FOMC may slow its rate-cutting pace. This is because inflation may re-ignite with Trump’s policies.
GBP/USD recovers from 1.2850 but remains depressed
Fiona Cincotta 4:54 ET (09:54 GMT)
World leaders are congratulating Trump on winning, and the Trump trade is still in full swing, boosting the USD.
Worries over Trump’s policies impacting UK growth are also hurting GBP. According to NIESR, UK growth could lower UK growth by 0.7% if Trump’s trade tariffs are implemented.
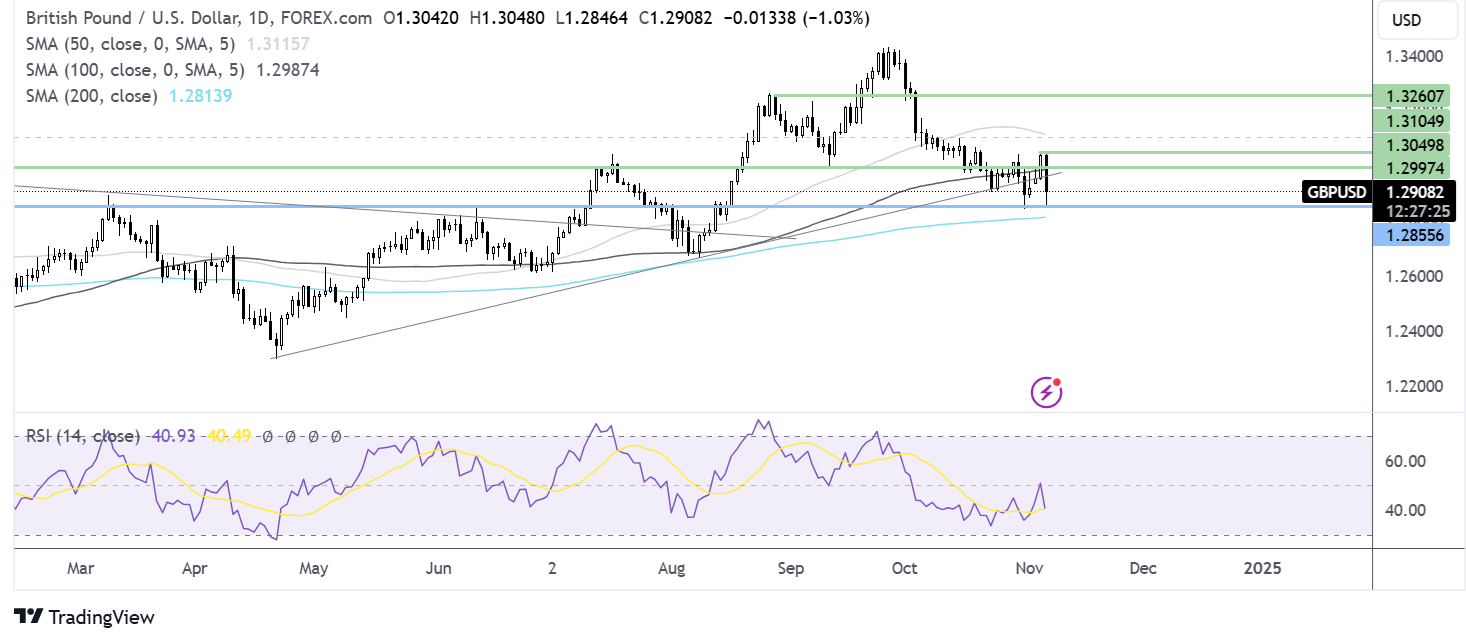
The USD trades +0.65 but has eased off its peak. GBP/USD has recovered from support at 1.2850 but remains depressed, over 1% lower on the day at 1.29.
Source: TradingView
The Fed and BoE rate decision coming into focus. The BoE is expected to cut rates tomorrow by 25 bps to 4.75%. Although the BoE Governor is unlikely to guide to another rate cut in December.
Europan stocks surge on the open, tracking US futures higher
Fiona Cincotta 03:38 ET (08:38 GMT)
European stock markets have opened higher, following record highs on US futures, as Donald Trump claims victory, even before the election has yet to be officially called.
Republicans have taken a majority in the Senate, raising the likelihood of a red sweep. This would give Trump a powerful mandate and platform to implement his policies, including tax cuts sending US stocks higher. European stocks are tracking gains even though Trump’s tariff policies could negatively impact European firms.
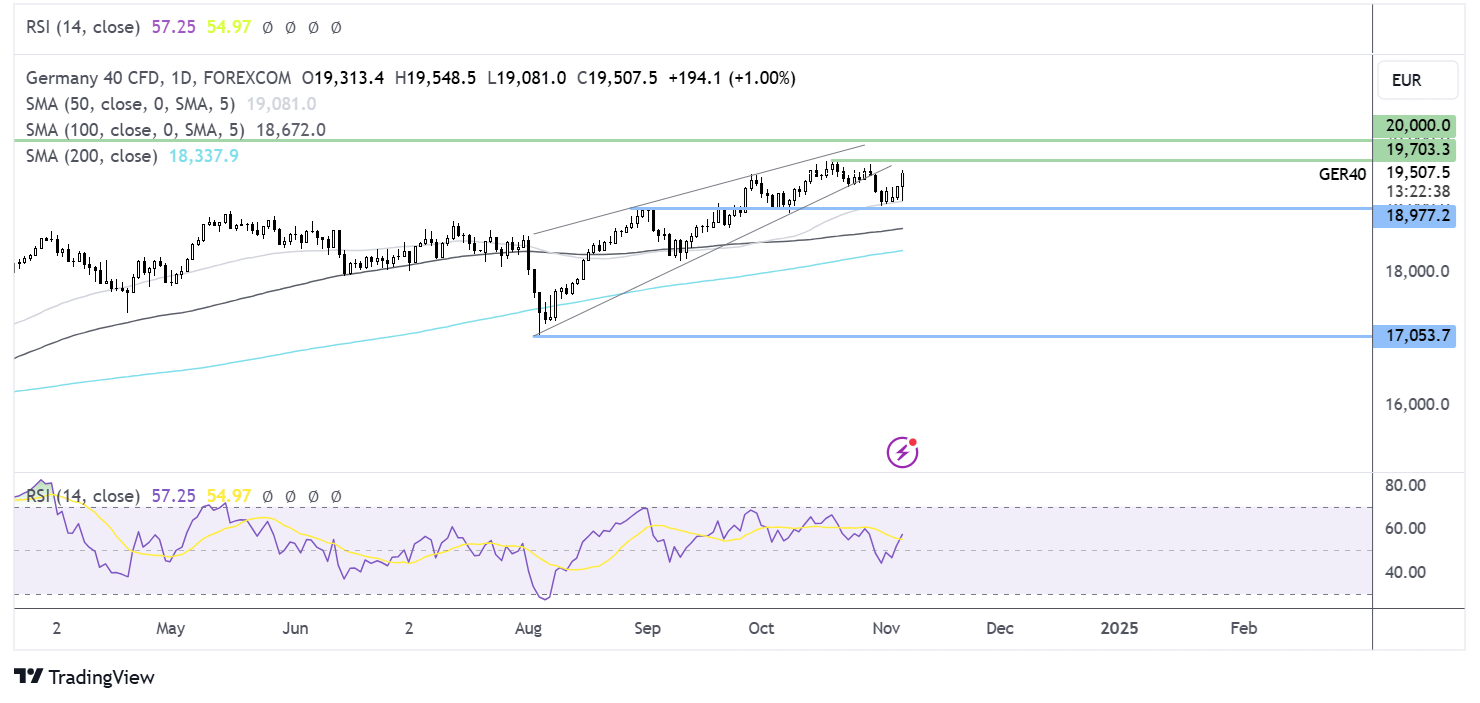
The DAX has rebounded from the 50 SMA just above 19,000, bringing 19,670 and fresh all-time highs into focus.
Source: TradingView
Best day for Dow Jones futures in 2 years (and Europe’s not even open)
Matt Simpson 03:05 ET (08:05 GMT)
The official result is yet to be confirmed but, with Pennsylvania now confirmed as a Republican state, it’s now a near impossibility for Harris to claim this.
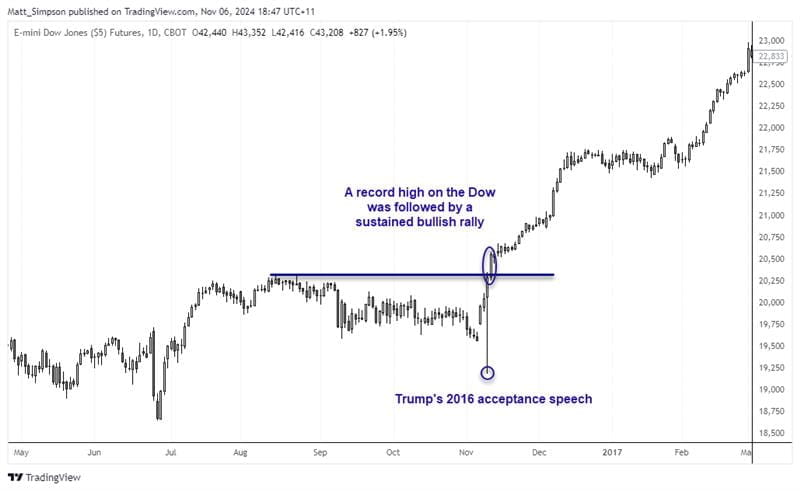
Trump is delivering what is effectively his acceptance speech, and it is reminiscent of his 2016 speech in many ways as he calls or Unity and to make America great again.
Source: TradingView
But what differs is that that Dow Jones futures have already rallied 2% on bets of a Trump win, whereas in 2016 they were plunging on the prospects of a Trump win. The stock market only rallied after his acceptance speech sought unity and economic prosperity for all.
So what can we expect now?
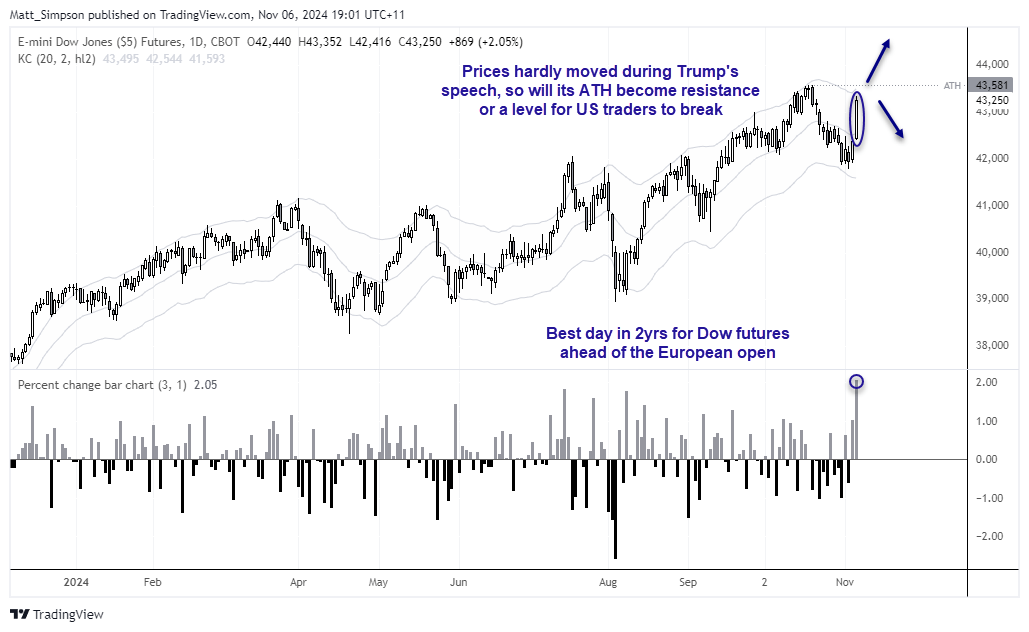
Source: TradingView
At ~2% up for the day ahead of the European open, Dow futures have already tallied up their best day in two years. It trades just 1% from its record high, yet hardly moved after Trump’s speech. So it is now over to Europe and the US in to decide whether we’ll see a repeat of 2016, and the Dow breaks to a new record high and extends its bullish run over the coming months.
But with bonds yields rising on the prospects of a less-dovish Fed, I’m not sure it will be so clear cut.
Nasdaq eyes 2024 highs amid a record surge in the S&P 500 and a Trump victory in the headlines
Razan Hilal 2:34 ET (7:34 GMT)
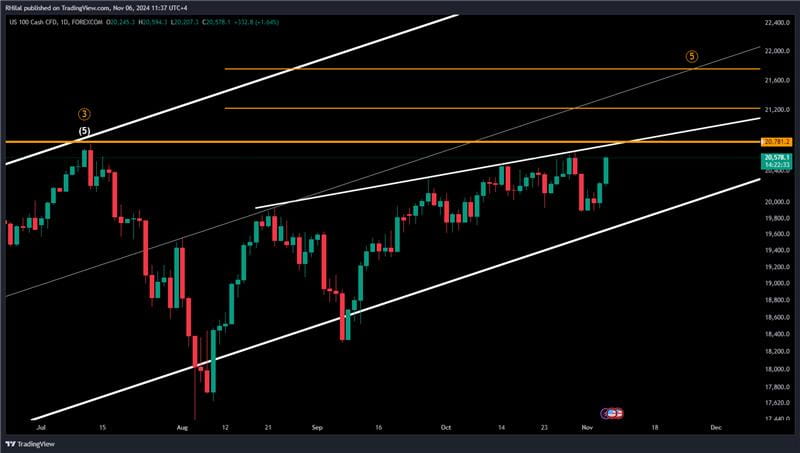
Nasdaq: US100 Daily Time Frame
Source: TradingView
Following the market’s hype towards a Trump win, and the S&P 500’s surge to record highs, the Nasdaq is on track to test its 2024 high, nearing the trendline linking its August, September, and October peaks.
The upcoming November high will be crucial in determining whether it respects this trendline or breaks out toward its all-time high of 20,760.
A strong close above 20,760 could propel the Nasdaq further, with potential resistance zones at 21,300 and 21,700.
US small caps eyeing record highs following bullish break
David Scutt 02:10 ET (07:10 GMT)
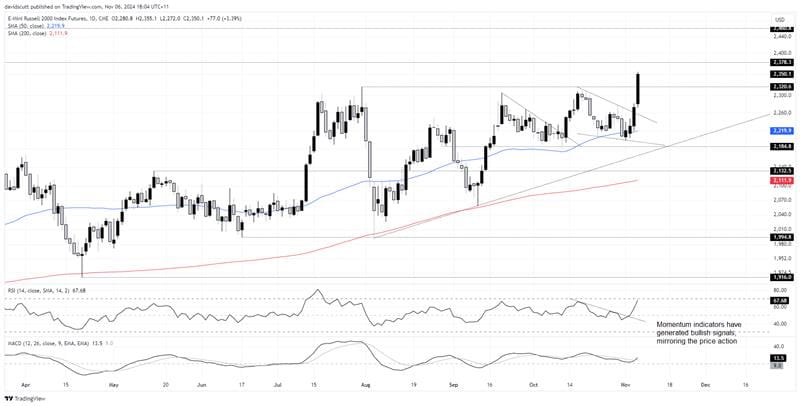
US small-cap stocks are surging, with Russell 2000 futures hitting their highest level since late 2021 after easily clearing the July peak of 2320.6. The next upside target is 2378.3, a minor level that briefly acted as support and resistance in November 2021. The more interesting level is the all-time high of 2460.8, set in the same month.
Technically, the setup looks solid, with RSI (14) and MACD flashing fresh bullish signals alongside the price breakout.
Fundamentally, though, many of the index's constituents are loss-making and depend on equity and capital markets. With US interest rates sharply higher, the key question is whether the prospect of corporate tax cuts can offset the headwinds of rising borrowing costs. For now, the market says yes.
Source: TradingView
Fox news call Trump victory, Worst day for AUD/USD since April
Matt Simpson 02:05 ET (07:05 GMT)
It seems everyone is calling for a Trump win with Pennsylvania very close to being confirmed as Republican. Trump is set to address his supporters, whop have already been treated to an official FOX news ‘call’ for Trump to win. Meanwhile, a sombre aide for Harris told a sombre crowd that the Vice President will not be speaking with them until Wednesday and effectively sent them home.
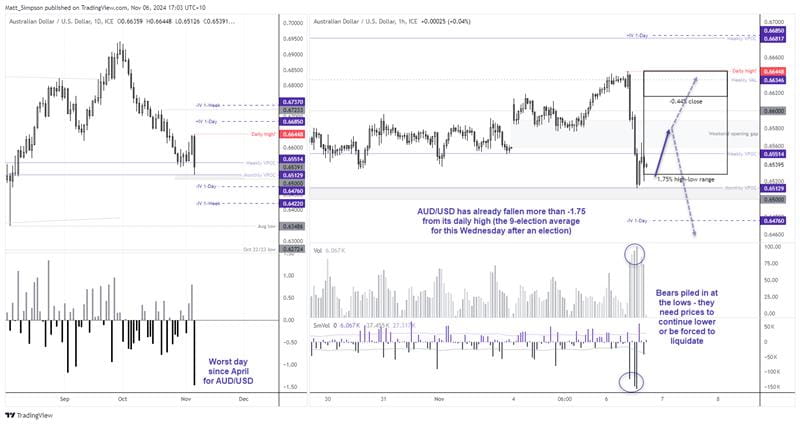
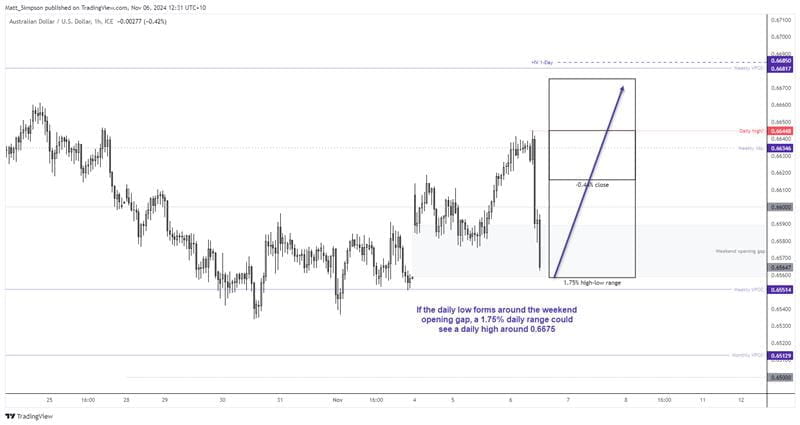
Despite these recent developments, AUD/USD has failed to break to a new daily low after it found support around a monthly VPOC (volume point of control). And with Trump about to hit the wires, I cannot help but wonder if he will trigger a risk-on rally and help pairs such as AUD/USD rise form the ashes. But with bond traders sending yields higher, he may need to address the desire for lower interest rates to send the USD lower and AUD/USD materially higher.
But as AUD/USD has already fallen -1.75% from the daily high, I cannot help but wonder if the next volatile move could be to the upside, given traders have been pricing in a Trump win for several hours now. Also note that a lot of the bearish volume occurred at the lows of the move, which means they are trapped and may be forced to liquidate soon if prices do begin to rally.
Extending gains through the European session
Razan Hilal 1:44 ET (6:44 GMT)
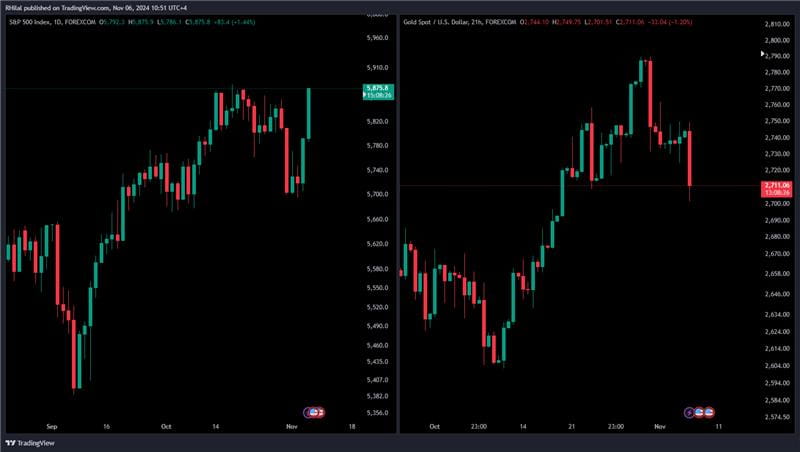
Stepping into the Euro session with Trump leading towards victory, the S&P 500 approaches record highs, and gold eases down to 2700 as market certainty is somewhat settling in.
Mean reversion kicks on after extended moves
Matt Simpson 00:30 ET (05:30 GMT)
We’ve seen quite a bit of volatilty already, but nost of it has been one-sided and in line with the ‘Trump Trade’, sending stocks, yields, the USD and bitcoin higher. But you can have too much of a good thing.
We’re now seeing a decent amount of mean reversion against these earlier moves. Harris has narrowed her deficit with Trump’s lead, and while this is not enougn to bring any comfort to the Democratic camp, it has been enough for traders to book profits from extended moves.
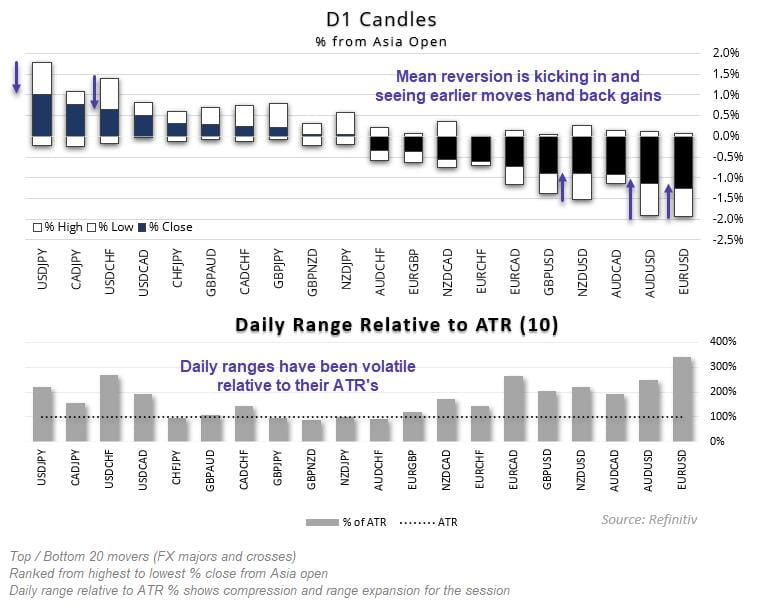
The currency dashboad shows that the majority of pairs have exceeded their daily average true range (ATR) in the lower panel, while the uppoer panel shows the currenty daily candle – and that many pairs have reverted back from their respective day’s highs or lows.
This is a much neede retracemnt in my view. It could allow fresh bets to relioad for the Trump trdea if he storms again (particularly if Republicans takes the House). But we could also see mean reversion continue and possible even reverse some of these earlier moves, is somehow Democrats pull the rabbit out of a very red bag in the coming hours.
Shifting USD Price Action as the House is Now in Question
James Stanley 00:22 ET (05:22 GMT)
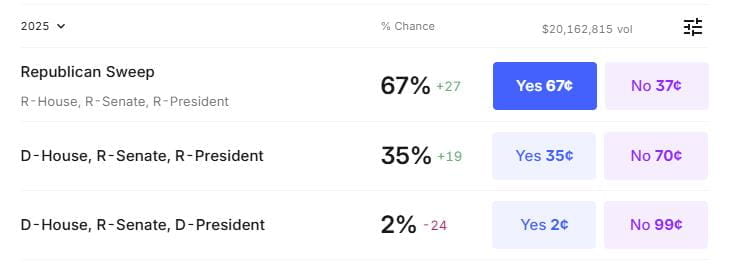
Just past midnight ET and votes are still being tallied in a number of key swing states. Odds of a Trump win are now up to 94% on Kalshi, and it looks like Republicans have secured a majority in the Senate. The question now is whether they can take the House to secure the supermajority and those odds have shifted a bit. Previously odds were as high as 81% for a Republican sweep and that’s now pulled back to 63%, with increasing probability for democrats to take the house.
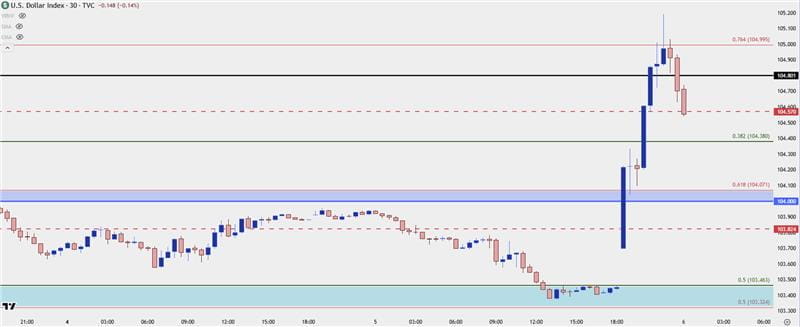
The USD move has been fast – DXY pushed up for its first test of 105.00 since July and that’s where the trend stopped. Now the pullback has moved all the way back to test below prior resistance at the 104.57 level. Ideally this is a spot that bulls would want to defend for topside continuation but if they don’t, next support is at 104.38.
The Senate turns red, worst day for EUR/USD in 2 years
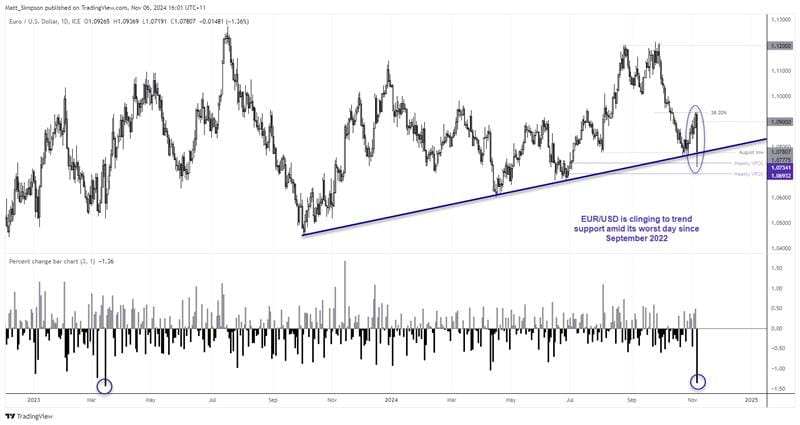
Matt Simpson 00:00 ET (05:00 GMT)
Republicans have won back the Senate, although the battle for the House remains up in the air. This provides Republicans the ability to appoint conservative judges while simultaneously blocking policies from Democrats, assuming they even win the election at all.
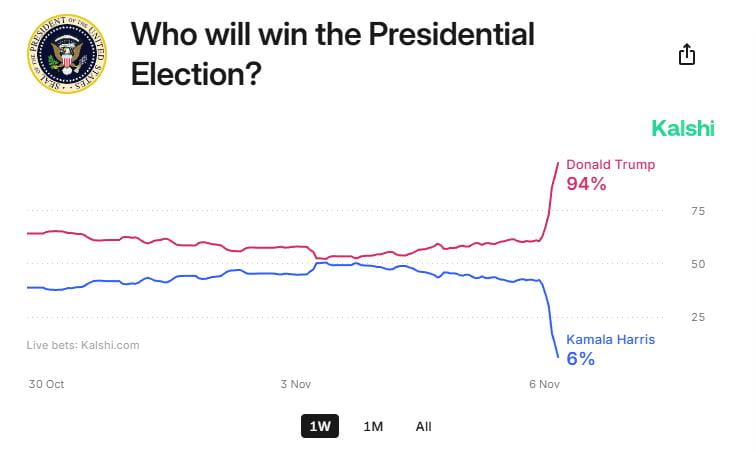
And right now, those odds are not looking good. Harris stands just a 6% chance of winning according to the latest odds from Kalshi.
Bond prices are plunging, sending yields soaring. And that has kept USD as the strongest FX major to the detriment of all else. EUR/USD is currently down -1.5% during its worst day since September 2022, although it had fallen as much as 2% by the day’s low. Price are now clinging on to the September 2022 trendline.
Traders unwind Fed rate cut bets as inflation expectations spike
David Scutt 00:00 ET (05:00 GMT)
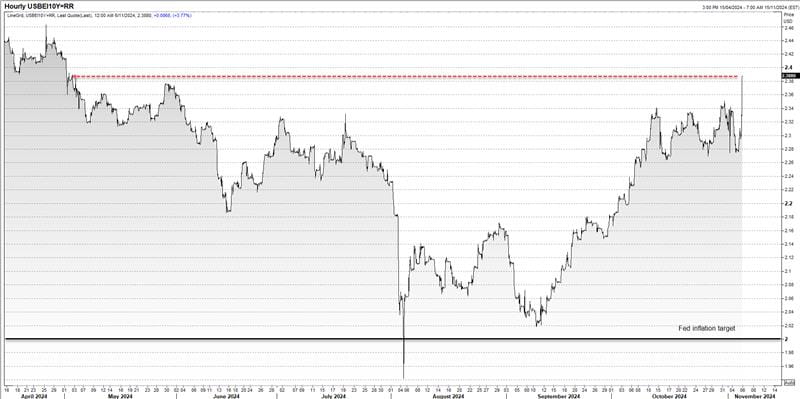
US market-based inflation expectations are rising quickly as traders move to price in a greater probability of a Republican red wave, ushering in more expansionary fiscal policy which could boost an already robust US economy. And that’s before potential tariffs on US imports are taken into the equation.
US 10-year inflation breakevens – which track inflation expectations by subtracting nominal Treasury yields from yields on Treasury inflation protected securities of similar maturity – have spiked around 9 basis points to 2.388%, the highest level since April.
Source: Refinitiv
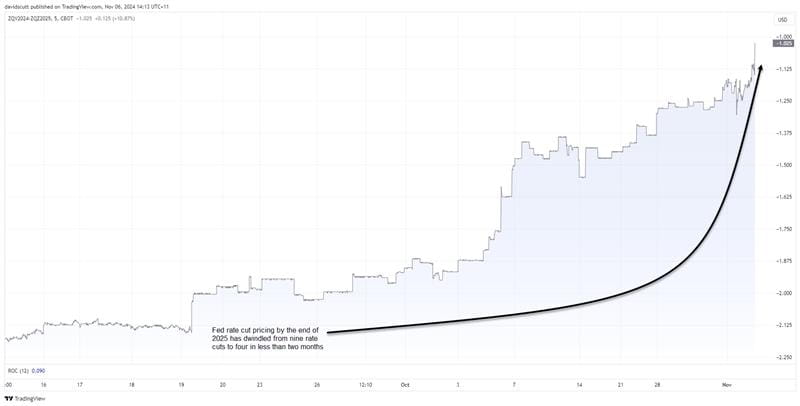
As the Federal Reserve targets 2% annual inflation, the increase in inflation expectations to nearly 40bps above target has contributed to a further unwind in rate cut pricing. Looking out until the end of 2025, Fed funds futures price just over 100bps of cuts, or four 25-point moves. A little under two months ago, pricing stood at nine.
Source: TradingView
November 5, 2024
Euro Plummets to Key Support as Trump Lead Expands
Michael Boutros 23:00 EST (04:00 GMT)
EUR/USD Daily Chart
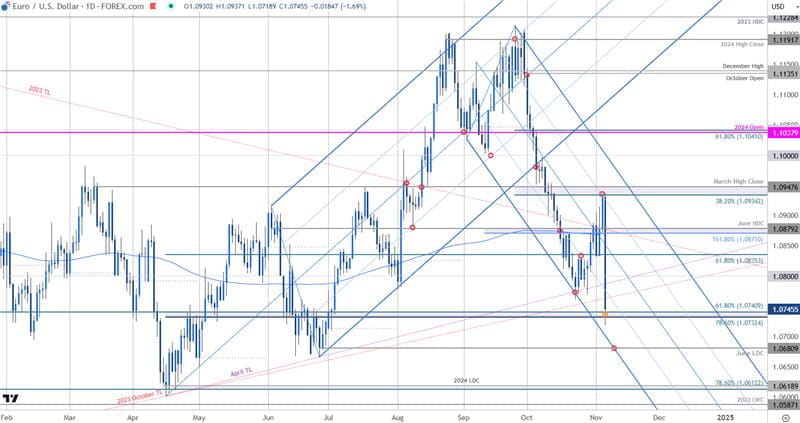
Euro has now plunged more than 1.7% off the highs with price now testing key lateral support at 1.0723/40. Losses below this threshold expose the lower parallel / June low-day close (LDC) at 1.0619. Resistance now back at 1.08 with near-term bearish invalidation lowered to 1.0835.
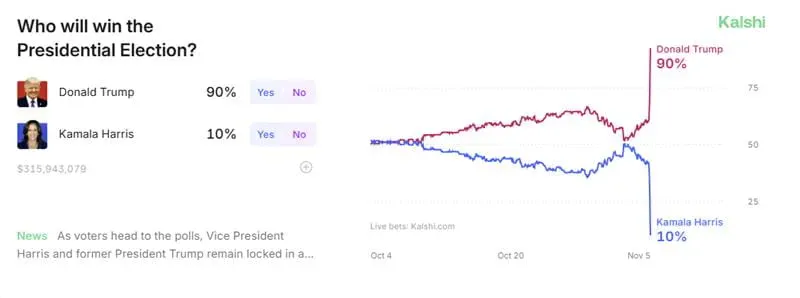
Kalshi odds now pricing a 91% chance for a Trump victory.
Trump lead expanding as Georgia is close to flipping
James Stanley 22:54 ET (03:54 GMT)
Kalshi now has Trump at 90% to win and some key battleground states are falling his way. Trump lost Georgia in 2020 by fewer than 12,000 votes and at this point the New York Times is considering that as 'very likely republican,' as Trump holds a 51% to 48% lead with 93% of votes counted. He’s also leading in Wisconsin which is another battleground state and NYT currently has that listed as ‘leaning republican.’
Prediction markets aren’t waiting around though as Harris now has a 10% chance of victory.
Wall Street rallies on a Trump pump
Matt Simpson, 22:30 ET (03:30 GMT)
US indices are surging and bitcoin futures have just reached an all-time high with the NY Times forecasting a Trump win with a 75% probability and Kalshi odds at a staggering 82%.

S&P 500 futures have already exceeded Tuesday’s gains before lunchtime in Asia, which is not something you see very often. They were also just -0.55% (-130 points) beneath their all-time high but now sit around -0.73% (-172 points).
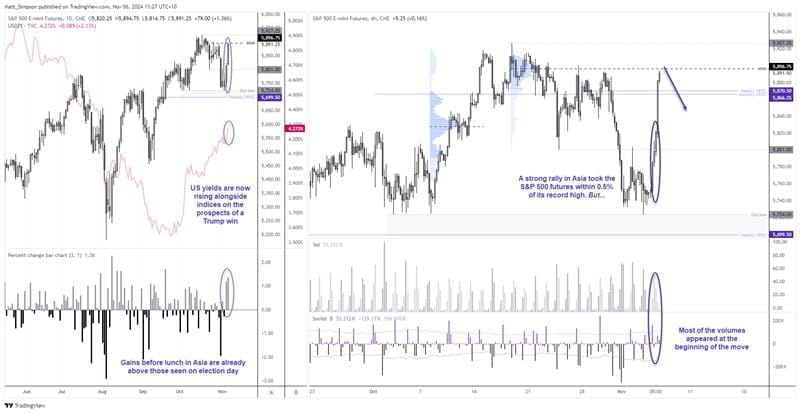
I guess Wall Street traders are happy to look past ‘higher for longer’ Fed rates that bond traders are pricing in, who have now sent the 2-year yield has high as 4.3% just a few moments ago. Although take note that prices for the S&P 500 E-mini futures have stalled around a high-volume node from the consolidation at tis all-time high.
If the count continues to lean red, an all-time high looks like a slam dunk. But with key swing states yet to be confirmed, it would be wise to remember that the win is still for the taking from either candidate and that volatility cuts both ways.
Trump leading Iowa, NYT gives Trump 82% chance of victory
James Stanley 22:32 ET (03:32 GMT)
The shocking poll out of Iowa over the weekend hit prediction markets and several questions populated with it showed Harris with a lead in the traditionally red state. Well that looks like it can almost be put to bed now as the NYT is calling Iowa a likely Republican win.
And overall at this point the New York Times is giving Trump an 83% chance of victory.

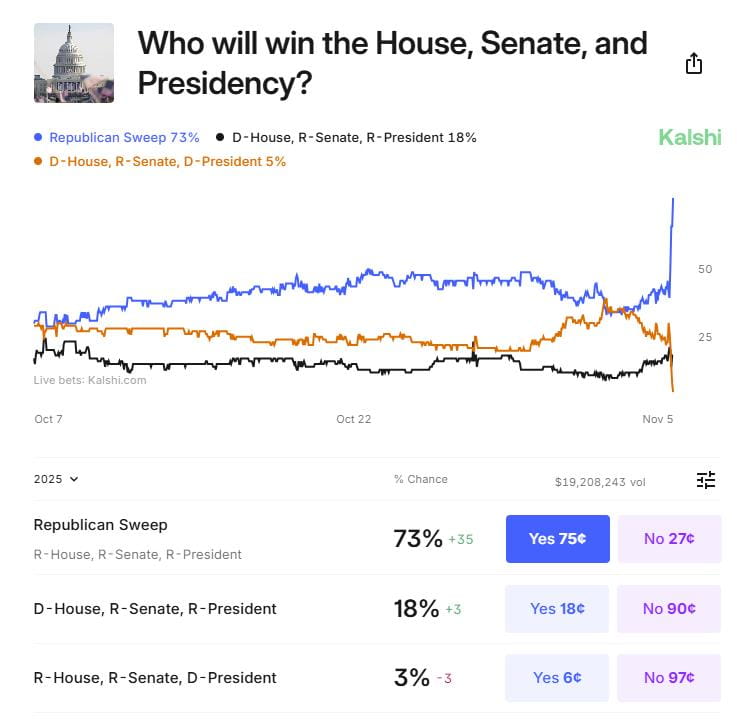
Russell 2000 the story in equities, up 5.37% as odds of republican sweep swell
James Stanley 22:24 ET (03:24 GMT)
The big story in equities right now is the outperformance in small caps, with Russell 2000 futures at a fresh all-time-high and up 5.37% on the day compared to more modest gains in S&P 500 futures (+2.19%) and Nasdaq 100 futures (+2.08%).
One possible culprit is the increasing expectation for a Republican sweep, which would mean Republicans controlling both the executive branch along with both houses of Congress. In that backdrop there would be considerable expectation for business-friendly legislation that, arguably, could help smaller companies.
That expectation was at around 33% at the weekly open and has surged as the night has worn on, getting as high as 81% and currently at 73%.
Chinese yuan buckles as tariff threat grows
David Scutt, 22:10 EST (03: 10 GMT)
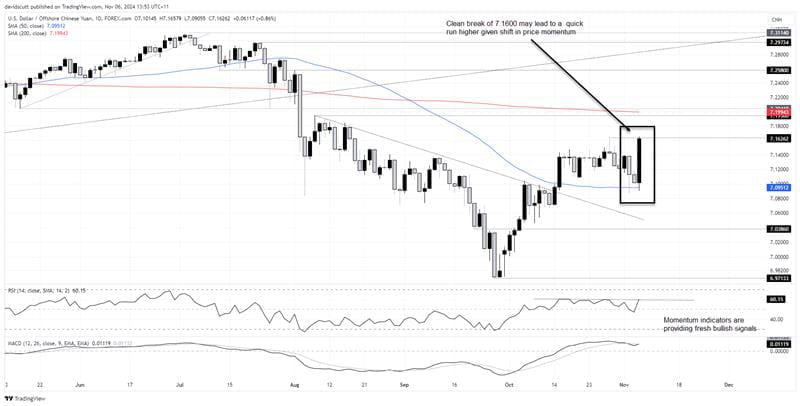
The offshore Chinese yuan has dropped to a three-month low against the US dollar, driven by surging US Treasury yields and the growing likelihood of stronger trade barriers on Chinese imports into the US. Before the election, Republican candidate Donald Trump vowed to impose 60% tariffs on Chinese imports over three years. If he returns to office, it could pressure China’s National People’s Congress Standing Committee (NPCSC) to boost stimulus spending to counter the trade impact on domestic activity.
The NPCSC meets this week in Beijing, with an announcement due Friday. If Trump is re-elected, the stimulus package could be significantly larger than under a Harris presidency. While it's not widely discussed, the tariff threat may also push Chinese policymakers to devalue the yuan, similar to the surprise move in August 2015 when the Chinese economy was also under strain.
While today’s USD/CNH daily candle isn't complete, it will provide a telling signal for traders on near-term directional risks, if it finishes this way. The price has so far been capped just above 7.1600, the October 29 high, helped by reports that Chinese state-backed banks have been selling dollars to support the yuan. If those actions are halted, who knows where Thursday’s USD/CNY fix could end up? A lot higher, you’d imagine.
As a major Asian currency, significant weakness in the yuan could lead to even larger losses in other regional names, and broader emerging markets currencies.
Source: TradingView
A clean break above 7.1600 could see bulls target 7.19500, the 200-day moving average, and 7.20420.
Momentum indicators are turning bullish: RSI (14) is threatening to break its downtrend, and MACD has crossed from below. On the downside, the 50-day moving average has been a reliable entry point for dip buyers over the past week.
Trump Win Getting Priced In USD, Bitcoin
James Stanley 21:38 ET (02:38 GMT)
Odds of a Trump win are continuing to push higher as Kalshi is now showing 73% for the former President compared to 37% for Harris.
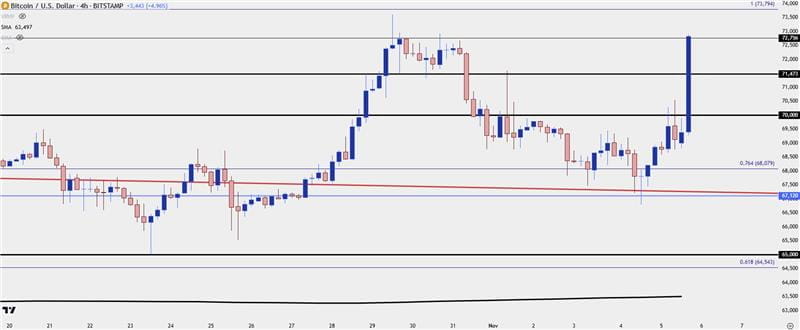
I looked at Bitcoin as being possibly one of the more clear venues for election drive as Trump has warmly courted the crypto crowd – and as Trump odds peaked last week on the 29th, Bitcoin made a fast move up to the all-time-high, holding just below the 73,794 level. Well, that price may soon be back in play as BTCUSD is staging a massive rally, currently trading at 72,756.
Bitcoin Four Hour
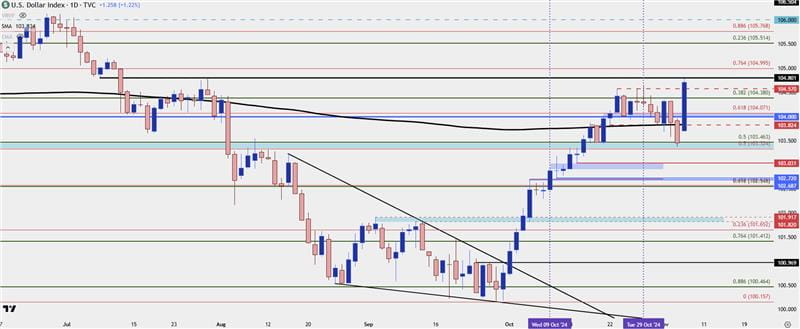
And in the US Dollar the currency has already pushed up to a fresh three-month-high, trading above the 104.57 level that had held resistance on three separate occasions into last week. Next resistance at 104.80 and then 105.00.
US Dollar Daily Price Chart
AUD/USD closing the weekend gap as Trump leads
Matt Simpson, 21:30 ET (02:30 GMT)
AUD/USD has closed lower 5 out of the past 9 elections, with an average (and median) return o -0.22%. And with early votes leaning towards a Trump victory with the potential for the Senate as well, AUD/USD is trying its best to close lower for 6 out of the past 10.
While this is still early in the count, let’s run with that for a second.
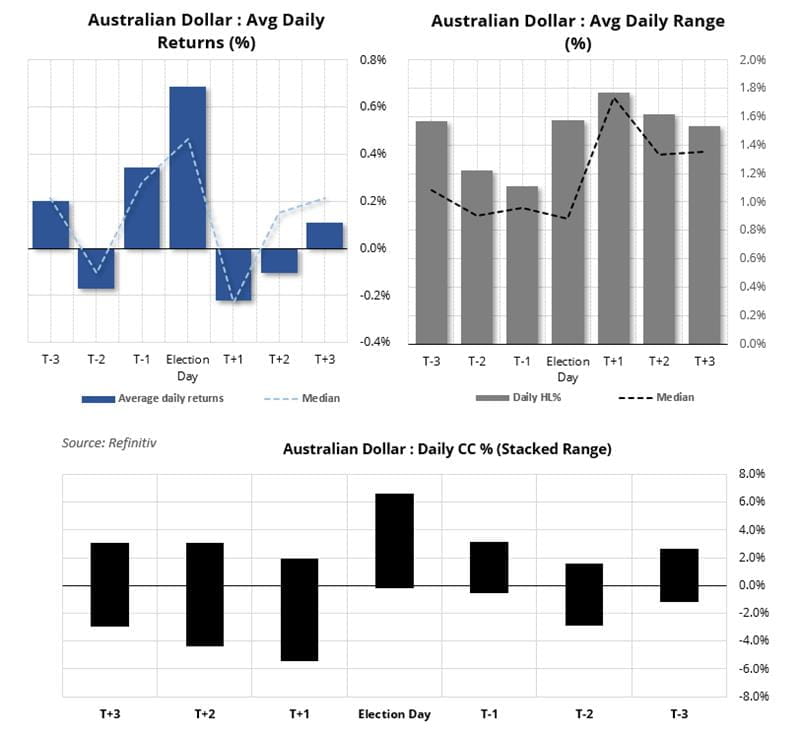
Assuming the daily high has already been seen at 0.6645 and we see a 1.75% daily range (the average of the past nine elections), the daily low could be around 0.6529. Yet the lower 1-day implied volatility level is even lower at 0.6476.
But take note that the average return is -0.44%, and we’re already way past that level. And as the early votes aren’t always a good predictor of the outcome, there’s also the chance that AUD/USD could rally hard if Harris makes a comeback.

Now let’s assume the daily low lands around the weekend’s opening gap. If we’re to see a 1.75% daily range and Harris goes on to win, it could push prices up to the upper 1-day implied volatility band around 0.6685.
Politics aside, I like that the week’s opening gap remains upon and price action on the daily chart continues to look oversold to my eyes. Therefore, my bias is for the second scenario, although we should of course allow plenty of wriggle room for the daily low to form. But this requires Harris to make a decent comeback from shaky levels.
Time Lines and What to Watch Overnight: S&P 500 Eminis, EURUSD, Treasury Futures
John Kicklighter, 20:15 EST (01:15 GMT)
Voting continues in the United States and tallying is well underway starting from the East Coast. It is common place for a small percentage of votes to represent the broader trend of the state and thereby various agencies calling for a winner well before the last ballot is tallied. It’s important to remember generally that there are historical norms for most state to fall for a particular party. In turn, that puts greater emphasis on so-called ‘swing states’. In the end, for the United States, the electoral votes are what determines the president – not the popular vote. Below is the electoral votes each states caries and the candidate who won said state in 2020.
Image of 2020 Electoral College Map
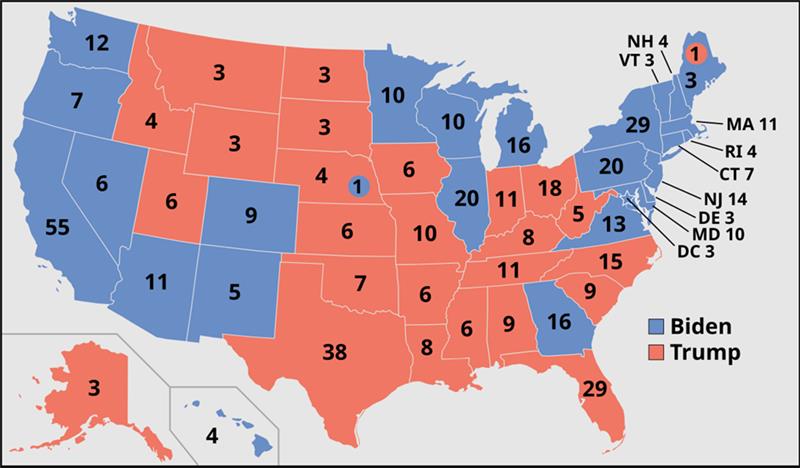
Source: Wikipedia
It can take time for a critical mass of votes to be secured to the point where news agencies are comfortable with calling a state for one candidate or the other – there have been historical instances where results don’t align to these calls. While this chart reflects the closure of the polls, it doesn’t indicate when the critical vote threshold is met. That depends on how quickly the votes are tallied and what a reasonable threshold is for the given state. For benefit of a close race, I’ve highlighted the 7 swing states on the chart. Historically, it took 4 days to know the final result in 2020, it was around midnight in 2016, 2012 and 2008, and the vote in 2000 took over a month to confirm owing to the ‘hanging chad’ manual recount in key areas.
Table of US State Poll Closures with ‘Swing States’
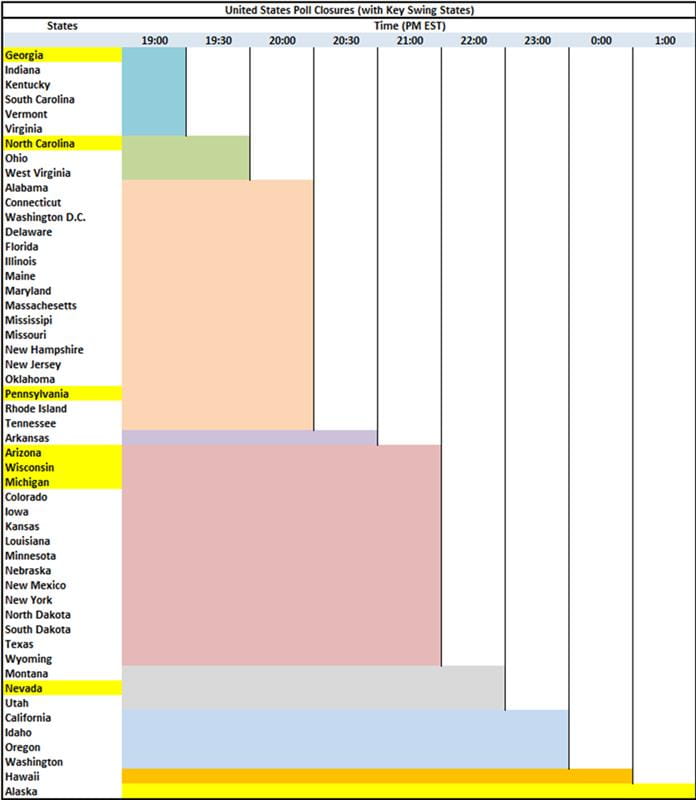
Source: Wikipedia
Getting a sense of market reaction to evolving probabilities, it is important to look at markets that trade ‘overnight’ to normal US exchange hours. The Dollar is such a market. EURUSD is the benchmark exchange rate and it has charged higher since the New York close. This seems to align to betting markets which have shown a sharp increase in probabilities favoring a Trump victory. A Trump administration would likely revisit protectionist policies like trade wars which didn’t have a consistent benefit to the Greenback, so this is something to watch.
Chart of EURUSD (15 Minute)
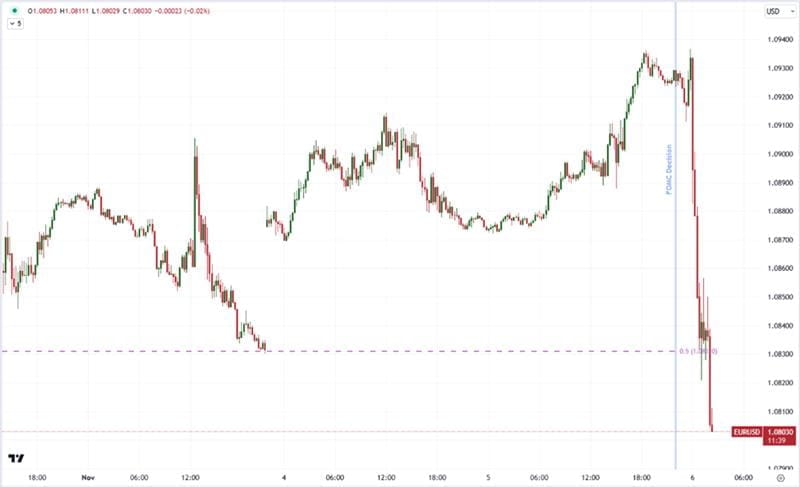
Source: TradingView
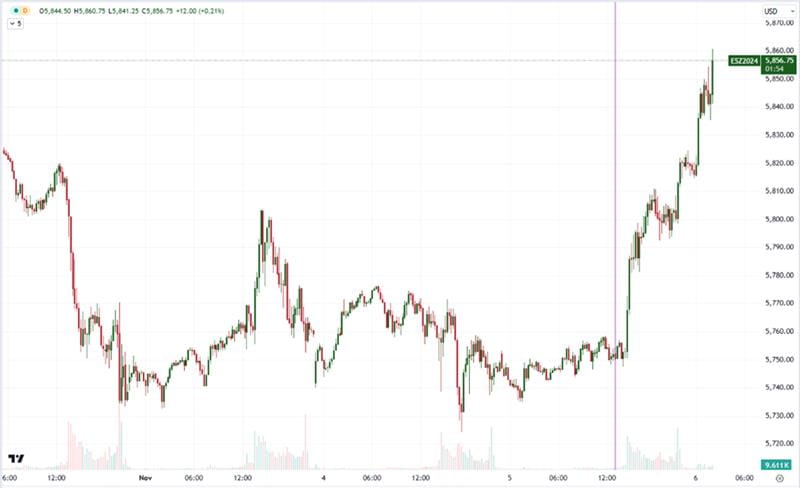
For capital markets, the exchange closure makes for a difficult read. That said, the S&P 500 futures market is fairly active globally overnight. That is particularly true during elections. Despite how indicative this measure is of the US and its markets, the volume is still very low relative to an active session turnover. High volatility and shallow markets can make for bigger short-term moves. Trends are difficult to draw from such developments, but this is more of a trend-defining event.
Chart of S&P 500 Emini Futures with Volume (15 Minute)
Source: TradingView
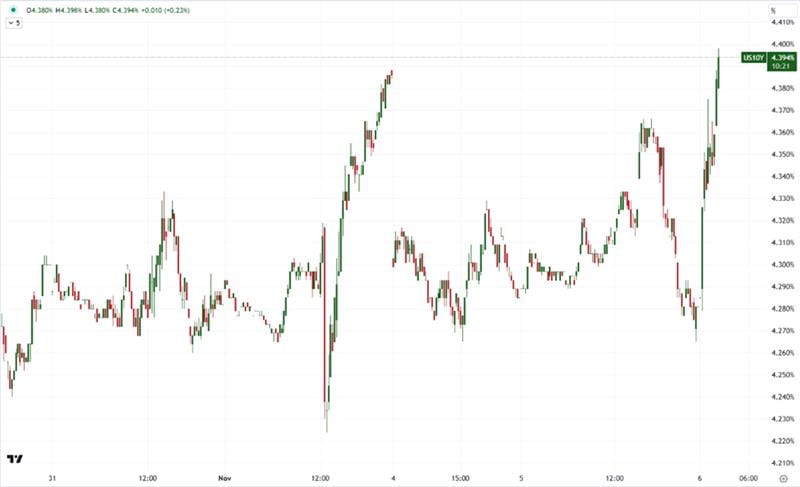
One of the markets more indicative of economic influence in the wake of elections is the US Treasury market. Treasury prices move inversely to yield, and the latter has shot higher over the past hours. The revived correlation to capital markets is notable here given that the relationship between the two has waxed and waned through the shifting monetary policy tides.
Chart of US 10-Year Treasury Yield (15 Minute)
Source: TradingView
US Treasury yields spike as red wave probability grows
David Scutt, 20:25 EST (01: 25 GMT)
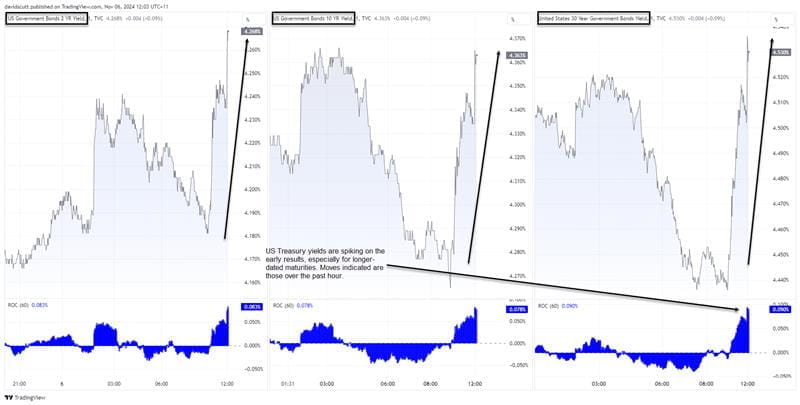
With Republican presidential nominee Donald Trump performing strongly in early counting across Eastern States, US Treasury markets are selling off with yield across the entire US rates curve pushing higher, reflecting Trump’s plans to run expansionary fiscal policy settings and introduce import tariffs. Yields across two, 10 and 30-year maturities have spiked over the past hour with longer-dated Treasuries hit the hardest. 30-year yields alone have risen 9 basis points, slightly more that for shorter tenors.
Source: TradingView
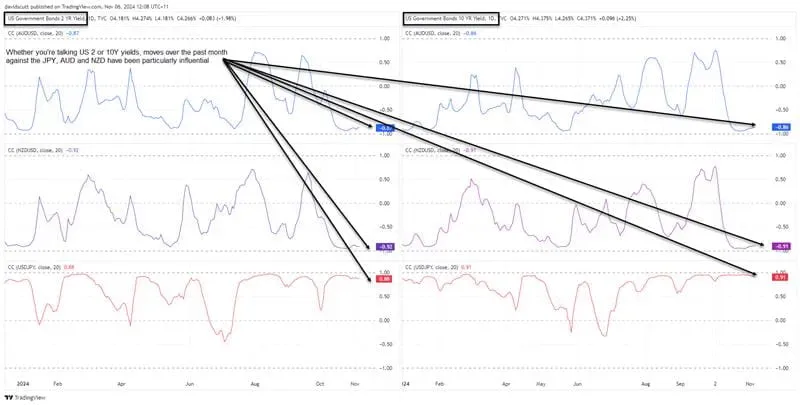
The lift in Treasury yields is important for USD/JPY, AUD/USD and NZD/USD which have demonstrated strong relationships with US two and 10-year yields over the past month. The correlation coefficient scores reflect that against these currencies, moves in Treasury yields have dominated USD performance.
Source: TradingView
If the early trends are replicated nationwide, the selloff in Treasuries may become far more significant given the probability of Congress flipping red, posing a risk for valuations across multiple asset classes.
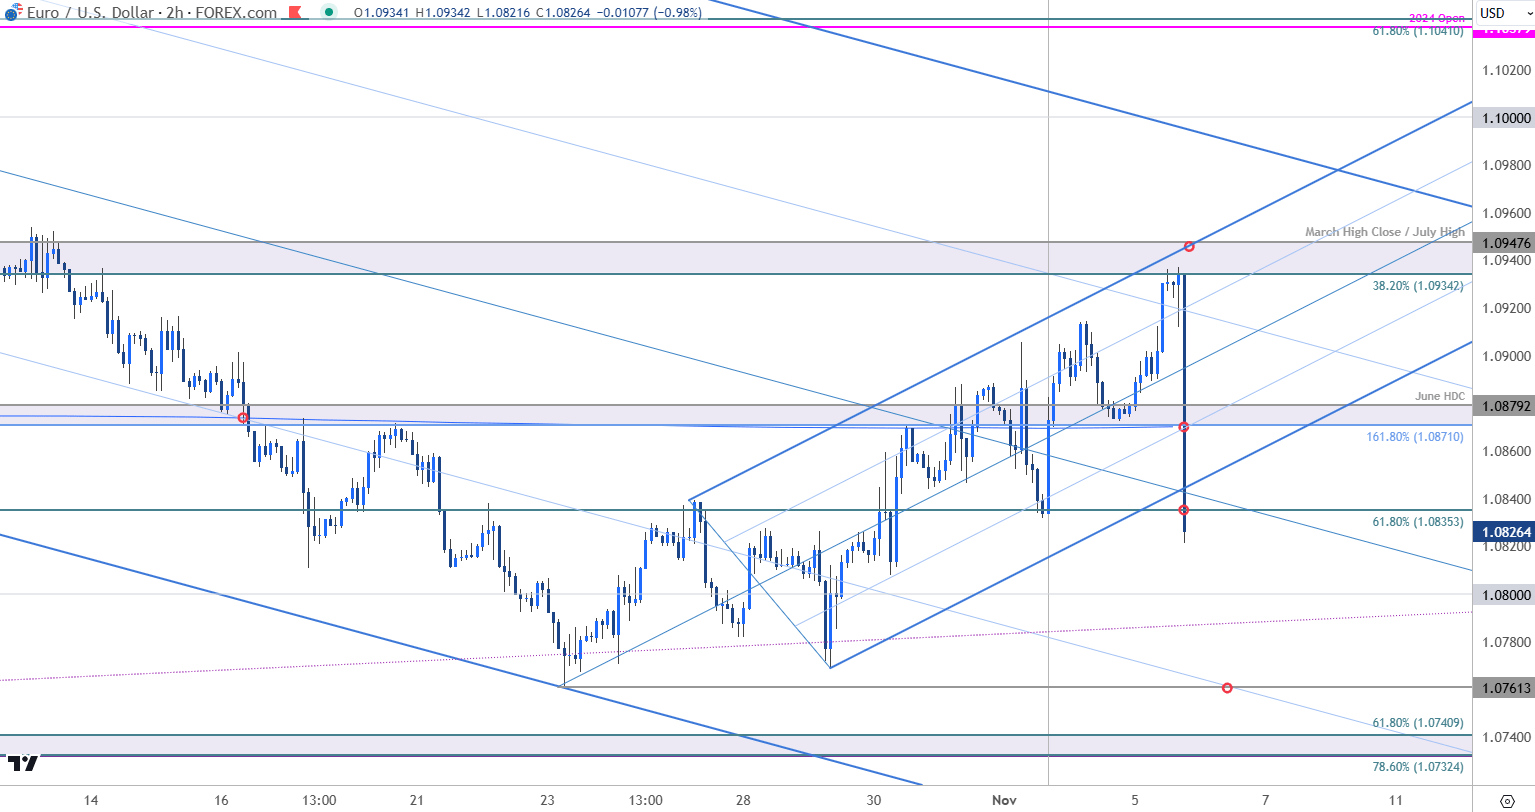
Euro Erases Weekly Advance as Election Results Trickle
Michael Boutros, 20:20 EST (01:20 GMT)
EURUSD 120min Chart
Source: TradingView
Euro has responded to resistance we noted earlier at 1.0934/47 with EUR/USD off more than 1% from the highs. Watch this candle close with respect to the weekly open / 61.8% retracement at 1.0834/35.
Initial resistance now back at 1.0871/79 with a breach above the median-line needed to suggest a wash out is complete. A confirmed break here would expose the 1.09-handle and the October lows at 1.0761. Critical support unchanged at 1.0732/40.
Things are likely to get a bit more volatility as more results roll in- stay nimble here.
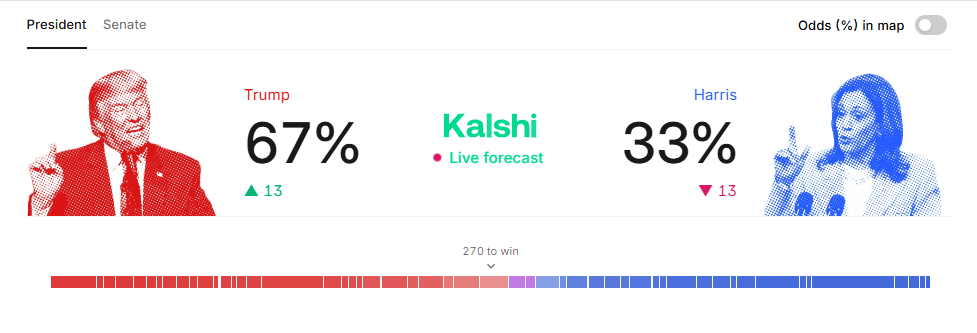
USD, US Equity Futures Ripping as Kalshi Shows Trump at 67%
James Stanley, 20:04 EST (01:04 GMT)
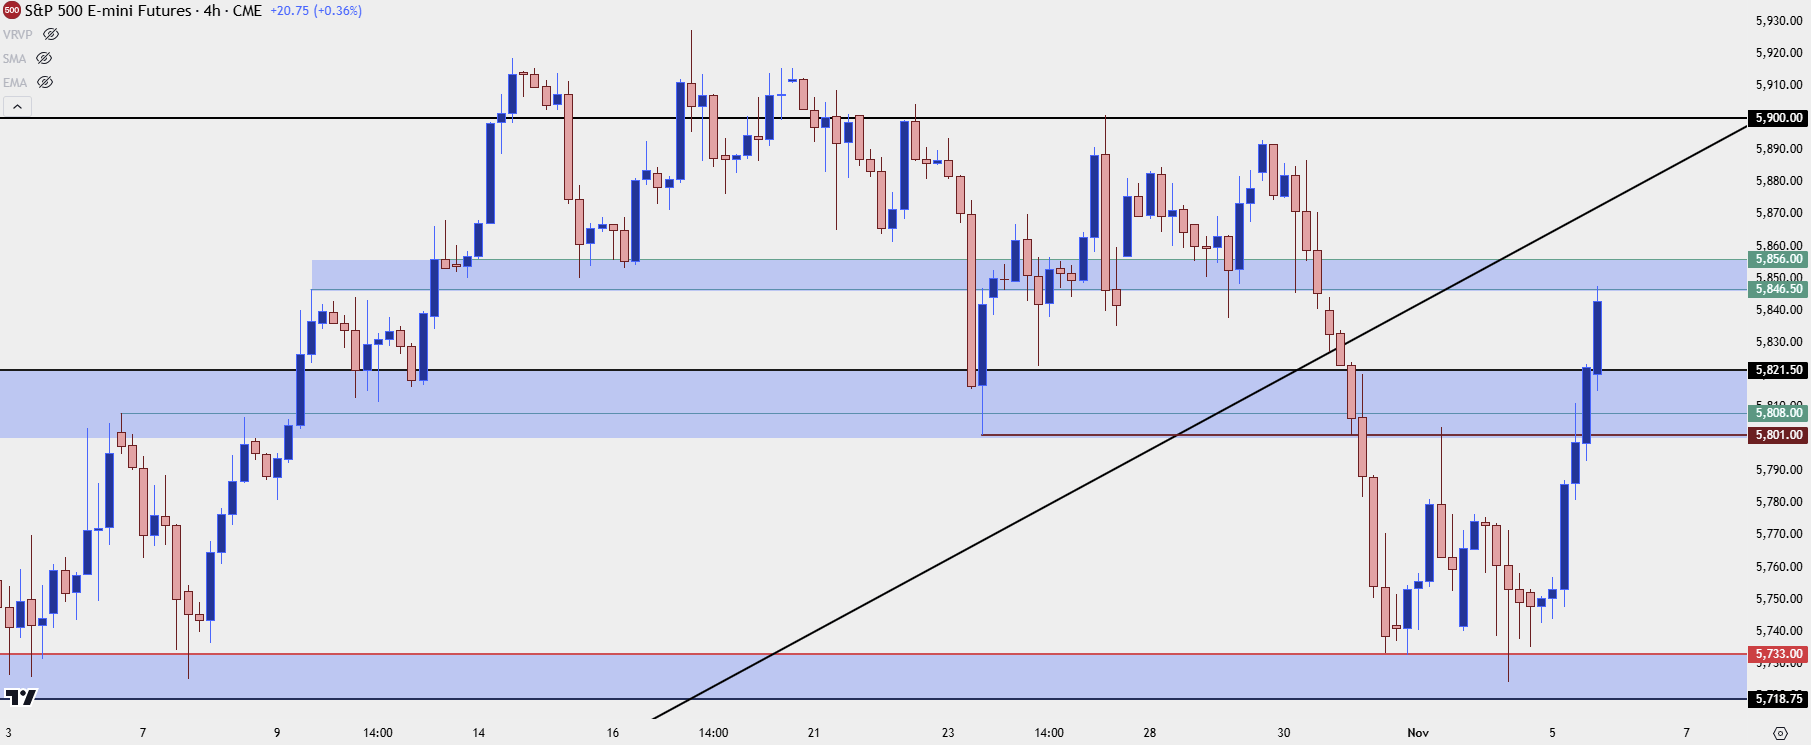
Fast start to the night across markets. Both the US Dollar and S&P 500 Futures are ripping as some results have started to come in. Kalshi has Trump odds all the way up to 67% which is a leap from the earlier 57% read.
Source: Kalshi
In S&P 500 futures, price had sat on support at 5733 for the past four days but in late trade this afternoon the index pushed up to 5821.50. It’s already pushed up to the next zone of resistance that I’m tracking that starts at 5846. This now sets up higher-low support potential at the 5801-5821 zone, and next resistance overhead at 5866 followed by the 5900 level. If we see this get really aggressive tonight, I have a hard time imagining that 6k could get taken out without much grief but it’s an election night, so the band of possible outcomes widens significantly.
Source: TradingView
In the US Dollar, today was mostly soft as DXY spent much of the afternoon drawing down, retesting the support I had looked at earlier in a blog post and also in the webinar.
Now it’s already back over the 104-104.07 zone and making a fast run at the Fibonacci level of 104.38. Above that, it’s the 104.57 level that DXY couldn’t take out over the past couple weeks with three separate attempts failing.

Source: TradingView
USD/JPY rallies from 200-day MA as early projections roll in
Matt Simpson, 19:50 EST (00:50 GMT)
As per usual, we’re seeing Republicans take the lead as early votes are counted and some of the smaller states called. That’s seeing a bid fir the USD dollar. Which has helped USD/JPY jump back above 152. This level has some history behind it, as it is the level that Japan’s Ministry of Finance (MOF) intervened in 2022. It provided resistance twice in 2023 and support twice earlier this year. While price action is not so clean around it recently, prices are meandering around it consistently enough to remind us of its relevance. It also happens to land near the 200-day MA.

Source: Tradingview
Anyway, the 4-hour chart is on track for a bullish engulfing candle to suggest a swing low at 151.27. And it could continue to gain bullish traction should incoming votes and projections continue to side with Trump.
But take note of the wide 1-day implied volatility range of ~440 pips. This is early days, and the early counts have failed to predict the eventual winner of the previous two elections. But that won’t prevent prices from pretending that they might. And that leaves plenty of potential volatility with twists and turns over the next 24 hours for bulls or bears.
History suggests we’re in for a volatile and bearish day on Wall Street
Matt Simpson, 18:50pm EST (23:50 GMT)
Wall Street indices rallied on Tuesday – which tends to be the norm on the day of the election. Quite why risk picks up I am not sure, but it tends to be a broad risk-on rally which also benefits stocks in Europe and Asia too. And given the UASD was lower, allowing EUR/USD to rally alongside commodity FX and gold, it seems to have been a textbook election (where price action was concerned, anyway).
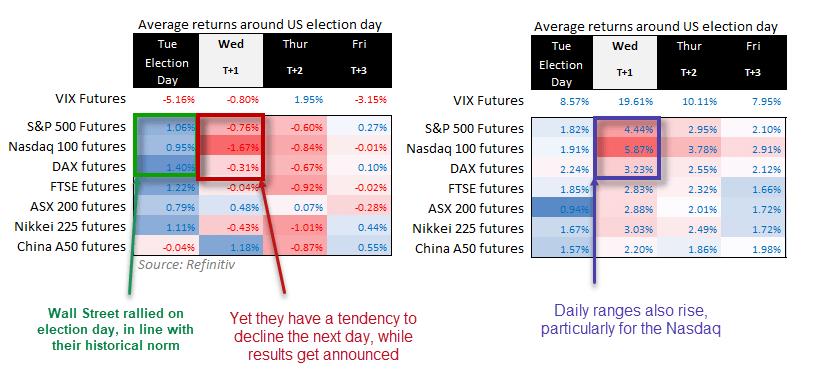
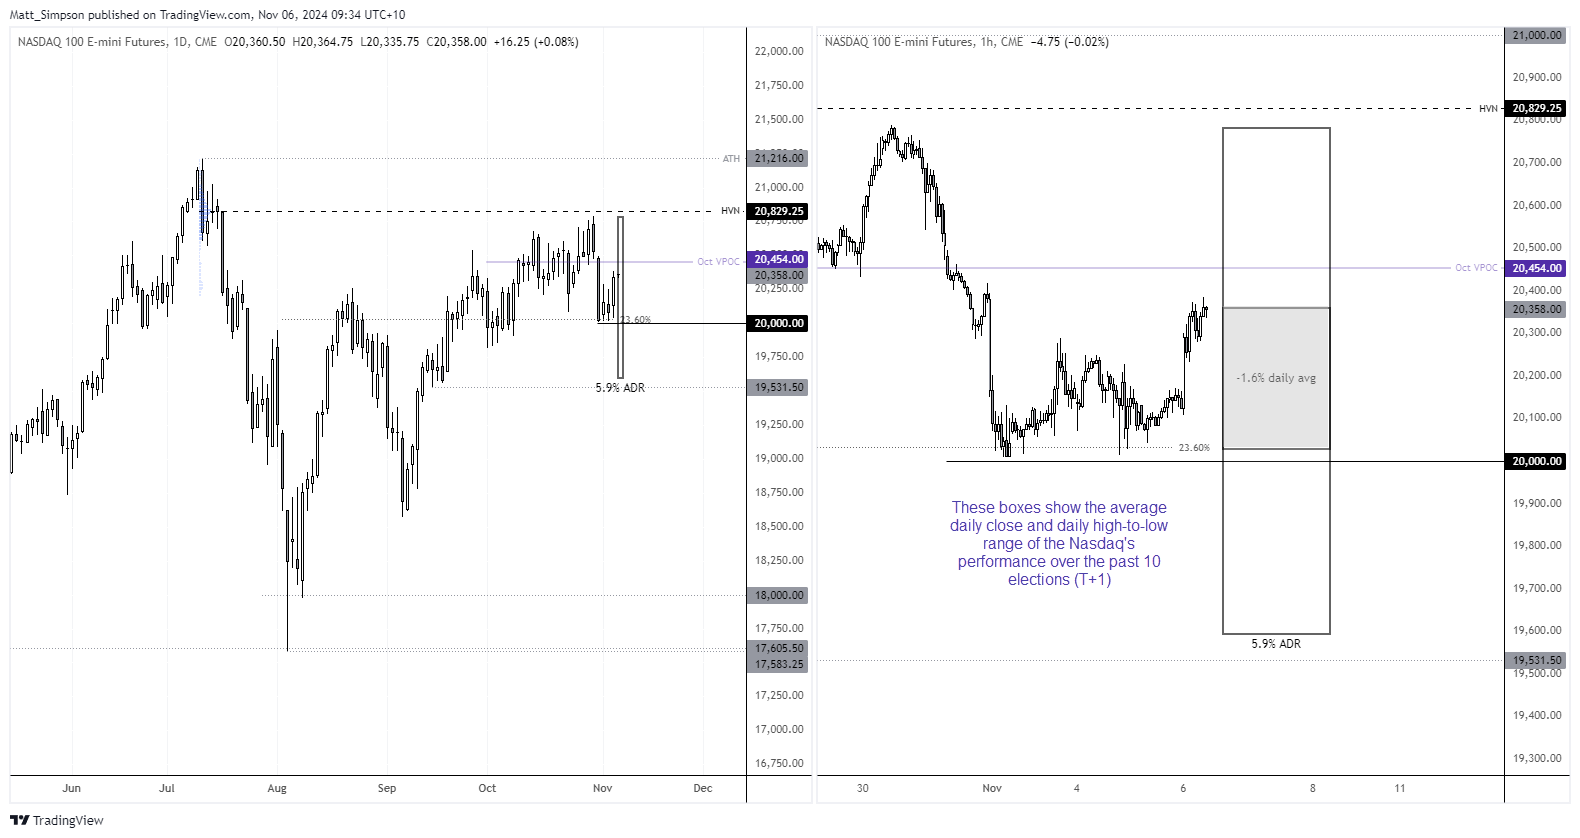
But I am now intrigued to see if history continues to repeat. If so, Wall Street futures could retrace lower today while the average daily range (ADR) picks up, particularly for Nasdaq futures. And this checks out, because within a few hours results will begin to pour in and markets will respond accordingly.
Just remember that while these averages show a clear pattern of declines on Wednesday alongside a rise in volatility, it does not show us how prices reach these results. And we can likely expect many twists and turns in price action while results are confirmed across states through the night in the US (or our daytime for us in Australia).
Source: TradingView
Nasdaq futures performed a strong rally from the 20k area, near the 23.6% Fibonacci level. I suspect a move to 20,450 is on the cards near the October VPOC (volume point of control) initially. But beyond that it really is down to the count.
But we can see that the average of the past 10 elections for the Nasdaq has been a -1.7% daily close with a daily ADR of 5.9%. I have drawn these ranges on the charts to see what that could look like, but of course I do not have the benefit of hindsight to see where the daily high and low will actually be.
US equities close higher on final day before the election.
James Stanley, 16:45 EST (21:45 GMT)
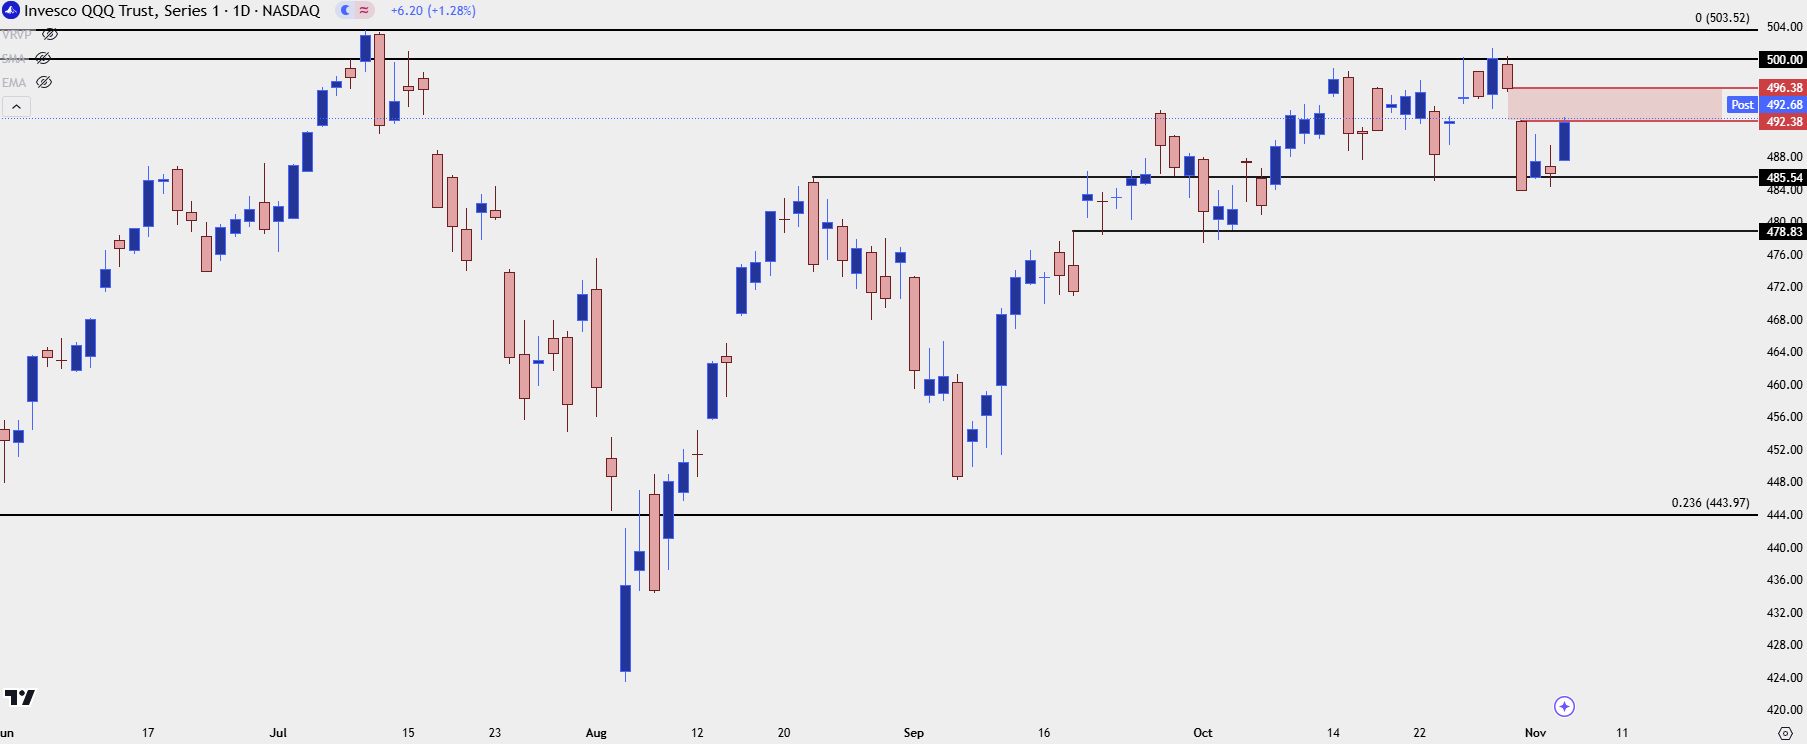
US equities close higher on final day before the election. The next time that US equity markets are open the election will be over. We may not know the winner of the Presidency but there will be no additional votes cast and effectively the election will be completed. It was a strong day for equities, as well, but it’s important not to read too much into it as it’s usually the day after elections when markets really move. And, of course, futures markets will be open tonight and like we saw back in 2016 after Trump’s first win, the volatility there can be impressive as numbers start to come in.
In QQQ, prices moved right up to the underside of the gap from last Thursday, which is itself a response to the resistance that held at the 500-handle. A strong showing in equities tonight can cause prices to gap right back through that zone again, with the 500 level a spot of contention. For supports there’s prior higher-lows around 483-485 and then down around the 477-478 levels. If bulls lose the handle on those levels tech stocks will start to look quite a bit more vulnerable.
Source: TradingView
USD/CAD Plunges ahead of Election Results
Michael Boutros, 15:40pm EST (20:40 GMT)
USD/CAD Daily Chart
Source: TradingView
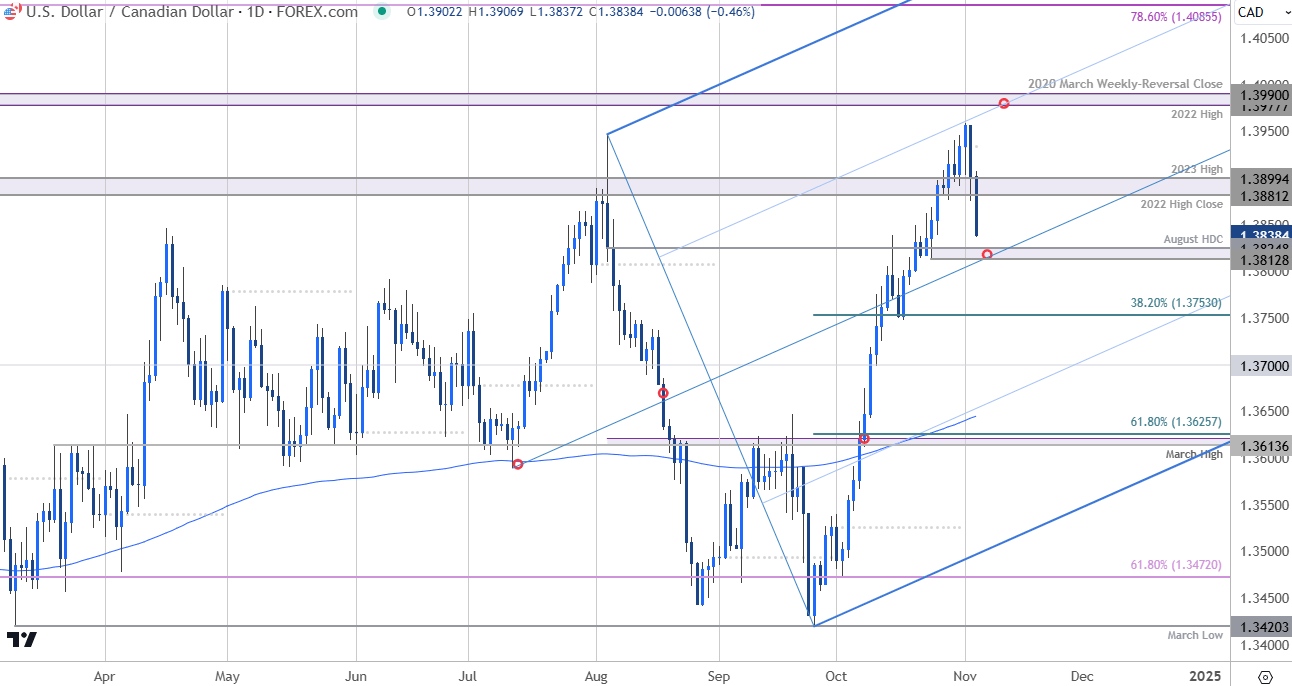
A reversal off uptrend support into the start of the week has gathered pace with USD/CAD now off more than 0.86% from the high. Initial support rests near the August high0day close (HDC) at 1.3812/25 – look for a larger reaction there IF reached. Subsequent support eyed at the 38.2% retracement at 1.3753. Resistance now back at 1.39 with critical resistance steady at the 2022 high / 2020 March weekly-reversal close at 1.3977/90. Bottom line: USD/CAD is approaching initial support at the median-line. From a trading standpoint, rallies should be limited to 1.39 IF price is heading lower with a close below 1.3813 needed to fuel a larger correction. A close above the monthly open at 1.3934 would be needed to put the bulls back in control.
Are Gold and Crypto Better ‘Safe Haven’ Alternatives When the Dollar is the Center of Risk?
John Kicklighter, 15:30 EST (20:30 GMT)
As the votes are coming in for the US election, it’s worth considering the US Dollar’s immutable position as the global ‘safe haven’. What if the uncertainty and risk originate from the United States itself? We have seen that in the past with global financial crisis that begin in the country and spread outward or when aggressive policies (like the 2018-2019 trade war) positioned the country as the source of the general risk. In general, the Greenback’s role as a safe haven works on a curve. The ends of the curve whereby the Dollar either has the highest carry or not is readily sorted by carry trade. In extreme ‘risk aversion’, all that matters is safety of capital; where the USD and Treasuries have no legitimate equal – consider Treasuries are still preferred as the benchmark even after Standard & Poor’s and Fitch have downgraded the United States one step from top rating (‘AAA’).
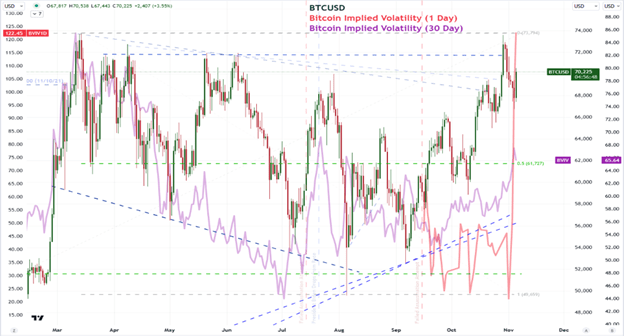
In the ‘belly’ of the curve, if risk trends are driven by moderate forces; the markets are afforded more time and headroom to decide where their capital is best held for both safety of funds and potential return considerations. There certainly isn’t a full-scale sentiment drive – whether ‘risk on’ or ‘risk off’ – occurring right now, so it is reasonable that risks that are focused on the US are bolstering some alternatives. We can see that in fiat with the DXY dropping or EURUSD rising, but consider the favored ‘alternatives to traditional currencies’. First, the in-vogue favorite, Bitcoin. BTCUSD was up nearly 4 percent at the day’s high, but has moderated recently. It is worth noting on a higher time frame, that net speculative positioning behind Bitcoin futures is holding near its heaviest net short position in 9 months.
Chart of Bitcoin BTCUSD, Bitcoin 1-Day and 30-Day Implied Volatility (Daily)
Source: TradingView
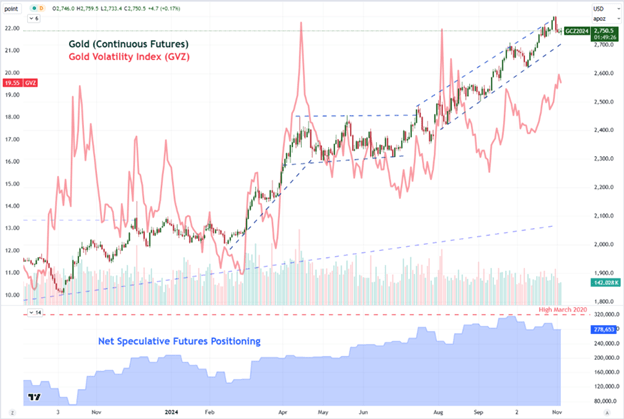
What about the old standard for the anti-currency ilk: gold? The precious metal is little moved on the day and it is actually sporting an exceptionally small range over the span of the last three trading days. This seems to suggest that there is reticence to push capital into the metal for safe haven purposes ahead of the election and its results. I wouldn’t say this is a sign that the markets have abandoned this market as an outlet for diversification, rather it is likely in reflection of the general level of gold itself. It is just off of record highs and is approximately 33 percent ‘more expansive’ from the start of the year.
Chart of Gold, Gold Volatility Index and Net Speculative Futures Positioning (Daily)
Source: TradingView
US Dollar Drops to Support
James Stanley, 15:15 EST (20:15 GMT)
I went over several setups around the US Dollar along with Gold, Bitcoin and Equities in today's webinar. The support zone that I looked at in that session and in the accompanying article has already come into play, and this spans between two Fibonacci levels at 103.32 and 103.46 in DXY. Notably, there hasn't been a daily close below the 200-dma since the last support test in this zone two weeks ago. As I went over in the webinar, this could be election driven but it could also be squaring up ahead of results flowing in as the US Dollar put in a massive run during the month of October, with strength in DXY seeming to align with higher odds of a Trump win. When Kalshi peaked at 65% in Trump's favor on October 29th, DXY set its current three-month high. For next levels on DXY: Support, 103.03, 102.55 Resistance 103.82, 104-104.07.

Source: TradingView
Know What Polls Are Reflecting
John Kicklighter, 13:30 EST (18:50 GMT)
There has been quite a lot of discussion over the past weeks about how polls are reflecting different results – and with it a lot of conspiracy around the accuracy and effectiveness of the numbers being circulated through different channels. It’s worth highlighting that different ‘polls’ reflect different aspects that may not be indicative of the probable outcome of the elections itself. So let’s make some distinction.
Social Media Polls
Like social media platforms themselves, there is an inherent bias that comes through when gauging sentiment from the collective (https://www.forex.com/en-us/us-presidential-election-2024/). In an ideal form, a platform like X (formerly Twitter) for example can be a reflection of the ‘town square’; but that doesn’t actually seem to be the case in practice. With X, Elon Musk’s wielding his own massive following can have significant influence as can the propensity from supporters of both candidates/parties to trend towards the extreme. Add to that the reality that these are also global platforms and not necessarily reflective of what Americans in particularly intend to do, and the deviation can be significantly different.
Chart of Share of Voice and ‘Popularity’ in Media

Source: FOREX.com, Acuity Trading
Betting Markets
If you are looking at the markets and where they meet event risk like an election, the perspective that having ‘skin in the game’ translates to a truer opinion of the masses tends to follow. It’s true that there is more at stake than just projecting an opinion in an open forum like an X, but that doesn’t necessarily represent the same sample set as the roughly 224 million eligible voting American population (according to the Bipartisan Policy Center). Beyond representing non-voters – both in the US and abroad – markets serve a function of hedging and speculation. Playing the outlier for a larger payoff isn’t the same as voting for a political outcome. That said, these types of markets have a stronger sway over sentiment than say the nascent polls on social media platforms. They are more frequently compared to standard political polls, with the cynical out there suggesting the attempt is to create momentum – or curb it – among people who are actually heading to the polls. In other words, fostering a ‘my candidate is so ahead or behind, that maybe I should just stay home’ sentiment.
Betting Probabilities on Elections from Kalshi

Source: Kalshi.com
National Polls and Aggregators
And then there are the traditional national polls conducted by statistical agencies often in conjunction with news agencies, universities or other such institutions. This is where the statisticians look for a randomly and indicative sample size of respondents – legally registered Americans typically – to give their intention (or actual vote if they voted early) to assess the larger probability of the outcome across the United States. This is a polling system actually focused on Americans and it attempts to reflect the larger population with a reasonable sample size. Its shortcomings though is in the ‘error’ quotient. While these polls calculate a range of error they can be in given that they are only looking at a very small subsection of the overall population, those margins can be much larger than pollsters intend. If they weren’t, polls and outcomes would always align – and they do not.
Chart of Aggregate National Polling Statistics from Nate Silver and 538

Source: projects.fivethirtyeight.com
EUR/USD 120min Chart
Michael Boutros, 13:30pm EST (18:30GMT)

Source: TradingView, Michael Boutros
Euro is extending into confluent resistance here at 1.0934/48- a region defined by the 38.2% retracement of the September decline and the March high-close. Note that the upper parallel converges on this threshold over the next few days and we’re looking for possible inflection off this mark.
Initial support along the median-line (currently ~1.09) with near-term bullish invalidation now raised to the 1.618% extension / 200DMA / June high-day close at 1.0871/79- losses should be limited to this threshold IF Euro is heading for a breakout with a topside breach / close above this pivot zone exposing longer-term trend resistance, currently just shy of ~1.10.
Bottom line: A good zone to reduce portions of long exposure / raise protective stops- losses should be limited to the lower parallel IF price is heading higher on this stretch with a close above 1.0950 needed to clear the way.
Dollar Weak and US Stocks Strong Heading Into Elections Day
John Kicklighter, 11:30 EST (16:30 GMT)
The US Presidential election has kicked off and it can be difficult to tell whether the markets are as anxious as the news headlines would insinuate the American population is around the outcome. History suggests that the outcome of these US elections does not exactly conform to an expectation of one party necessarily being better or worse for a market. Underlying fundamental trends – like risk sentiment, growth potential and interest rate regimes – seem to carry more weight and are harder to steer with changes in government…despite the promises the candidates make on the campaign trail.
Chart of S&P 500 Monthly Returns and VIX Volatility Index with Elections Highlighted

Source: FOREX.com, Acuity Trading
From the capital market, the S&P 500 has put in for a morning climb – advancing as much as 1.0 percent. There is chatter in social circles and via media channels to suggest that this is a reflection of shifting views of candidate standings, but there is little consistency in those opinion polls and the actual market movement itself. Perhaps that is a function of ‘news’ being so fragmented – as people chose their source and polls and draw an inconsistent message.
Anticipation is the most reliable factor in this event lead up, and that will likely work to keep an earnest trend from developing through today given that we won’t have key ‘battle ground’ early poll insights until after the market close. And, there is always the recent history of extended dispute and close outcomes which carry us into Wednesday and potentially even beyond. All that said, the one-day forward volatility index (VIX1D) doesn’t seem to show anticipation of exceptional levels of movement from the S&P 500 after the normal closure of the outcome – or perhaps this is baking in an extended process?
Chart of S&P 500 and 1-Day VIX Volatility Index (Daily)

Source: TradingView, John Kicklighter
On the currency side, the Dollar has been sinking back below its 200-day and 20-day simple moving averages (SMAs). Tehcnically, this looks like it is starting a turn of the strong bullish trend in October, but FX markets are as prone to broken momentum amid high profile event risk as capital markets. We should also factor in that we have a FOMC rate decision – expected to end with a -25bp cut – on Thursday. Beware, the Dollar may act as a reflection of the economy it prices, but it can also play the caretaker of a safe haven.
Chart of DXY Dollar Index (Daily)

Source: TradingView, John Kicklighter
Latest US Elections news
The information on this web site is not targeted at the general public of any particular country. It is not intended for distribution to residents in any country where such distribution or use would contravene any local law or regulatory requirement. The information and opinions in this report are for general information use only and are not intended as an offer or solicitation with respect to the purchase or sale of any currency or CFD contract. All opinions and information contained in this report are subject to change without notice. This report has been prepared without regard to the specific investment objectives, financial situation and needs of any particular recipient. Any references to historical price movements or levels is informational based on our analysis and we do not represent or warranty that any such movements or levels are likely to reoccur in the future. While the information contained herein was obtained from sources believed to be reliable, author does not guarantee its accuracy or completeness, nor does author assume any liability for any direct, indirect or consequential loss that may result from the reliance by any person upon any such information or opinions.
Futures, Options on Futures, Foreign Exchange and other leveraged products involves significant risk of loss and is not suitable for all investors. Losses can exceed your deposits. Increasing leverage increases risk. Spot Gold and Silver contracts are not subject to regulation under the U.S. Commodity Exchange Act. Contracts for Difference (CFDs) are not available for US residents. Before deciding to trade forex, commodity futures, or digital assets, you should carefully consider your financial objectives, level of experience and risk appetite. Any opinions, news, research, analyses, prices or other information contained herein is intended as general information about the subject matter covered and is provided with the understanding that we do not provide any investment, legal, or tax advice. You should consult with appropriate counsel or other advisors on all investment, legal, or tax matters. References to FOREX.com or GAIN Capital refer to StoneX Group Inc. and its subsidiaries. Please read Characteristics and Risks of Standardized Options.