Japanese Yen Talking Points:
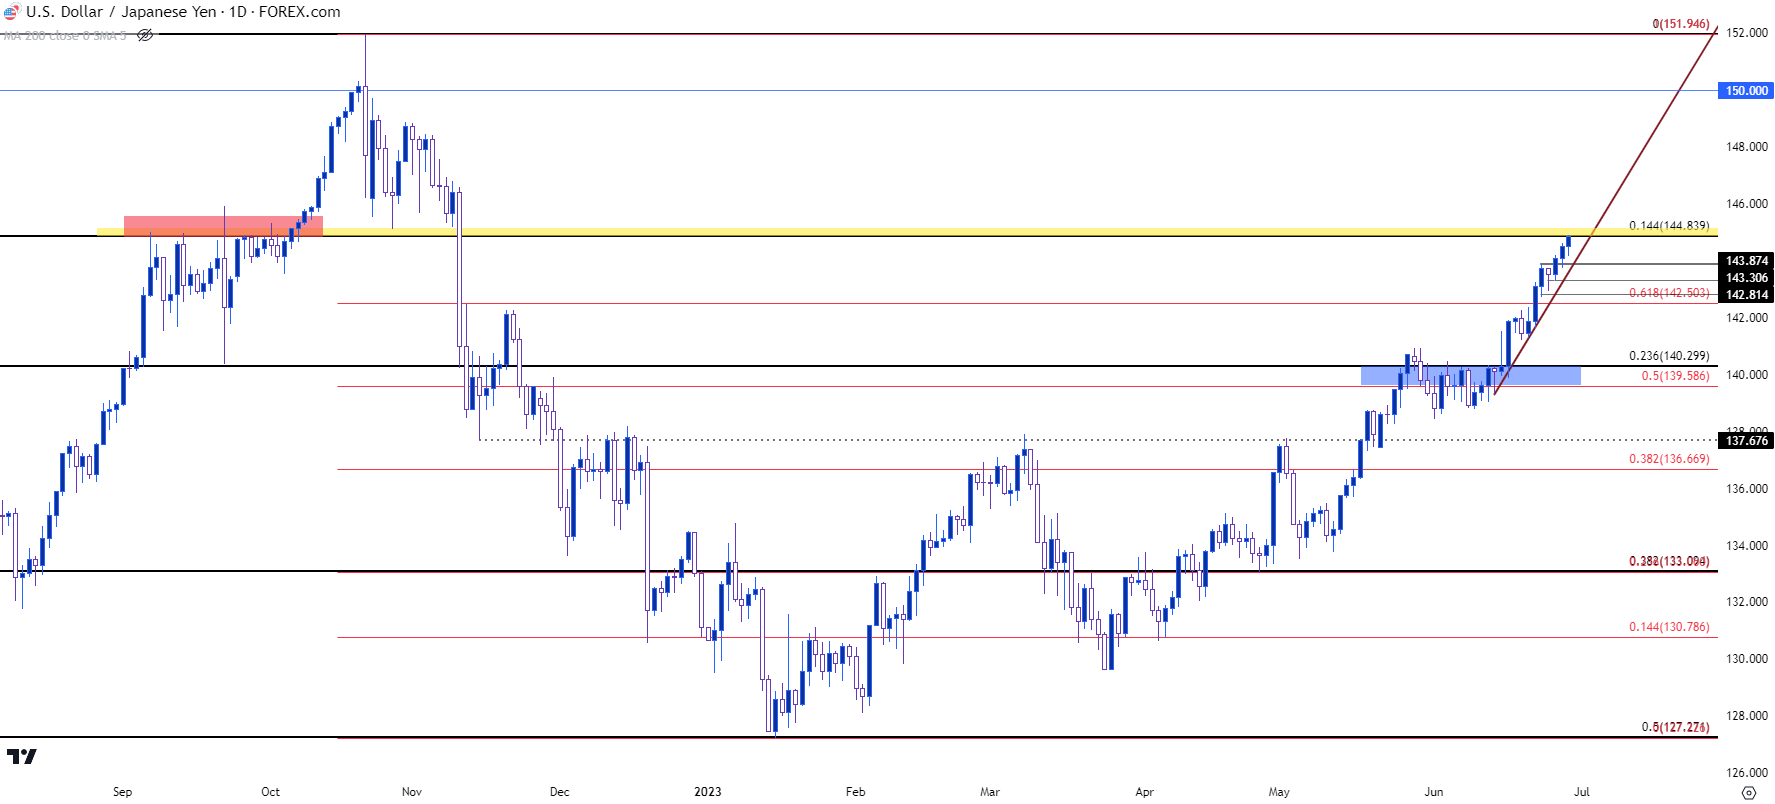
- Yen weakness has continued to drive against the US Dollar and the pair is now nearing a key level at the 145 handle, which was a big level during the advance last year as it stalled the move for about a month before bulls ultimately drove forward for a 150 test. And 150 was where the Ministry of Finance got active with intervention, helping to set the top in the pair for last year.
- To date, the Bank of Japan has shown no sign of change in their monetary policy even with inflation holding above 2%. As focus shifts towards more rate hikes from the Fed the carry trade has continued to drive bullish trends in the pair.
- I’ll be discussing these themes in-depth in the weekly webinar on Tuesday at 1PM ET. It’s free for all to register: Click here to register.
The carry trade has lived in as USD/JPY is pushing up for another fresh 2023 high, and getting very close to a key spot on the chart that played a large role in last year’s price action.
Last year saw the carry trade in full bloom as the Federal Reserve was hurriedly hiking rates as the Bank of Japan remained passive and dovish. That allowed for an aggressive topside trend to develop in the pair as USD/JPY went from below 115 in March to 145 in September. And 3,000 pips in a major currency pair is quite the move that could bring repercussion to the underlying economy; and as prices moved up to 145, speculation began to build that the Ministry of Finance in Japan might step in on the matter.
That did not happen at 145 last year, but it did happen shortly after. The 145 level, instead, stalled the advance for about a month as that price remained as resistance from September 7th of last year until October 6th, when price was finally able to build a daily breakout at that level. In short order USD/JPY had jumped up to the next major psychological level at 150 and that’s ultimately what helped to bring the intervention as the Ministry of Finance ordered the BoJ to intervene by buying Yen after the spike move above the 150 handle in October.
Well, now price is back at the 145 handle; well, almost, as today’s high currently shows at 144.90.
USD/JPY Daily Chart
 Chart prepared by James Stanley, USD/JPY on Tradingview
USD/JPY: Prints from the Past
So, last year the 145 level stalled the move as speculation or fear of intervention held bulls at bay for a month but, ultimately, it was the 150 level that brought the intervention hammer after the Ministry of Finance ordered intervention.
Will that same scenario play out at the same levels? It’s impossible to know at this point, but we have already started to hear from the MoF. Just a couple of days ago, Shunichi Suzuki said that the recent movement in USD/JPY was ‘one-sided and rapid,’ which is usually the type of comments that will be hinted at when the matter has gotten their attention. Suzuki said that the government would ‘take the appropriate response’ if the continued trend was deemed excessive.
While this doesn’t necessarily spell impending doom for bulls, it does highlight a theoretical cap to the trend until there may be some form of intervention action from Japan. Logically, traders will probably look to the blueprint of the past to determine where to begin to build those expectations.
The risk for bulls appears to be additional commentary about the prospect of intervention, such as we saw earlier this week. The trend in USD/JPY has remained strong and, well, fairly one-sided as bulls have continued to push with only a minimum of pullback of late. Those mentions of intervention have only been able to bring short-term pullbacks so far but, such as we saw last year, when or if the Ministry of Finance does order an intervention, the response could be massive.
The bullish trend in USD/JPY took 21 months to build into the October high last year; but it took only three months to wipe away 50%, with support eventually settling at the 50% mark of the 2021-2022 major move.
USD/JPY Weekly Chart
 Chart prepared by James Stanley, USD/JPY on Tradingview
USD/JPY Shorter-Term
The challenge with USD/JPY at the moment is how one-sided that trend has been as there’s been a minimum of pullback of late. And with price now re-testing an area that previously exhibited resistance, the question of continuation potential remains, particularly considering the possibility of a comment from a finance minister being able to provoke a sell-off.
And, paradoxically, that seems as if it might be the most attractive opportunity for bulls at the moment; for a comment from a finance minster to elicit a pullback in the pair. And if there’s a hold of support after that pullback with no clear signs of actual intervention, there could remain upside potential. But caution should be exercised as interventions, or threats of intervention, could bring on a host of unknown variables, both for market participants and governments and Central Bankers.
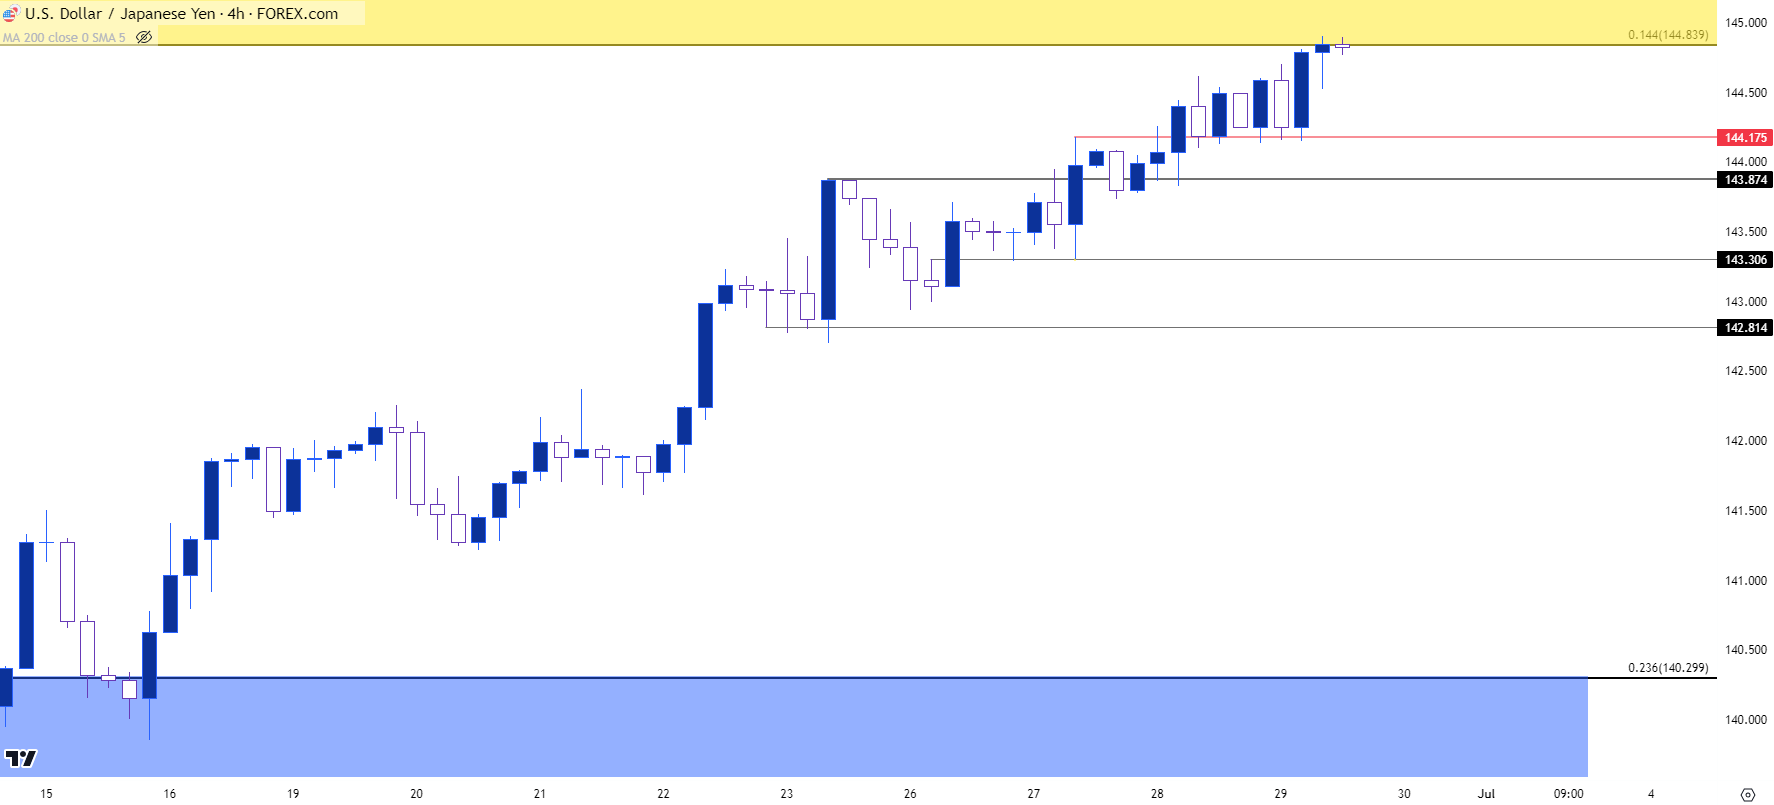
On the below four hour chart I’ve outlined some of the recent bullish structure with some possible levels of note for support potential.
USD/JPY Four-Hour Price Chart
 Chart prepared by James Stanley, USD/JPY on Tradingview
--- written by James Stanley, Senior Strategist


