
Japanese Yen Talking Points:
- The Yen has showed a push of strength recently, and that’s so far continued through early-December trade.
- The major of USD/JPY has shown bearish tendencies since the CPI report was released in November; but sellers haven’t had a clean ride, and price in the pair is currently holding a Fibonacci support level while building a falling wedge formation.
- I’ll be discussing these themes in-depth in the weekly webinar. It’s free for all to register: Click here to register.
USD/JPY put in a change of pace in November, and into last week’s close there remained a bearish lean as taken from the sequence of lower-lows and highs that had built. But so far this week, bears have been stymied, and price has built support at a key Fibonacci level while allow for the build of a falling wedge formation.
The resistance side of that formation is now confluent with the same 147.37 level that had held the lows twice over the past couple of months, so there is an element of resistance showing at prior support.
USD/JPY Four-Hour Price Chart
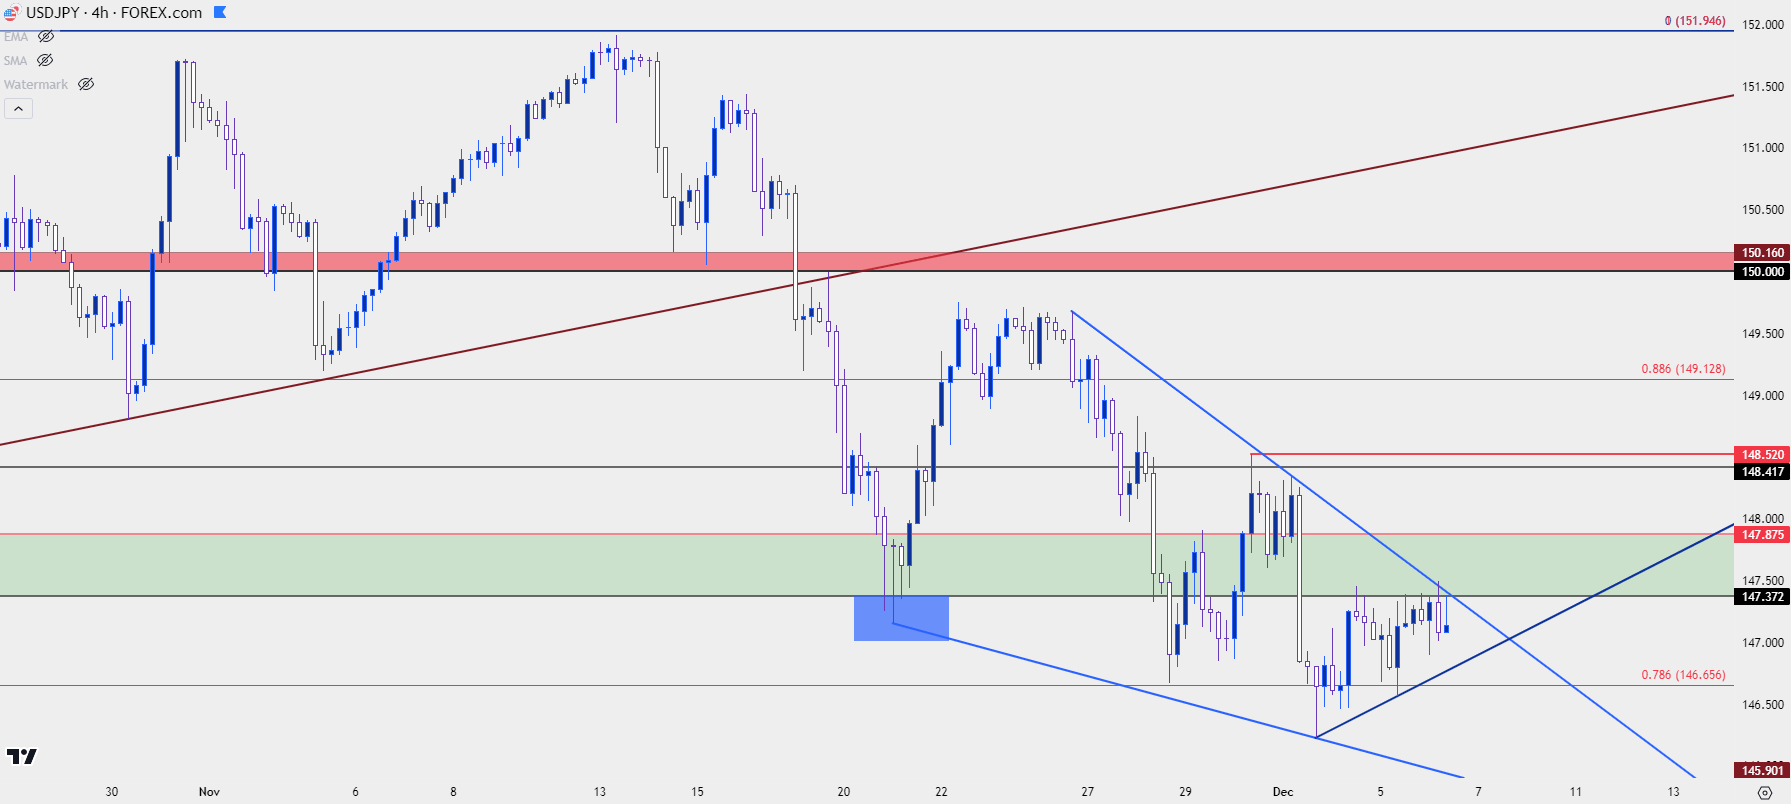 Chart prepared by James Stanley, USD/JPY on Tradingview
USD/JPY Bigger Picture
Bears have seemingly had an open door to make a push since that CPI report in November, and to be sure there was the start of bearish price action as price pushed back-below the 150.00 level.
But, unlike last year, when USD/JPY broke down in November on the back of a softer-than-expected CPI print (shown in a red rectangle on the below chart), sellers haven’t been able to show as much for run, as each step lower has been accompanied by a bullish response.
This happened the day after CPI, with a bounce coming in at 150, and then a week later at the 147.37 level. And most recently, this support build has shown around the 78.6% Fibonacci level from last year’s sell-off. This is quite a bit different from last year when bears pounced in November to elicit a breach of the 145 level, and that led into another two-plus months of weakness until price ultimately cauterized a low in mid-January.
From the daily chart below, we can see that sequencing of lower-lows and lower-highs to be still intact. The concern for bears would be the fact that the sell-off has slowed as that Fibonacci support started to come into the picture last Wednesday.
There’s also another form of support that came into play this week, as taken from the bullish trendline connecting March and late-July swing lows. This is displayed in black on the below chart.
USD/JPY Daily Price Chart
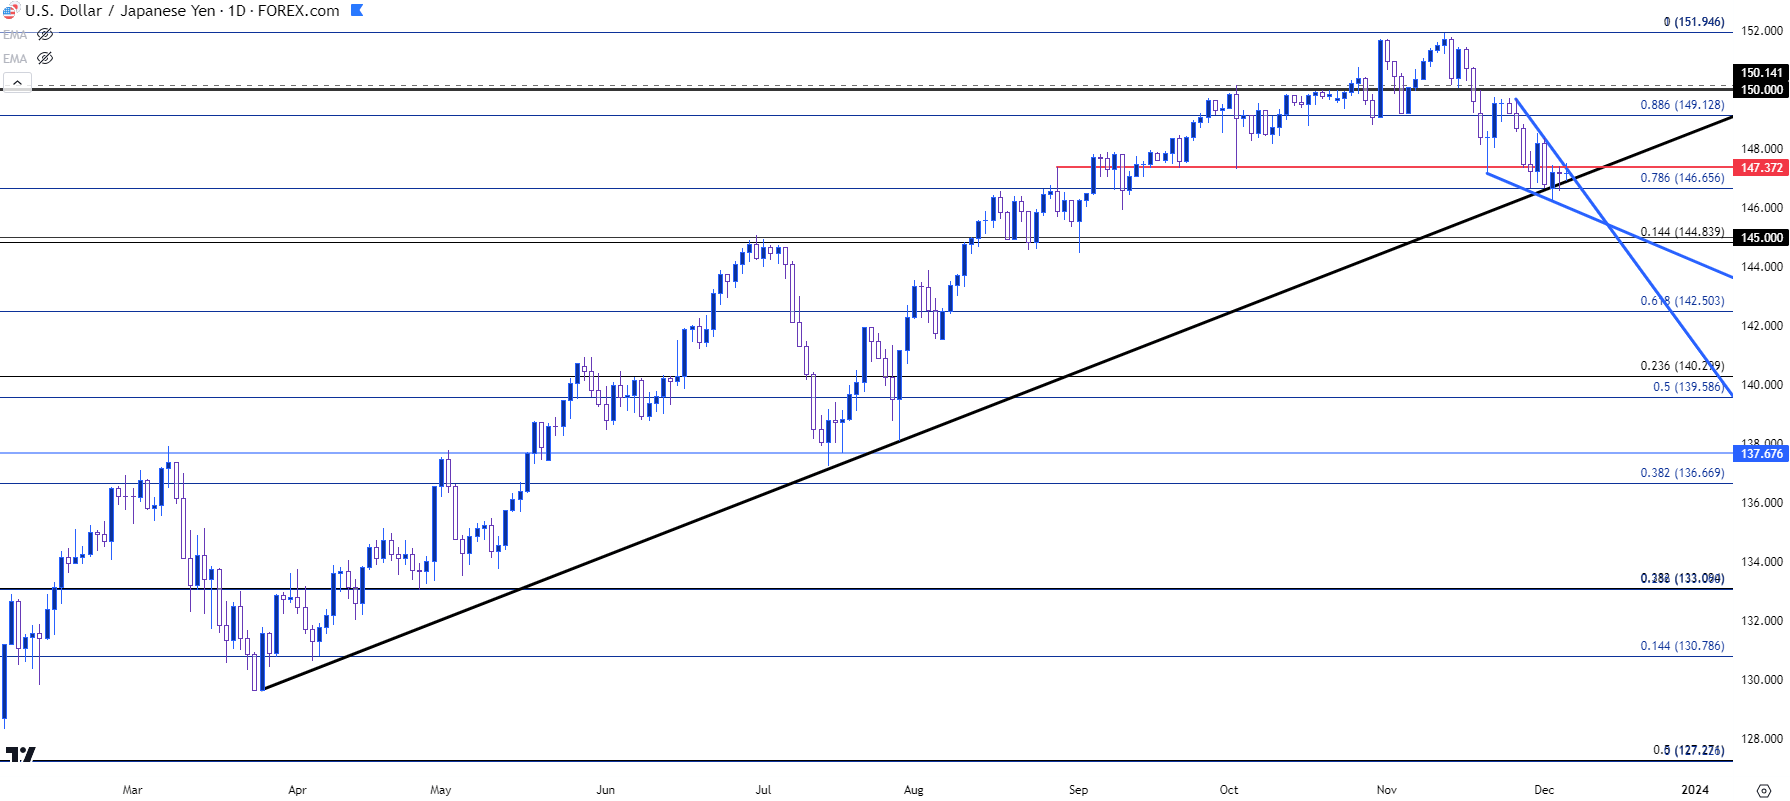 Chart prepared by James Stanley, USD/JPY on Tradingview
USD/JPY Bullish v/s Bearish
At this point there’s a few opposing items in USD/JPY. On the bullish side, there’s been a support hold over the past week that’s built a falling wedge, which is often approached with aim of bullish breakouts.
On the other side, bears made a big step last month by pushing back below the 150 handle, and that run was clean for a few days until support finally came into play which has stalled the move.
So, if there is fill on the shorter-term wedge formation, the focus goes to resistance to see if bears react with aim of continuing the short-side move. From the four-hour chart below, there are a few to work with. The price of 147.37 remains important and that’s what’s held the highs so far today. Above that is another prior price swing at 147.88 and that remains relevant, as well. Above that, 148.42-148.50 comes into the picture and if bulls can push through that, 149.13 appears before the prior swing around 149.70.
From the fundamental vantage point, it appears that there’s some relation with larger USD-trends. If the US Dollar is going to go deeper into a bearish state, as it did last Q4, then there could be motivation for carry trades to unwind which could further put pressure on the pair. But – if the USD is going to retain some element of strength as it has over the past week, along with this support hold in USD/JPY, there could be upside potential as the carry is still positive and rates in the US and Japan aren’t expected to change in the near-term. I talked about this relationship in-depth in yesterday’s webinar and much of that remains relevant a day later.
USD/JPY Four-Hour Price Chart
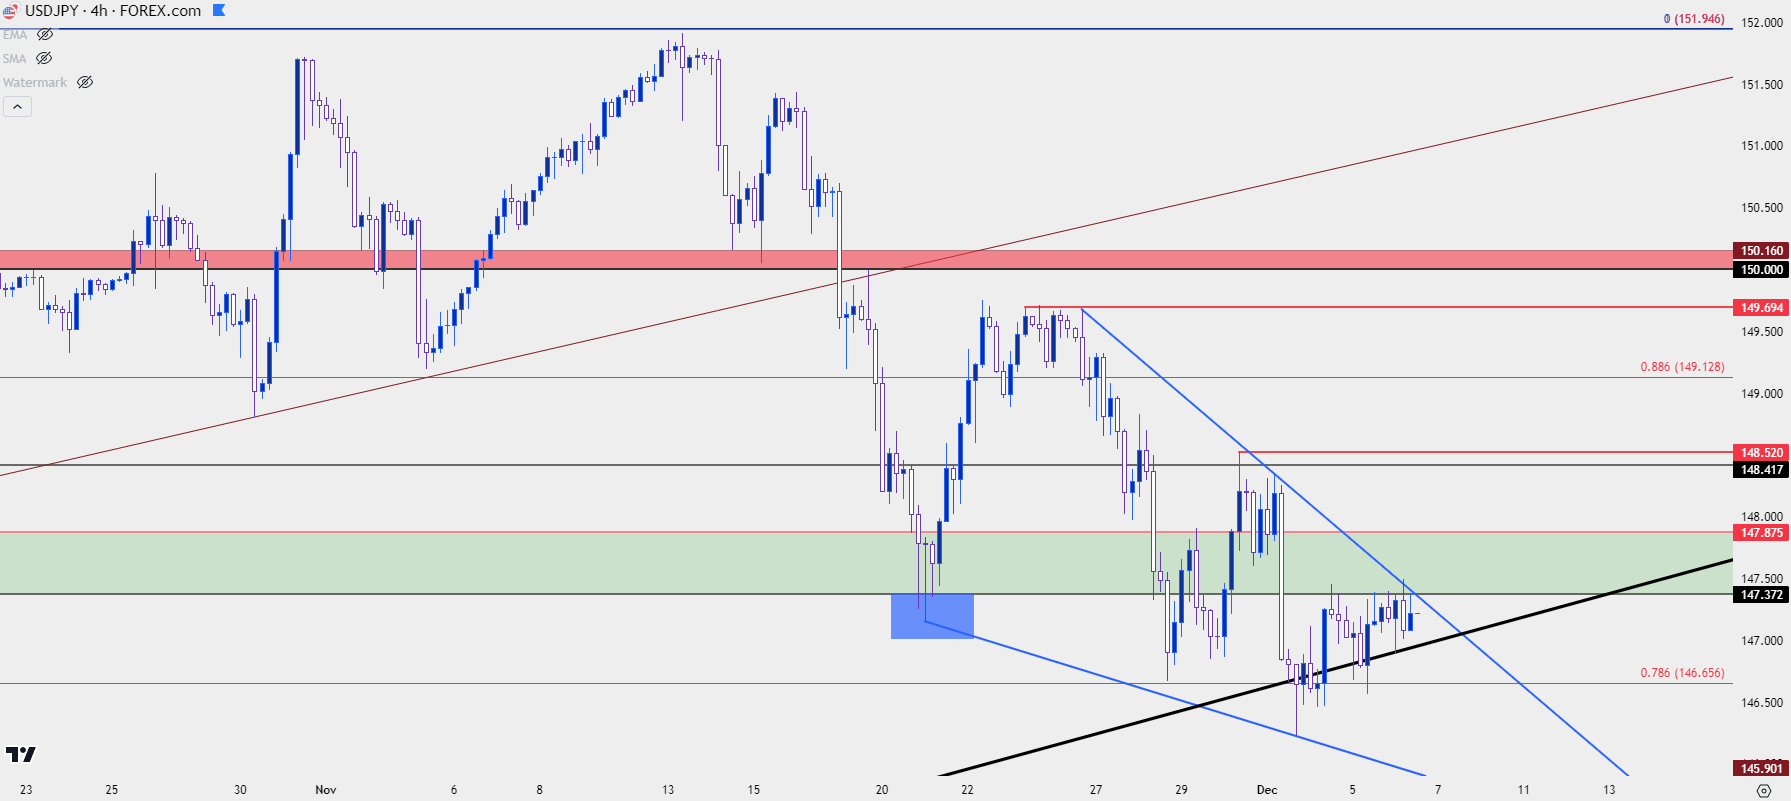 Chart prepared by James Stanley, USD/JPY on Tradingview
EUR/JPY
While the US Dollar has shown strength over the past week, the Euro has shown relative weakness. In EUR/JPY, the pair pushed up to a fresh 15-year high last month while making its first trip above the 160.00 psychological level since 2008.
There was even acceleration on the breakout, with price making a fast push towards 165 before finally topping at 164.31. But now that prices are pulling back the 160 level was a mere speed bump as the pair pulled back, which remains the case as of this writing. But there’s a confluent spot of potential support nearby and this runs from a longer-term swing level at 157.59, and it’s now confluent with a bullish trendline as taken from July and October swing lows.
That could be seen as a big test for bulls. A hold could keep the door open for a pullback to 159.62 while a failure from bulls would denote larger reversal potential in the pair. With the ECB looking to be finished with rate hikes, that fundamental drive could be a bit diminished below that of the USD/JPY setup as the Fed still can’t quite say that they’re done with hikes yet.
EUR/JPY Weekly Price Chart
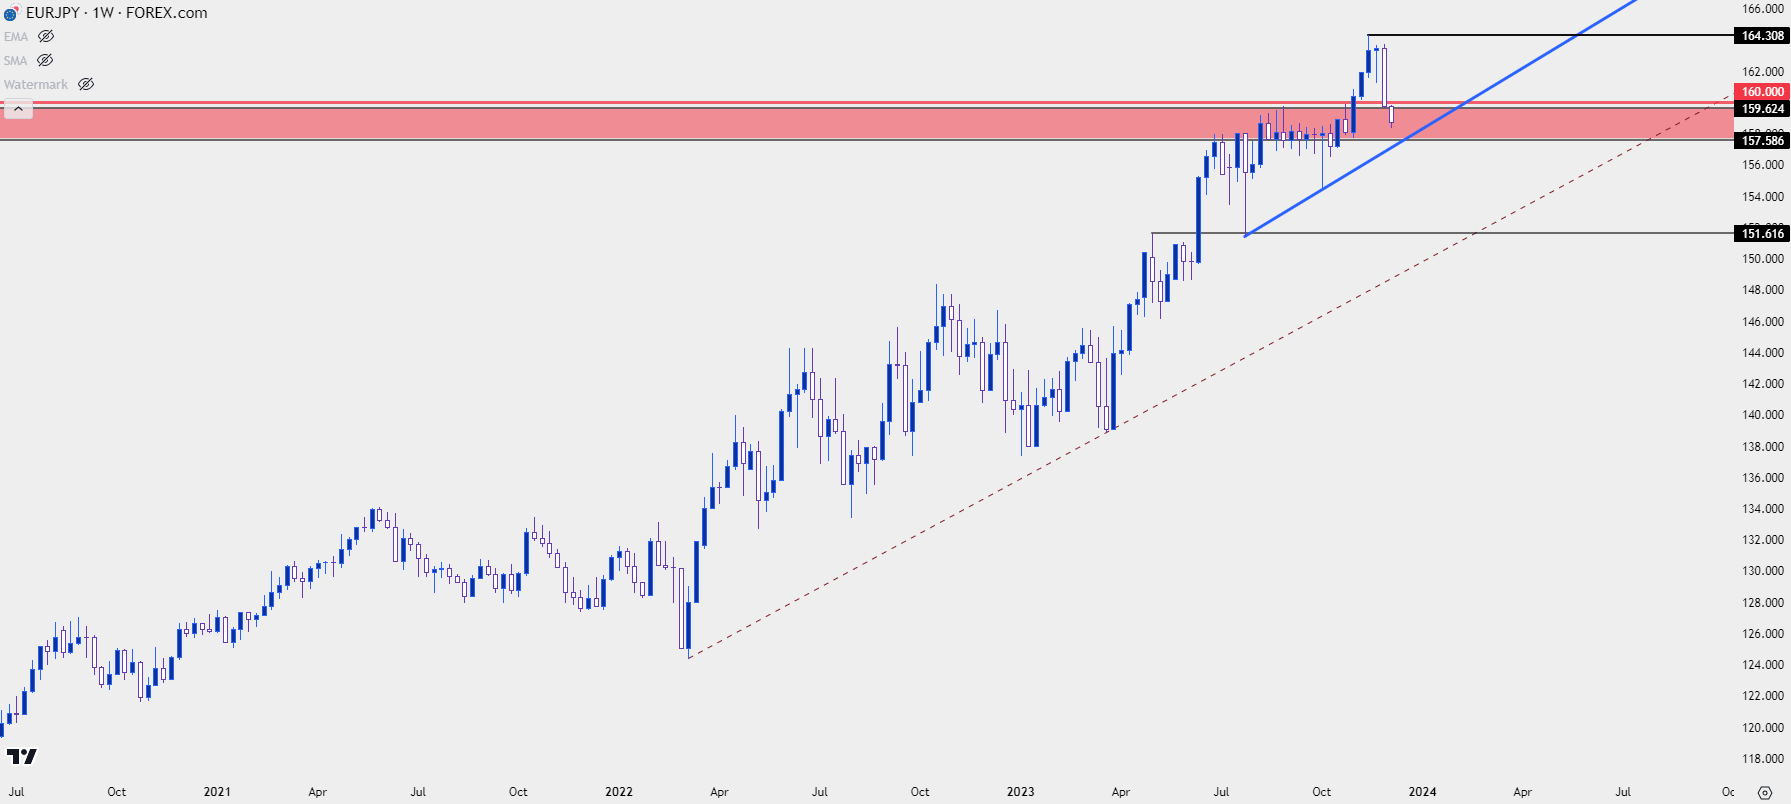 Chart prepared by James Stanley, EUR/JPY on Tradingview
GBP/JPY
GBP/JPY is also nearing re-test of a confluent support zone. The 185 psychological level had helped to set support through the first half of November and that allowed for a bullish push up to a fresh eight-year high.
The longer-term chart remains of interest here so I’ll start with a monthly . While EUR/JPY and USD/JPY have already set decade-plus highs, the same can’t be said for GBP/JPY, as the summer of 2015 showed a resistance test above the 195.00 handle. This was, of course, followed by the Brexit referendum which reset matters quite a bit. Similar to EUR/JPY above, the gap between August and September of 2008 created a zone and that’s what helped to hold the highs back in 2015.
From the monthly chart below, there even remains bullish trend potential for a re-test at that spot.
GBP/JPY Monthly Price Chart
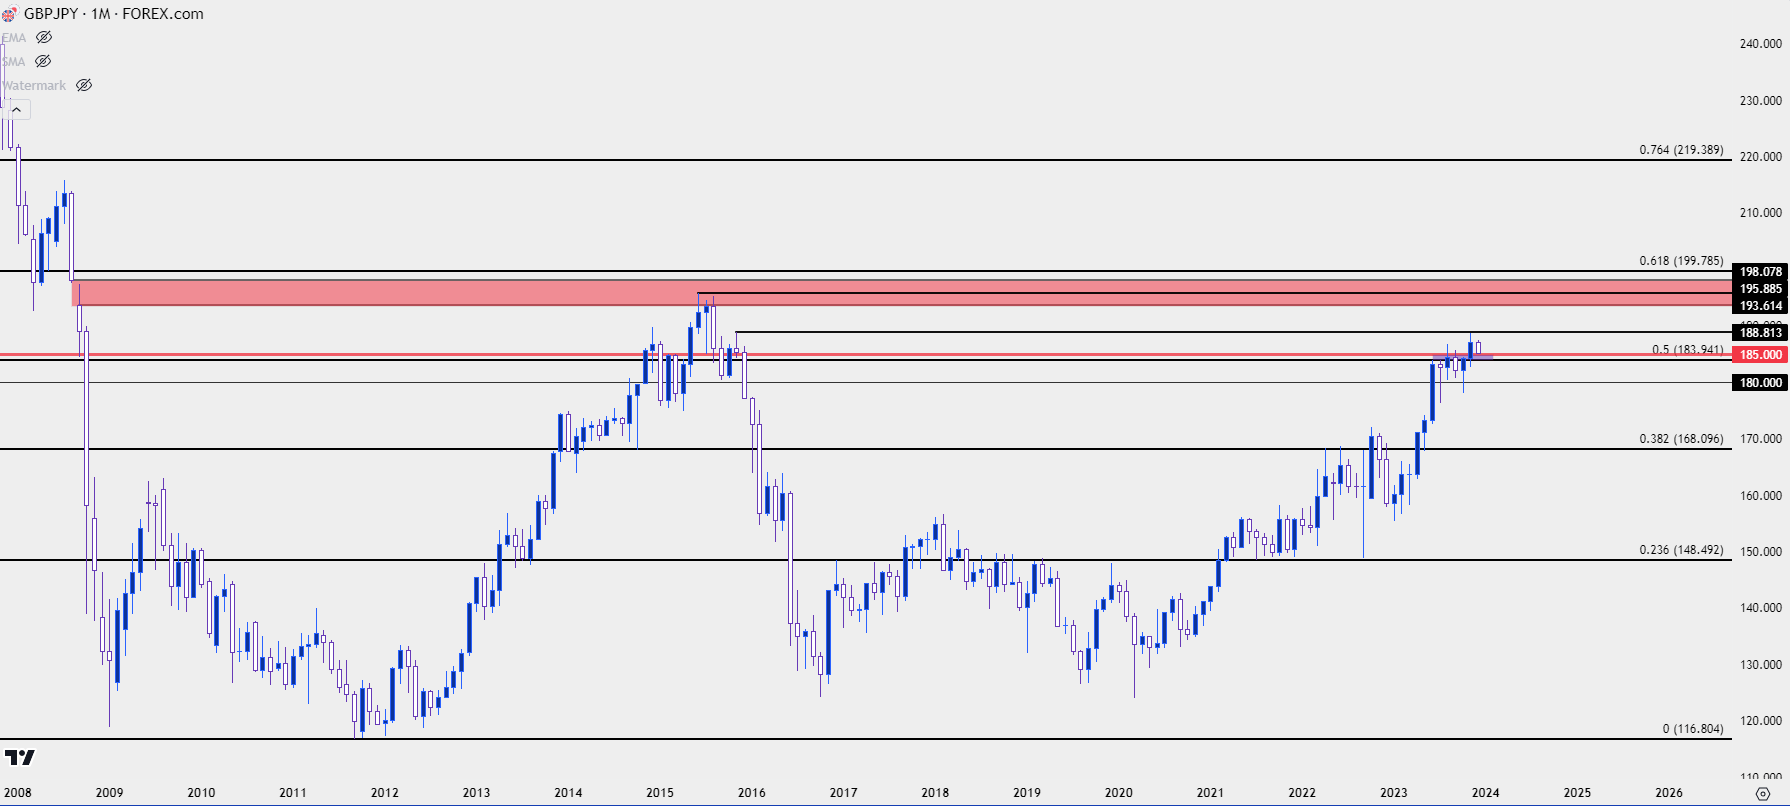 Chart prepared by James Stanley, GBP/JPY on Tradingview
From the below daily chart, we can see more contrast with EUR/JPY as GBP/JPY is re-testing a support level that was in-play two weeks ago, while EUR/JPY is currently trading at a fresh monthly low. The 185.00 level marks the top of a zone that extends down to 183.94, which is the 50% retracement of the long-term major move in the pair. Perhaps more importantly than the theoretical is the fact that this price came into play to hold the highs for about a week in July, leading to a 700+ pip pullback.
If bears can dig below 185.00, the next spot of interest would be around that 183.94 level, and if sellers can evoke a break, particularly a closed daily or weekly candle, then the picture could grow more bearish.
GBP/JPY Daily Price Chart
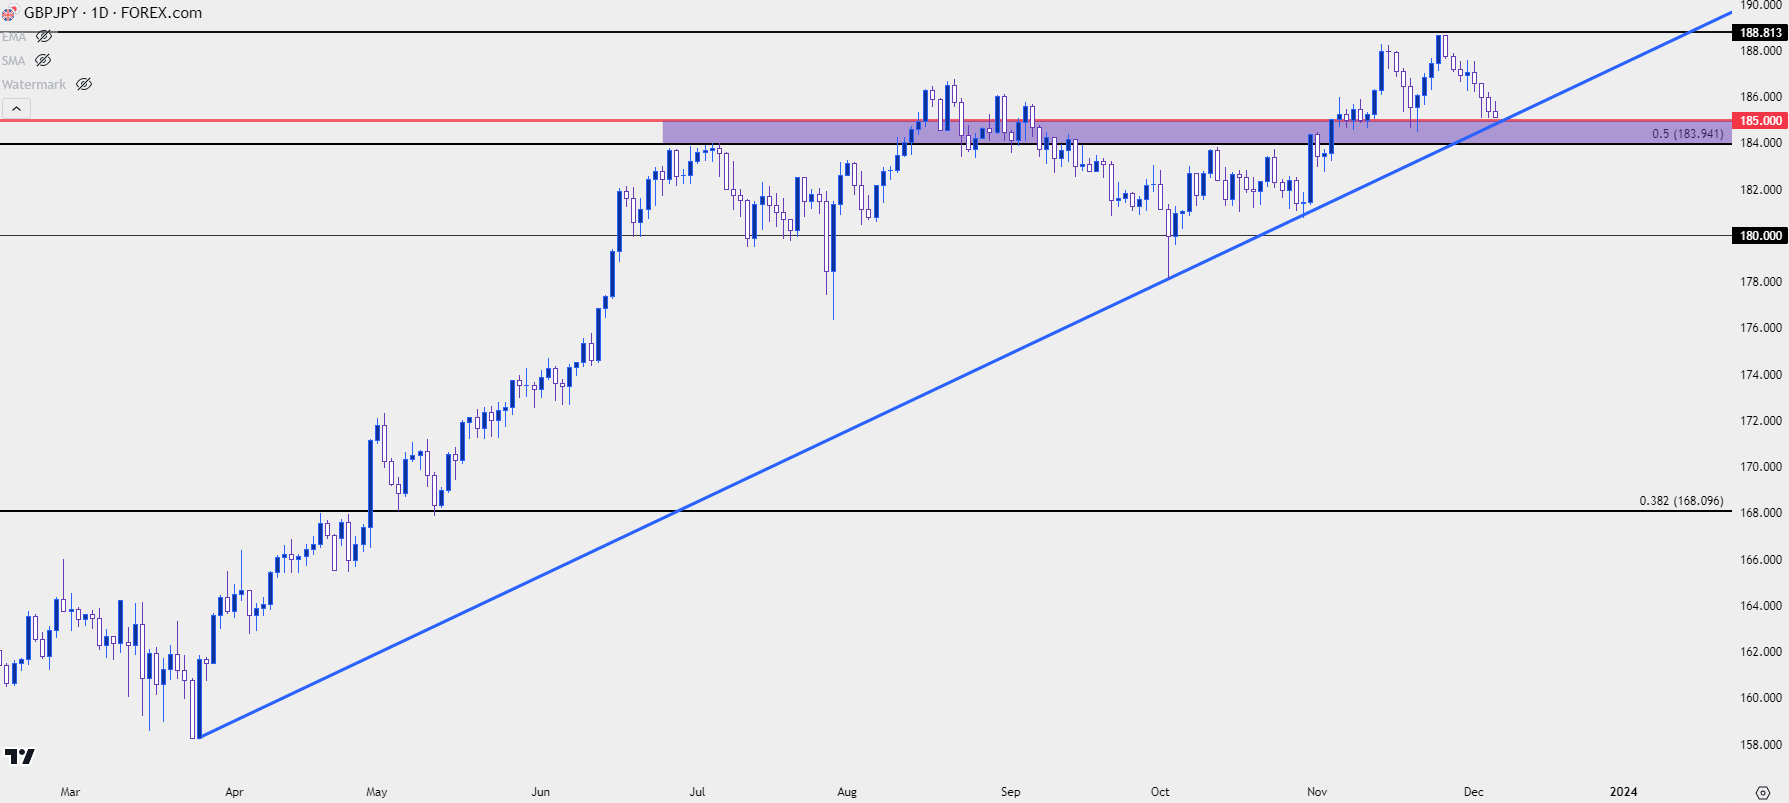 Chart prepared by James Stanley, GBP/JPY on Tradingview
--- written by James Stanley, Senior Strategist


