
Japanese Yen Talking Points:
- USD/JPY showed indecision this week but Yen-weakness remained in EUR/JPY, GBP/JPY and AUD/JPY.
- While USD/JPY continues to be the focal point given the geopolitical intrigue there’s been strong tendencies of bullish continuation in EUR/JPY, GBP/JPY and AUD/JPY. I look at each below.
- I’ll be discussing these themes in-depth in the weekly webinar. It’s free for all to register: Click here to register.
As the week winds towards the close it was an outlay of indecision in USD/JPY. This counters the weakness that was seen in the US Dollar after Core CPI printed at fresh three-year-lows, but that’s not to say that there weren’t bearish tendencies that appeared in USD/JPY throughout the week. On the back of that CPI print USD/JPY had given up more than 300 pips from the Tuesday high to the Thursday morning low. This recovered along with the USD on Thursday but as the USD pulled back on Friday, so did USD/JPY.
At this point the monetary divergence between the US and Japan remains of note and as I had said on the Tuesday webinar, I expect USD/JPY to trade like an amplified version of the US Dollar, and that statement can span both sides of the matter.
If USD weakness continues to show as the bigger picture range fills-in, then carry traders holding long USD/JPY positions could be motivated to take profits, fearing a larger possible reversal. And as we saw in Q4 of 2022 and 2023, that impact can be massive. I wrote about this on Wednesday as the push point for both of those episodes showed after US CPI prints in November of each of the past two years, and in both cases, it was below-expectation US CPI prints that gave bears a shot-in-the-arm.
On the long side, the carry remains positive on the long side and negative on the short side, thereby serving as a form of incentive to bulls and detriment to bears. If there’s not an impending fear of a deeper sell-off in the US Dollar, that can motivate buyers to jump back in the pair to capture the carry. And the very act of bulls jumping on the long side can increase demand which can then push prices-higher. This is what we saw in January of each of the past two years and invariably, that’s a part of what drove USD/JPY to its current 37-year highs.
USD/JPY Monthly Price Chart
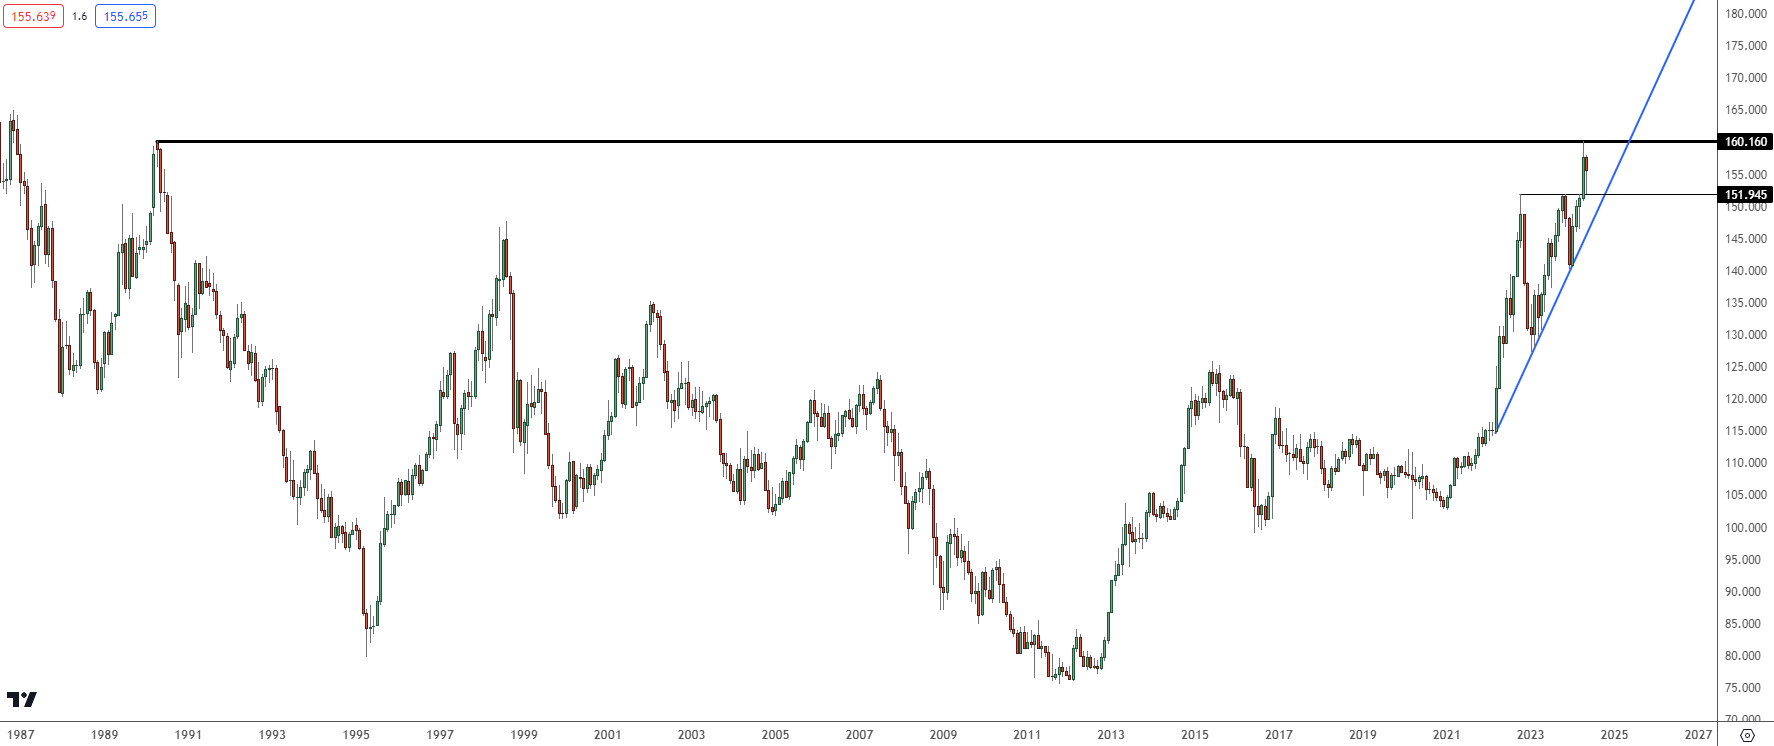 Chart prepared by James Stanley, USD/JPY on Tradingview
USD/JPY Weekly
As noted above the weekly bar shows indecision and this highlights a couple of important boundaries on the pair.
Above price the 160.00 level looms large, and this is the spot that we know was defended by BoJ intervention a couple of weeks ago. And, reasonably, that could lead to additional intervention if it does come into play.
On the underside of current price is the 150-152 zone of prior resistance, with the latter price having served as the prior spot of BoJ intervention when they jumped into defend the Yen back in 2022. That level came into play briefly a week ago, around the release of the NFP report, at which point bulls made a resounding return into the market. The bounce from that support inflection eventually ran as high as 492 pips off the lows, until we approached the US CPI report from last week.
USD/JPY Weekly Price Chart
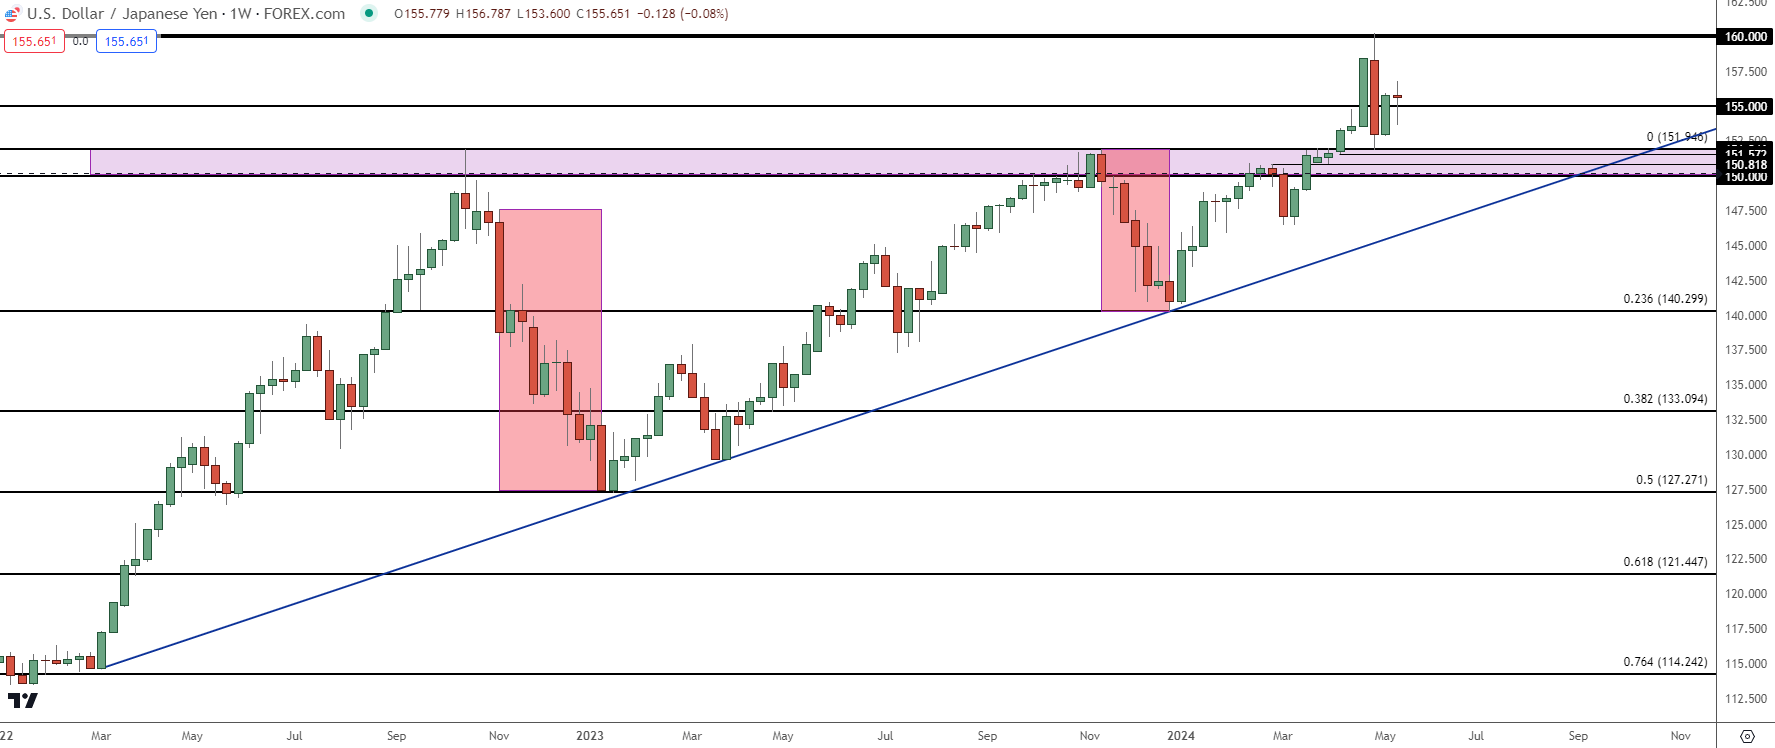 Chart prepared by James Stanley, USD/JPY on Tradingview
USD/JPY Shorter-Term
From the daily chart we can see what’s been a generally bullish bias continuing to price in since the pullback off of 160.00. Eight of the past ten daily bars have been green, illustrating that impact. But – it hasn’t been all green, and to my earlier point, on Wednesday, the day of US CPI, the US Dollar was down by -0.73% on the day and -0.92% into the Thursday low; meanwhile USD/JPY was down by -0.98% on Wednesday and -1.8% to the Thursday low.
So, if we do see a continuation of USD-weakness, there could be further impact and that could soon bring on re-test of the 150-152 zone of longer-term support as taken from prior resistance.
USD/JPY Daily Price Chart
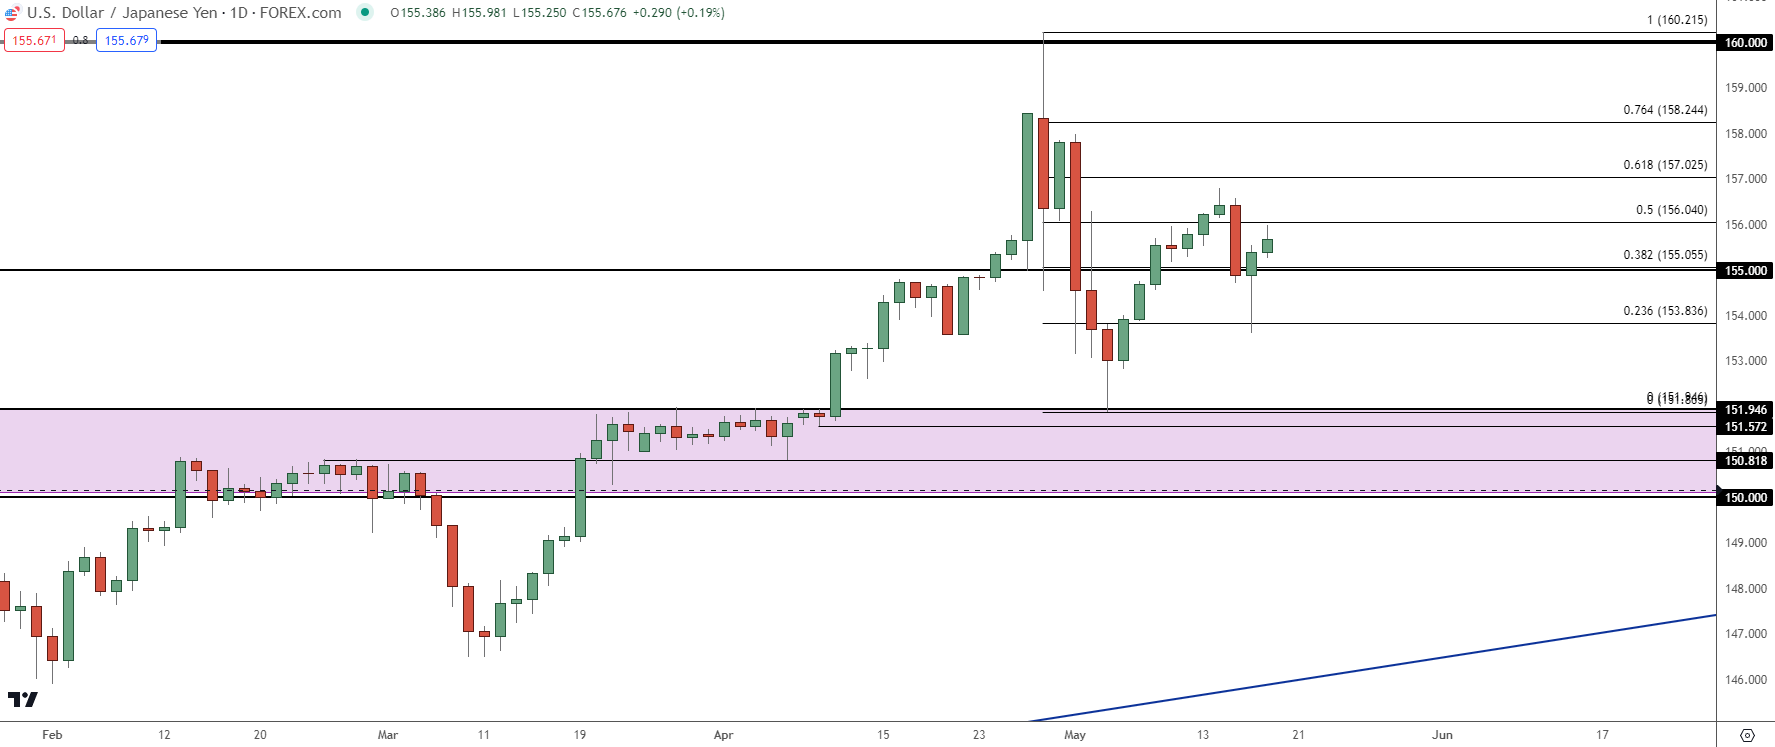 Chart prepared by James Stanley, USD/JPY on Tradingview
EUR/JPY
While USD/JPY finished the week with indecision, EUR/JPY continued to show strength. There was a similar albeit milder pullback on Wednesday in the pair and bulls returned in a big way, pushing a hammer formation on the Thursday daily bar. That strength continued through Friday trade with price squaring up to a key spot of resistance at 169.40.
There’s one more major spot of resistance overhead and that’s the psychological level of 170.00 but, notably – that price did not stand in the way of the breakout in late-April.
When the BoJ jumped in to defend the Yen, it was the 160.00 spot in USD/JPY that they seemed concerned with rather than the 170.00 level in EUR/JPY.
EUR/JPY Daily Price Chart
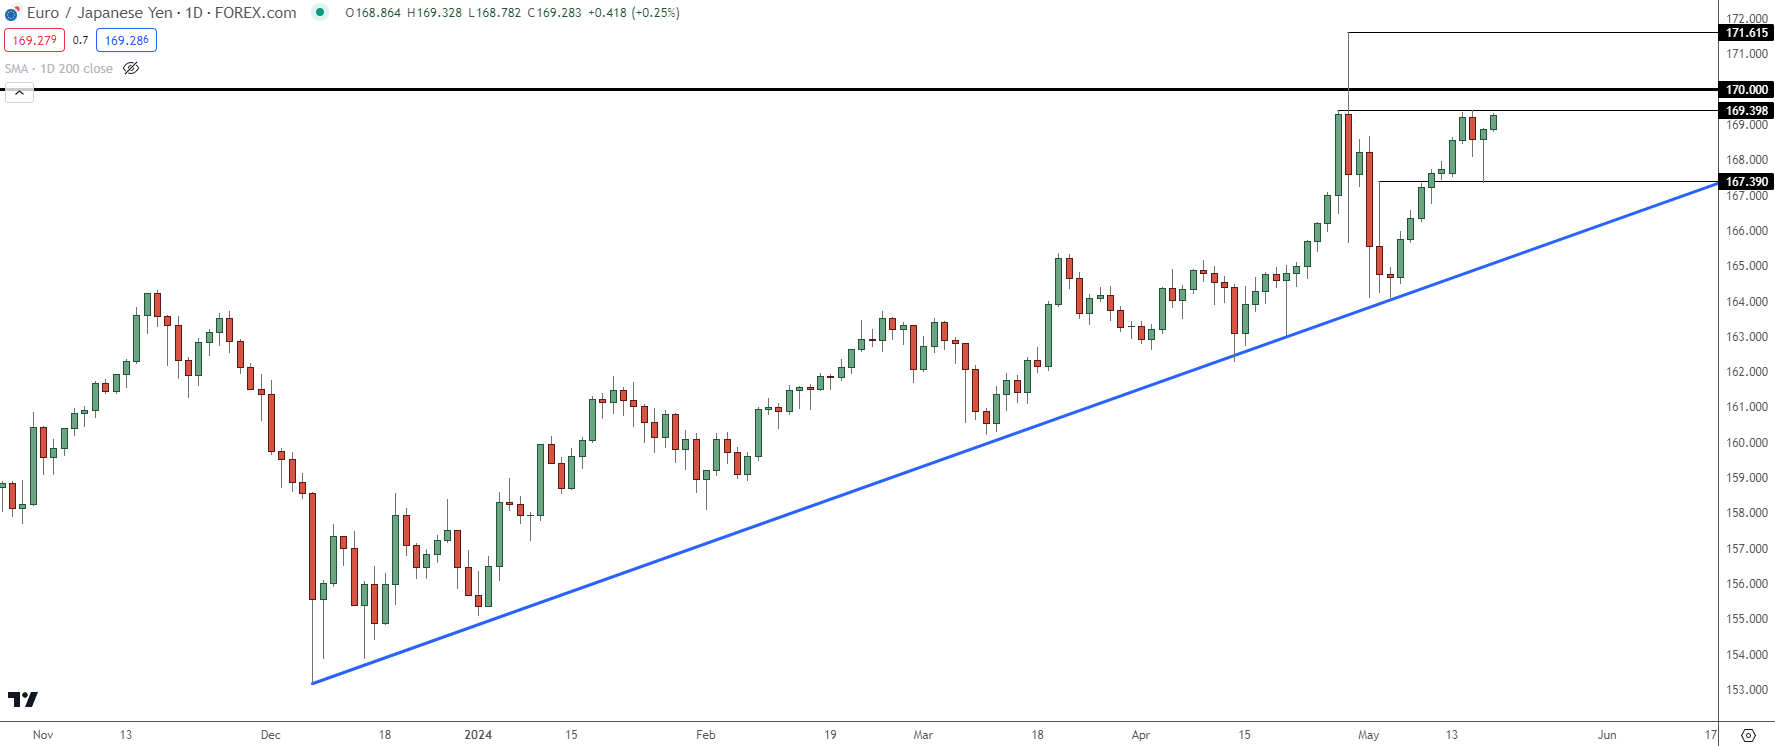 Chart prepared by James Stanley, EUR/JPY on Tradingview
GBP/JPY
GBP/JPY has been very strong of late with only one red bar in the past two weeks, and that was on the day of CPI. And similar to the above comparison between EUR/JPY and USD/JPY, the pullback here was even more mild as Wednesday showed a total loss of -0.24% and -0.97% down to the Thursday low.
And while EUR/JPY is showing resistance around the weekly high that was in-play on Tuesday, GBP/JPY has jumped past it’s own Tuesday high and is heading for a re-test of 198.08, which is the top of the gap from back in 2008.
GBP/JPY has shown even more strength than EUR/JPY and this could be a more attractive venue for Yen-weakness scenarios. Above 198.08 is the 200.00 psychological level, which only traded briefly before the intervention drove a 900+ pip pullback.
GBP/JPY Daily Price Chart
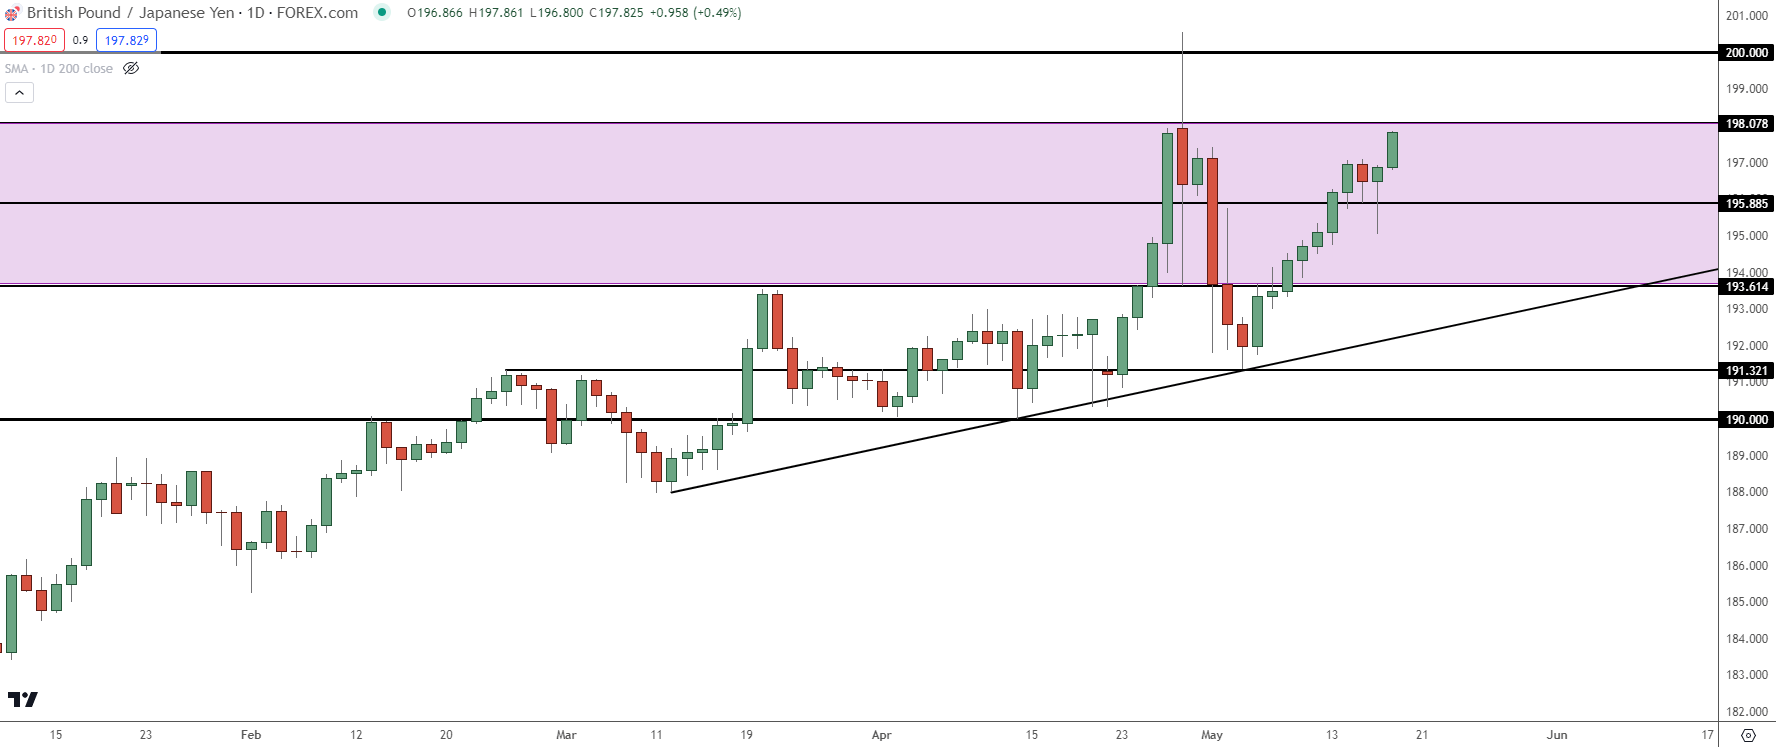 Chart prepared by James Stanley, GBP/JPY on Tradingview
AUD/JPY
Continuing that relationship above, AUD/JPY has been even stronger than GBP/JPY and EUR/JPY of late. As a case in point, AUD/JPY was green on Wednesday as all three of the markets looked at above were red. And there’s a bit of longer-term intrigue, as well, with AUD/JPY nearing re-test of the 105.00 level, which hasn’t seen a monthly close above since November of 2007.
AUD/JPY Monthly Price Chart
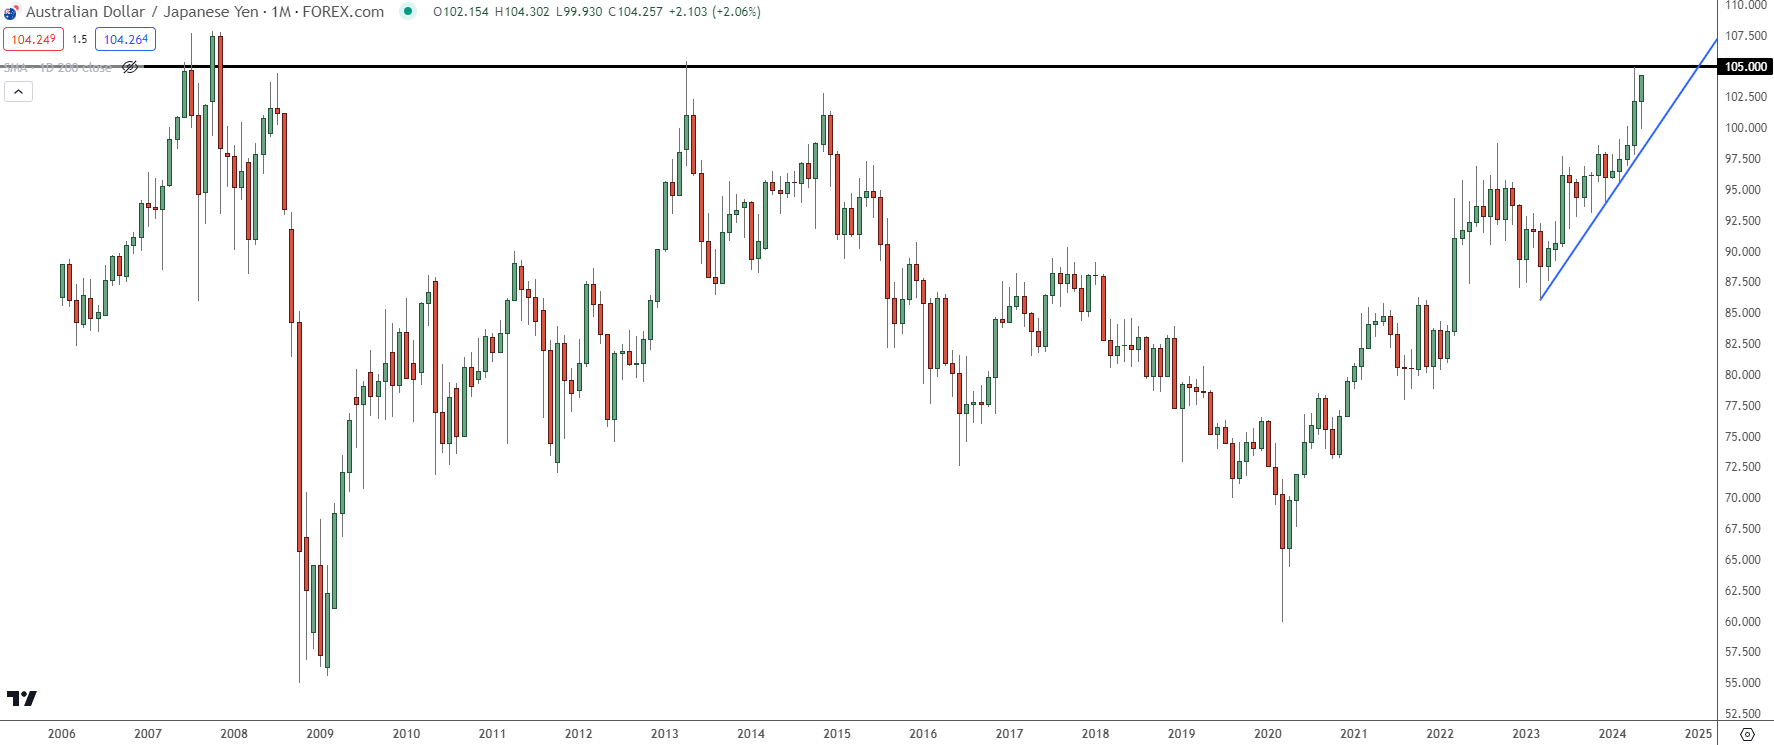 Chart prepared by James Stanley, AUD/JPY on Tradingview
As another illustration of that strength, AUD/JPY is already trading above pre-intervention levels while each of the above markets are still recovering up to their own pre-intervention levels.
The 105.00 handle looms large here as that was the high before the pullback saw 500 pips taken out in short order. The 100 level showed as support after the intervention-driven sell-off and for this week, it was 102.90 that came into play to help hold the lows on Thursday.
AUD/JPY Daily Price Chart
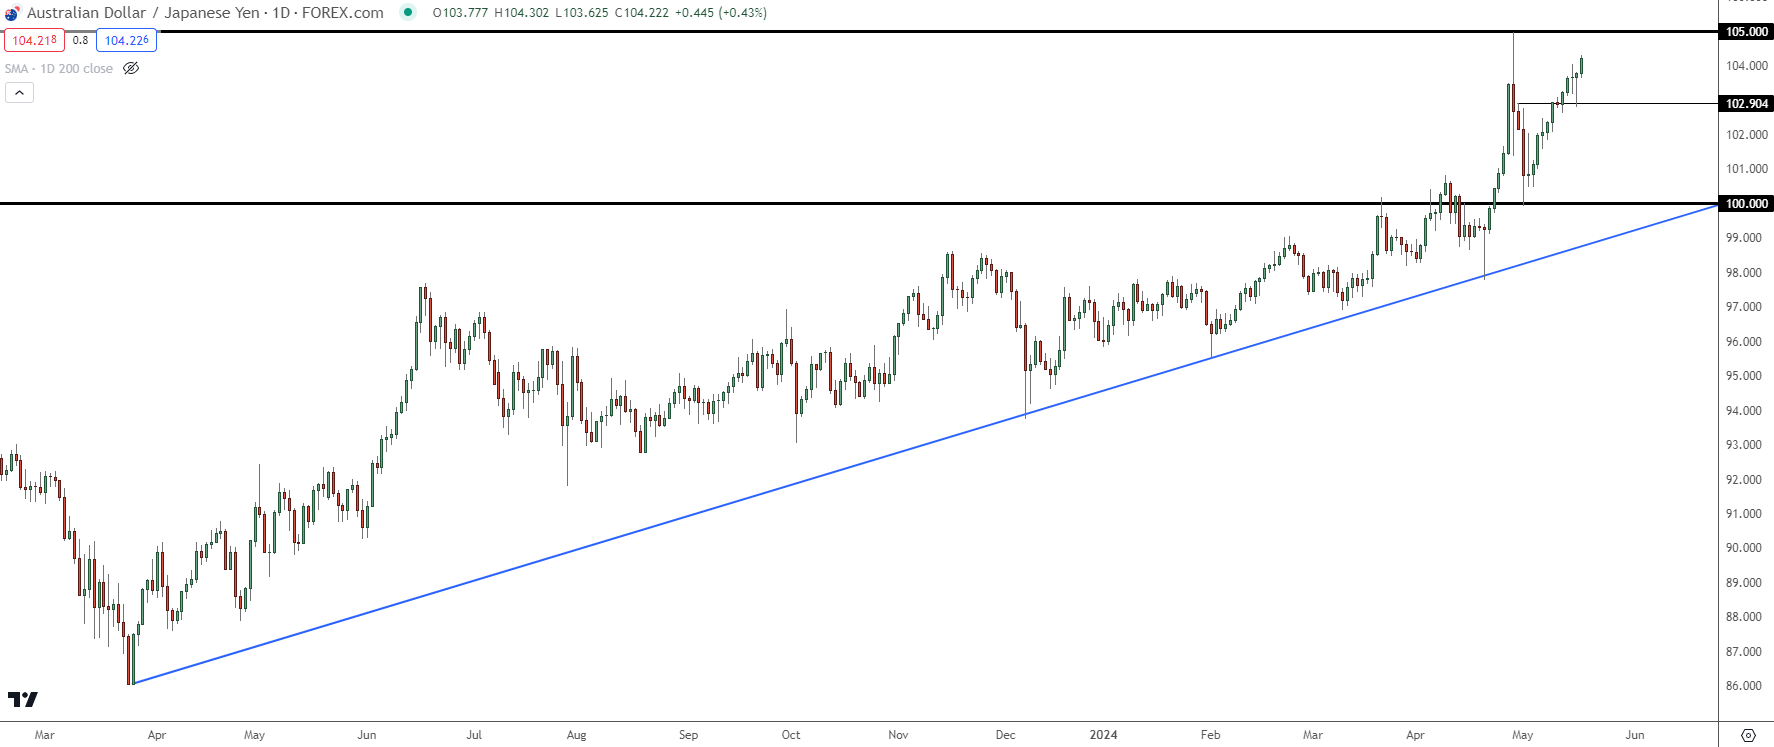 Chart prepared by James Stanley, AUD/JPY on Tradingview
--- written by James Stanley, Senior Strategist


