
Japanese Yen Talking Points:
- The Bank of Japan hiked rates and left the negative rate regime last week, and so far, there’s been a minimum of turmoil around the move
- With USD/JPY making a fast move back up towards the 152 handle the big question for next week is Yen-tervention, and whether the Finance Ministry will allow USD/JPY to trade above 152 or whether they’ll intervene as they had in Q4 of 2022.
- While the BoJ did hike rates, Japanese rates remain far-below that of many other developed nations and this retains potential in carry trades given that rate divergence, along with the fact that the Fed, ECB and BoE don’t yet appear ready to cut rates.
The Bank of Japan hiked rates for the first time since 2007 this week. And, so far, there’s been a minimum of turmoil around the move. It looks like the BoJ has successfully lifted off given that lack of collateral damage, but traders should be cautious of claiming victory just yet as there remains several risks on the horizon. And for the Yen, the move has led to a run of weakness against the U.S. Dollar that’s pushed the USD/JPY pair very near the same resistance that the Finance Ministry had defended in the past, just inside of the 152.00 level.
While the BoJ did adjust rates, it also sounded as though there may be a slow approach to any future rate hikes and that provides somewhat of a cap on the excitement. The move away from -0.10% to +0.10% provides only minor change to rate differentials and given that the BoJ held bond purchases at the same amount, it seems they made this move almost as carefully as they could.
And with the U.S. not yet ready to cut rates, that carry trade dynamic continues to push the long side of USD/JPY. The big question now is whether the Japanese Finance Ministry will show the same defense of the 152.00 level that they’ve done over the past couple years, ordering an intervention in 2022 and threatening the same in 2023 and again earlier this year. With inflation in Japan pulling back over the past few months, JPY weakness may help to bring that back, to a degree, so the question remains as to how aggressively they may want to fight it; or whether they’d allow a topside breakout to 155.00.
From a purely technical standpoint – the below chart is something that would generally be considered supportive of bullish breakout potential. There’s an increasing frequency of tests around the 152 level and each successive attempt has been met with a higher-low, indicating a diminishing marginal impact of that resistance zone. Of course, there’s been an exogenous factor of consideration given that prior intervention which has helped to establish that resistance. So, the question here is whether there’s change at the Finance Ministry.
Given how long that resistance has held, then there’s probably some stops sitting above 152.00. Stops on short positions are buy-to-cover order logic, which means an influx of demand could hit the market upon that print of fresh highs. That could lead to a continuation in the move, and this is one of the reasons that a well-defended resistance level yielding to breakout can often push into a sharp topside move.
USD/JPY Daily Price Chart
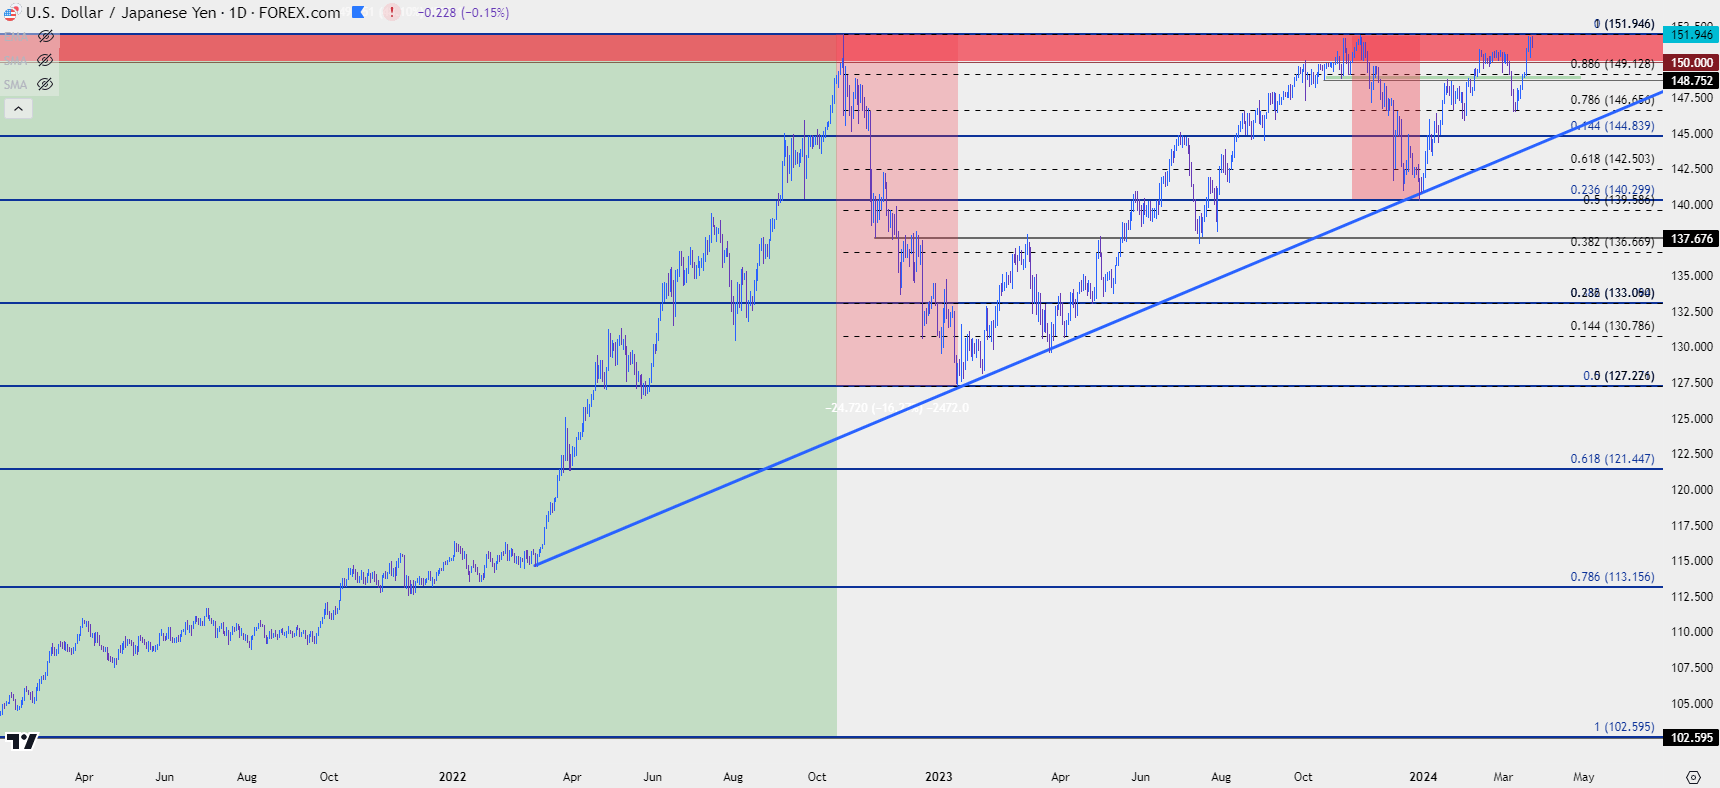 Chart prepared by James Stanley, USD/JPY on Tradingview
Going down to shorter-term charts similarly illustrates strength since the rate decision early last week. It was around the rate hike that USD/JPY pushed back into the 150-152.00 zone, and there were two higher-lows supported after that move. This sets the stage for another showdown at the 33-year high of 151.95 and that big question is whether the Finance Ministry opines on the matter next week. Even the threat of intervention could be enough to hold the high. But whether it brings reversal or deeper pullback remains a bigger question, as it was USD-weakness that ultimately helped to unwind that trend in Q4 of 2022 and 2023, while intervention (or the threat thereof) was simply enough to pause the move-higher.
There’s a valid case for them avoiding the topic for now: The BoJ has just hiked rates for the first time since before the Financial Collapse, so change is already afoot around Japanese economics. Inflation via CPI has been softening, although it was the prospect of wage growth that compelled the BoJ to move; but given the ‘lost decades’ of Japan and their history with deflation and disinflation, bringing some inflation back to see CPI at 3% or higher might not seem to be the worst risk to Japanese policymakers.
So, perhaps that line-in-the-sand shifts to 155.00 or so, particularly if market participants continue pushing long USD and short JPY to the point where ordering an intervention seems a simple waste of finite capital reserves. But that’s a theme we’ll have to wait on for next week.
From the chart, there’s clear resistance overhead at 151.95, and support plots at a few different confluent spots below 150.00, at 148.81, 146.66 and then 145.98.
USD/JPY Daily Price Chart
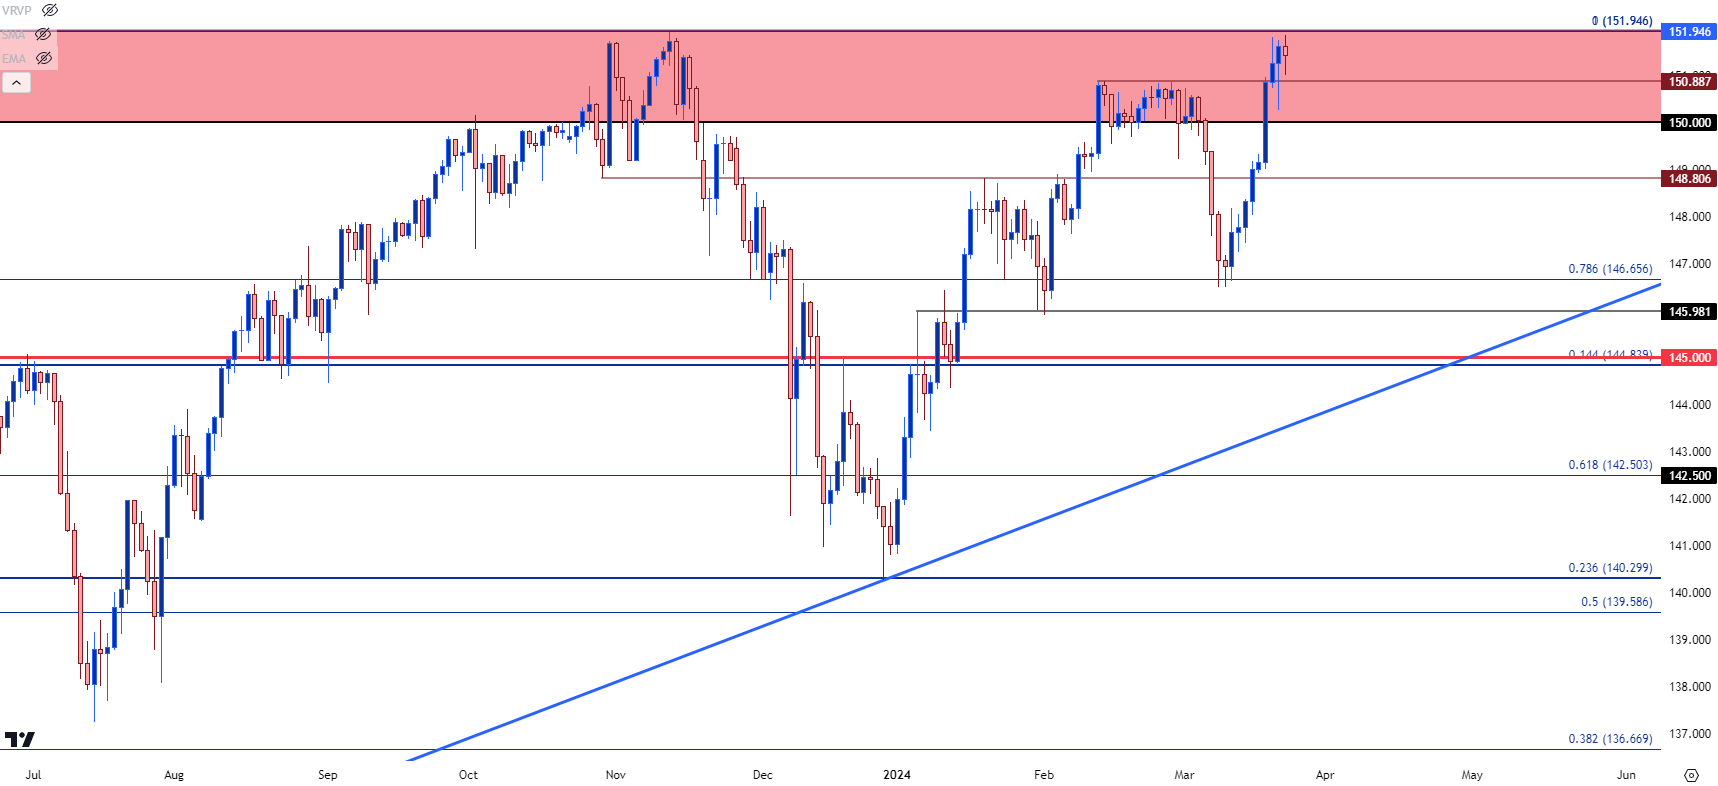 Chart prepared by James Stanley, USD/JPY on Tradingview
EUR/JPY
EUR/JPY set a fresh 14-year high after the BoJ’s rate hike, and that led to a push over the 165.00 level that couldn’t hold. The pullback from that has started to test resistance at a prior swing-high, plotted at 163.72 and as you can see from the chart below that level has had a couple of key resistance holds. Below that, another key level with some prior reference appears around 161.87.
If the 163.72 level is traded above in early-trade next week, that could be seen as a possible pullback in the bullish move. If that doesn’t hold the low, another possible inflection point for a higher-low exists at the 161.87 level.
EUR/JPY Daily Price Chart
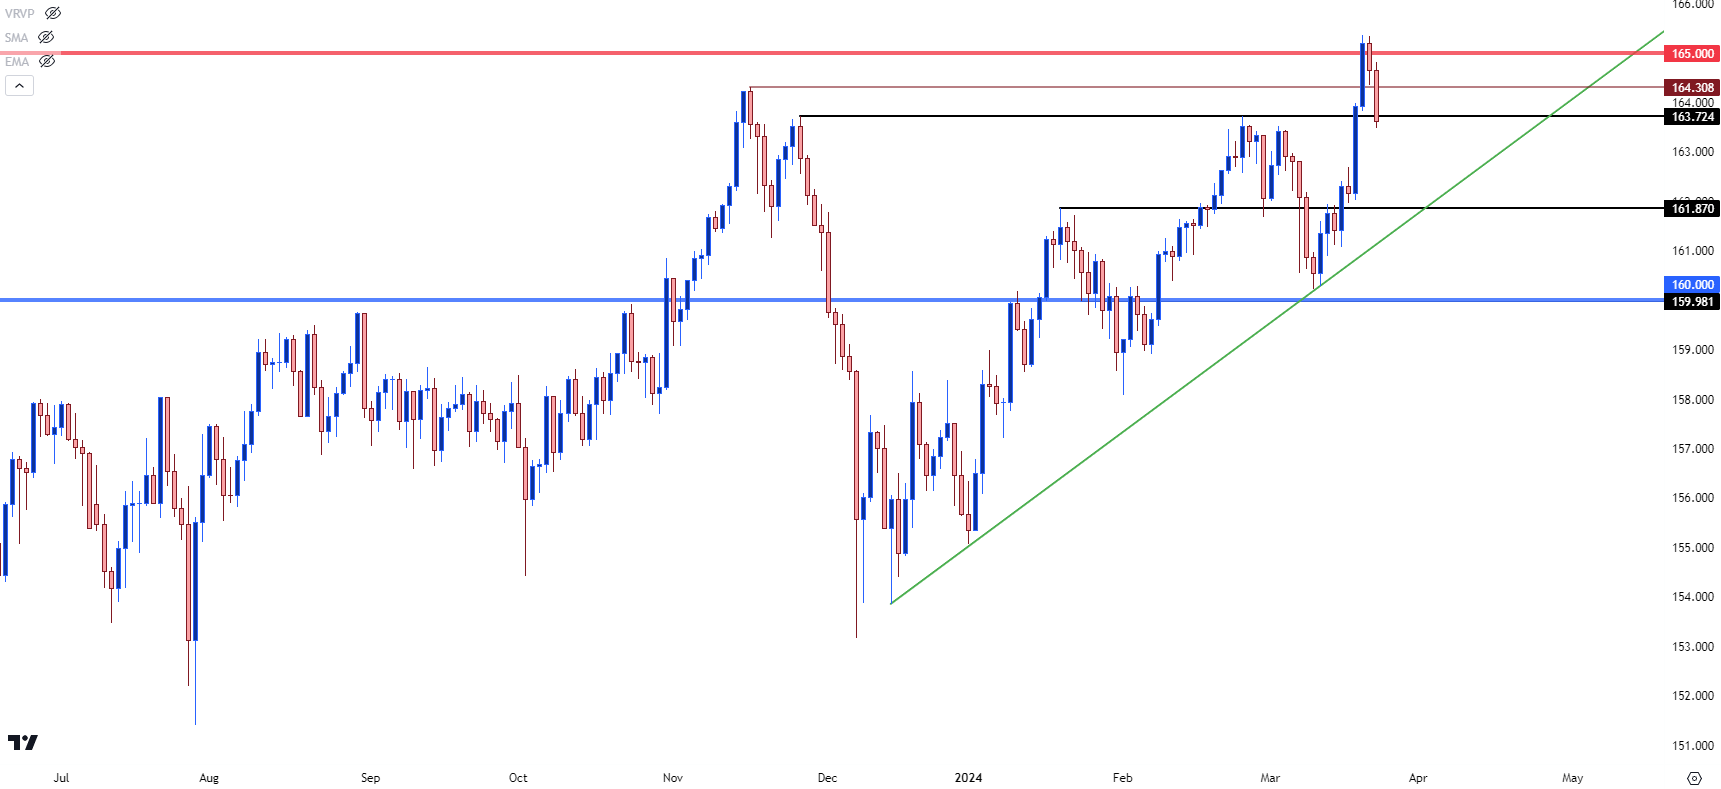 Chart prepared by James Stanley, EUR/JPY on Tradingview
GBP/JPY
GBP/JPY was previously a high-flyer and as the weekly bar nears its conclusion, the pair is grasping on to a slight gain.
The bullish breakout from the BoJ rate hike was largely offset by the dovish Bank of England rate decision, despite the still-elevated inflation in the U.K. It’s where that high printed that remains of interest, as this was very close to a long-term range of interest spanning from 193.61 up to 198.08.
This was a gap from August and September of 2008, around the Financial Collapse, and the bottom of that zone is what helped to set the highs in 2015 before a massive reversal developed.
GBP/JPY Monthly Price Chart
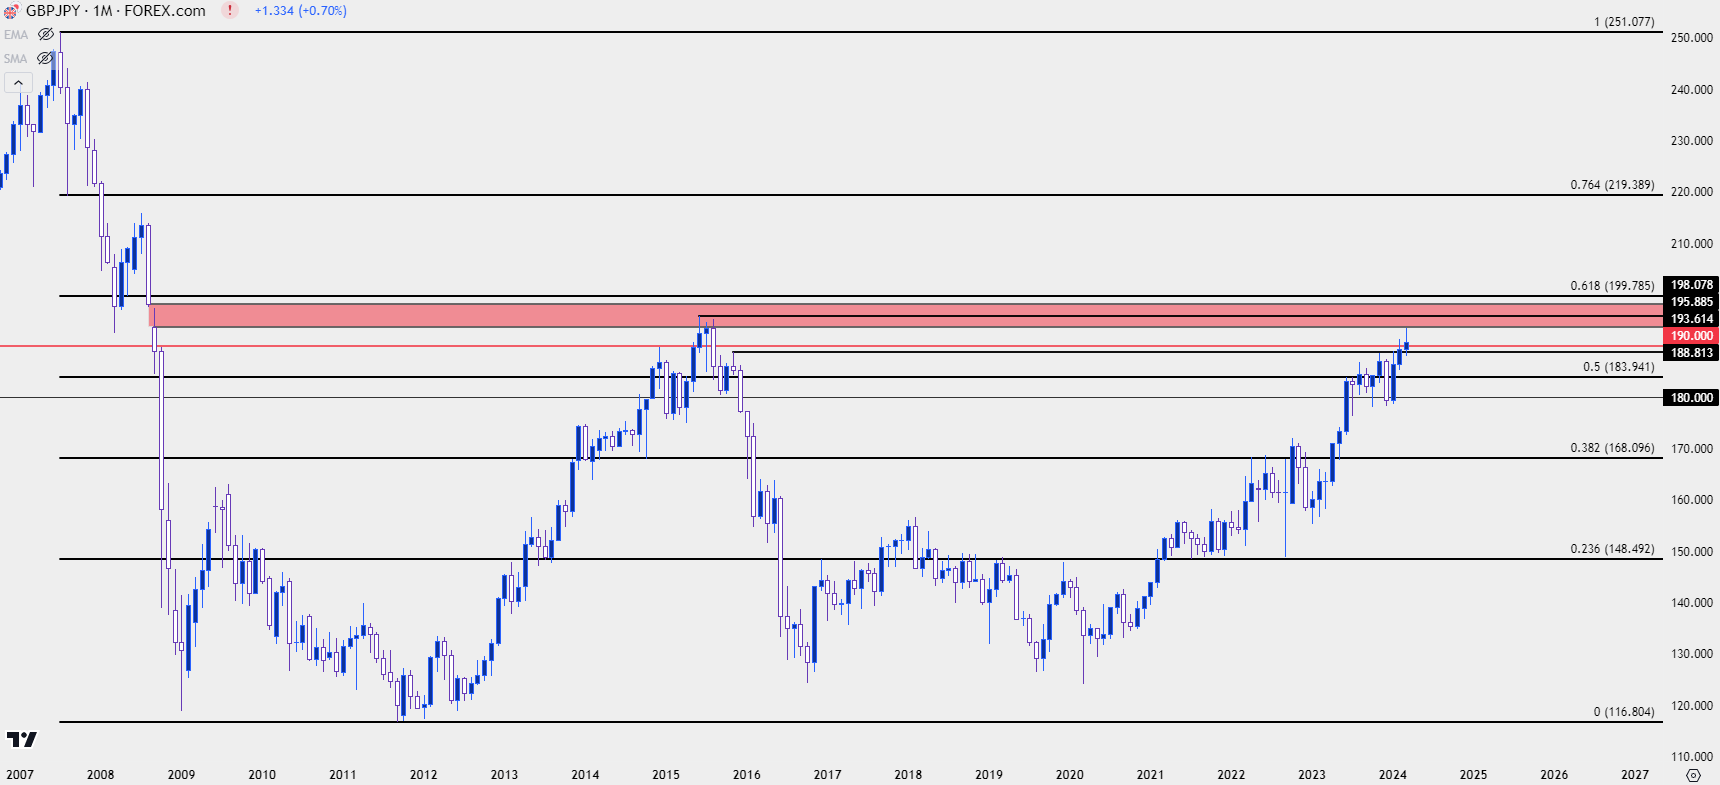 Chart prepared by James Stanley, GBP/JPY on Tradingview
From the weekly chart of GBP/JPY, we can identify a few other levels of note: The 190.00 psychological level remains key as price hasn’t really gained acceptance there yet. Below that, we have a prior swing-high that’s since shown as support, plotted around 188.81. Below that is another prior swing of resistance-turned-support at 186.47.
GBP/JPY Weekly Price Chart
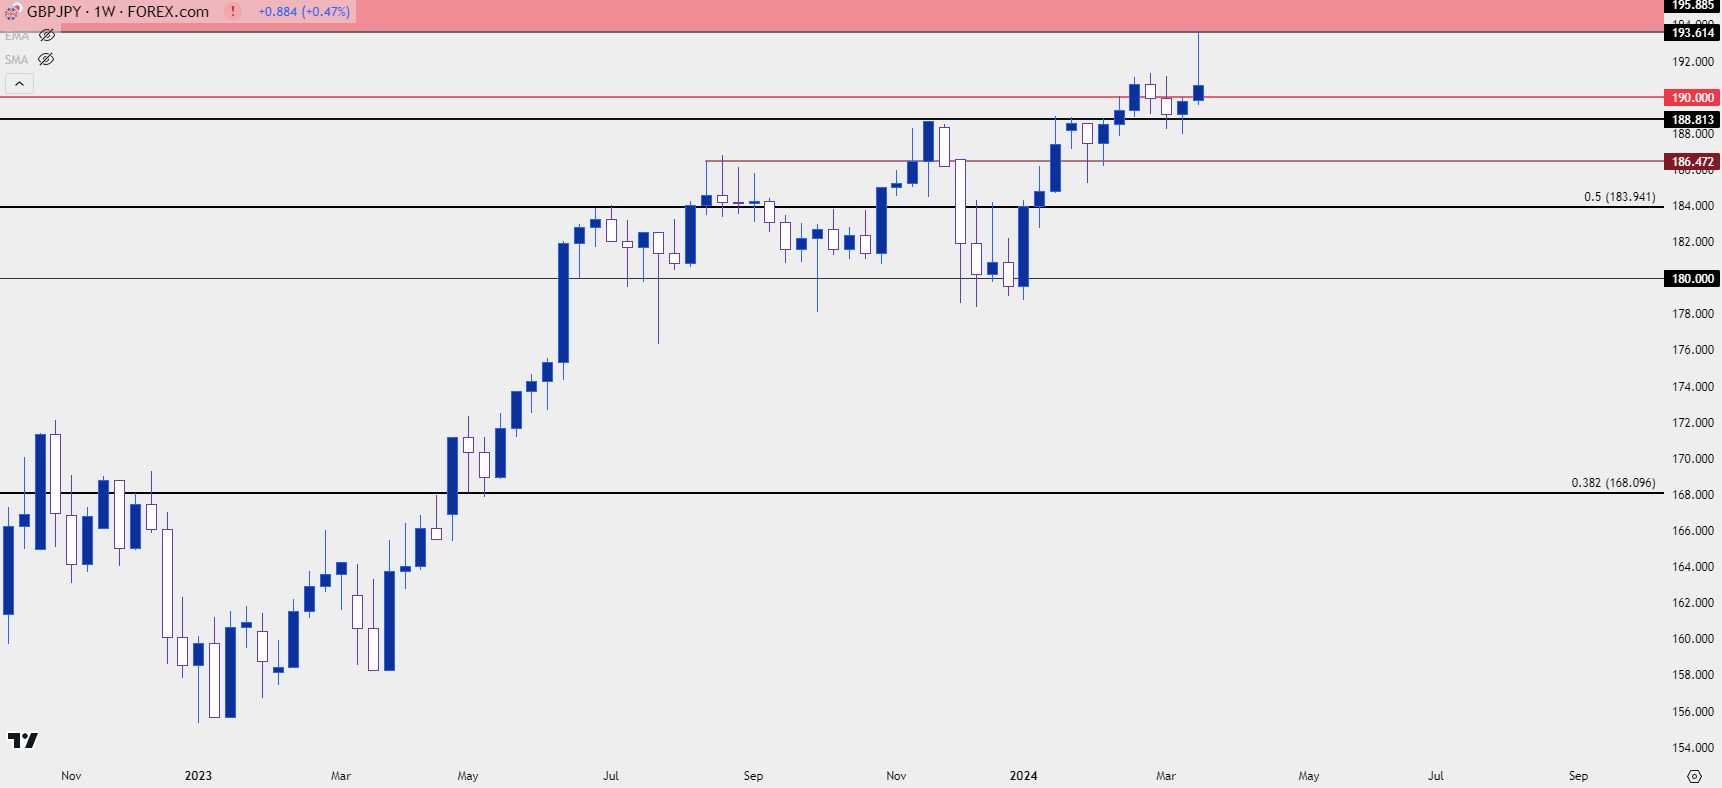 Chart prepared by James Stanley, GBP/JPY on Tradingview
--- written by James Stanley, Senior Strategist


