Japanese Yen Technical Forecast: USD/JPY Weekly Trade Levels
- Japanese Yen testing key resistance zone for third consecutive week
- USD/JPY bulls face FOMC / BoJ interest rate decisions this week
- Resistance 147.69-148.73, ~151, 151.90-152- Support ~146, 145, 142.07
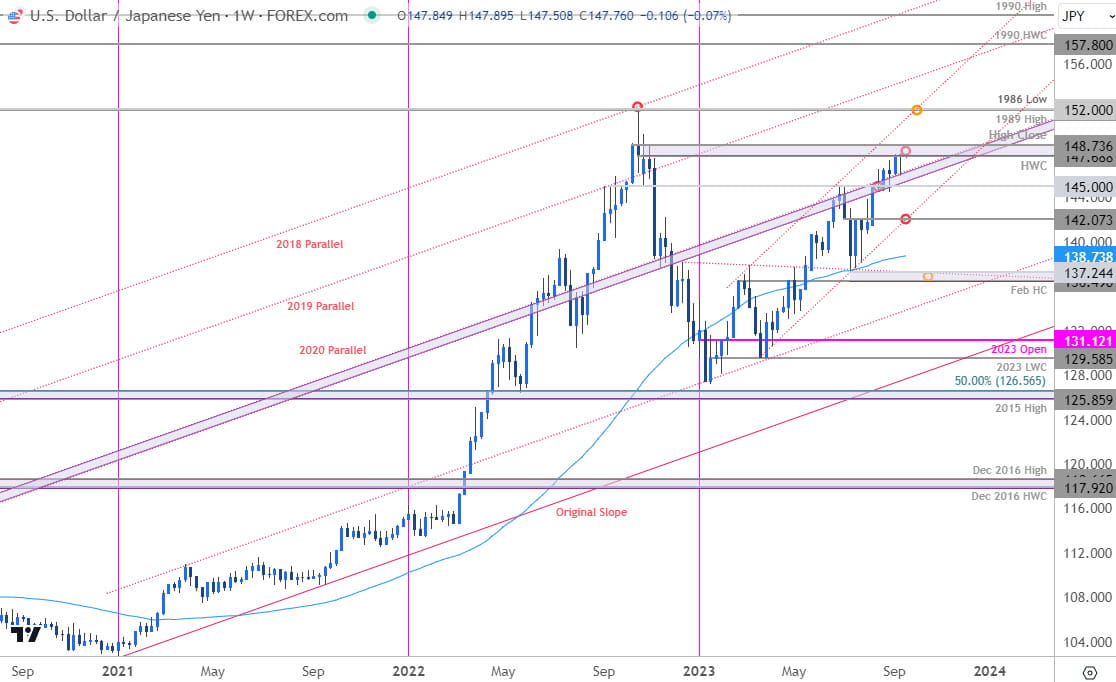
The Japanese Yen remains on the defensive with USD/JPY trading near the yearly highs after rallying more than 16.2% off the January low. The bulls have been held up at a major resistance hurdle for the past three-weeks and while the broader outlook remains constructive, the immediate advance may be vulnerable while below this key pivot zone. These are the updated targets and invalidation levels that matter on the USD/JPY weekly technical chart heading into the FOMC / BoJ rate decisions.
Review my latest Weekly Strategy Webinar for an in-depth breakdown of this Yen setup and more. Join live on Monday’s at 8:30am EST.
Japanese Yen Price Chart – USD/JPY Weekly

Chart Prepared by Michael Boutros, Sr. Technical Strategist; USD/JPY on TradingView
Technical Outlook: In last month’s Japanese Yen Technical Forecast, we noted that USD/JPY was, “attempting to breach a major technical confluence here at the 145-handle- watch the weekly close for guidance. From a trading standpoint, the focus remains on possible exhaustion / price inflection on stretch toward 147 IF reached.” USD/JPY broke higher the following week with the advance now testing the next major resistance threshold at 147.69-148.73 – a region defined by the 2022 high-week close & the high-close. The immediate advance may be vulnerable into this zone with a breach / close above needed to fuel the next leg higher in price.
Initial support rests along the 2020 parallel (currently ~146) backed by the 145-pivot zone- losses should be limited to this threshold IF price is heading higher on this stretch. Broader bullish invalidation now raised to the July reversal-close at 142.07.
A topside breach from here keeps the focus on yearly channel resistance (currently ~151) backed closely by a more significant confluence at 151.90-152.00 – a region defined by the 1989 & 2022 highs and the 1986 low. Look for a larger reaction there IF reached.
Bottom line: USD/JPY testing a key technical confluence for the third consecutive week with the FOMC & BoJ interest rate decisions on tap. From a trading standpoint, the rally remains vulnerable while below 148.73 – losses should be limited to channel support for the March advance to remain viable with a weekly close above this resistance zone exposing the 2022 highs. Stay nimble heading into the close of the week with the Fed & BoJ rate decisions likely to fuel some volatility here. I’ll publish an updated Japanese Yen Short-term Outlook once we get further clarity on the near-term USD/JPY technical trade levels.
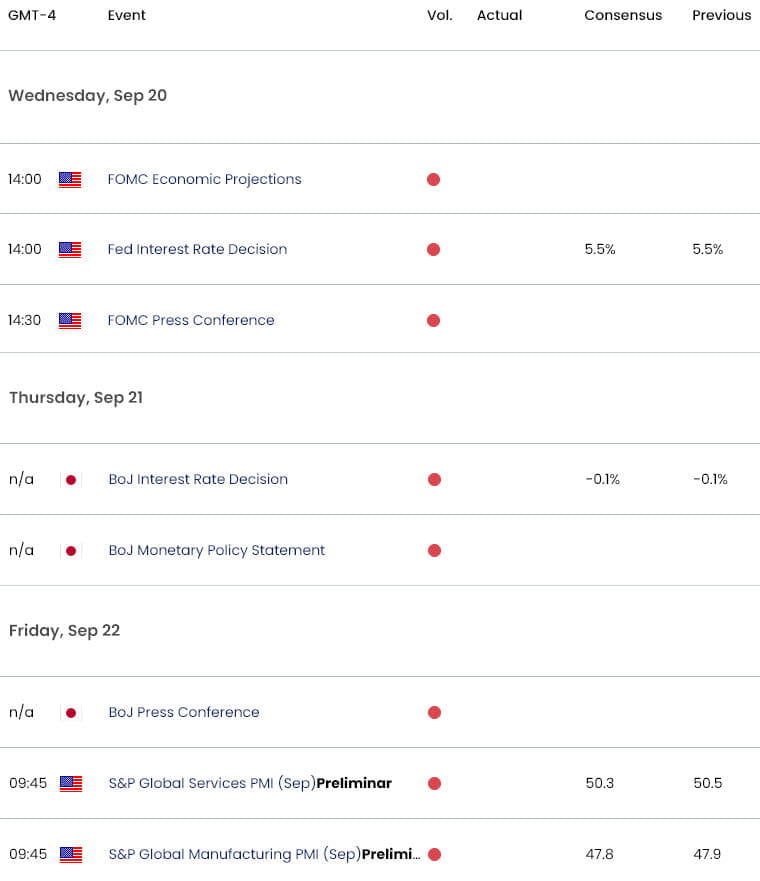
USD/JPY Key Economic Data Releases

Economic Calendar - latest economic developments and upcoming event risk.
Active Weekly Technical Charts
- Crude Oil (WTI)
- US Dollar (DXY)
- Gold (XAU/USD)
- Euro (EUR/USD)
- Canadian Dollar (USD/CAD)
- British Pound (GBP/USD)
- Australian Dollar (AUD/USD)
--- Written by Michael Boutros, Sr Technical Strategist with FOREX.com
Follow Michael on Twitter @MBForex


