Japanese Yen technical forecast: USD/JPY weekly trade levels
- Japanese Yen reversal breaks back below yearly moving average
- USD/JPY poised to mark third consecutive weekly decline- uptrend support in view
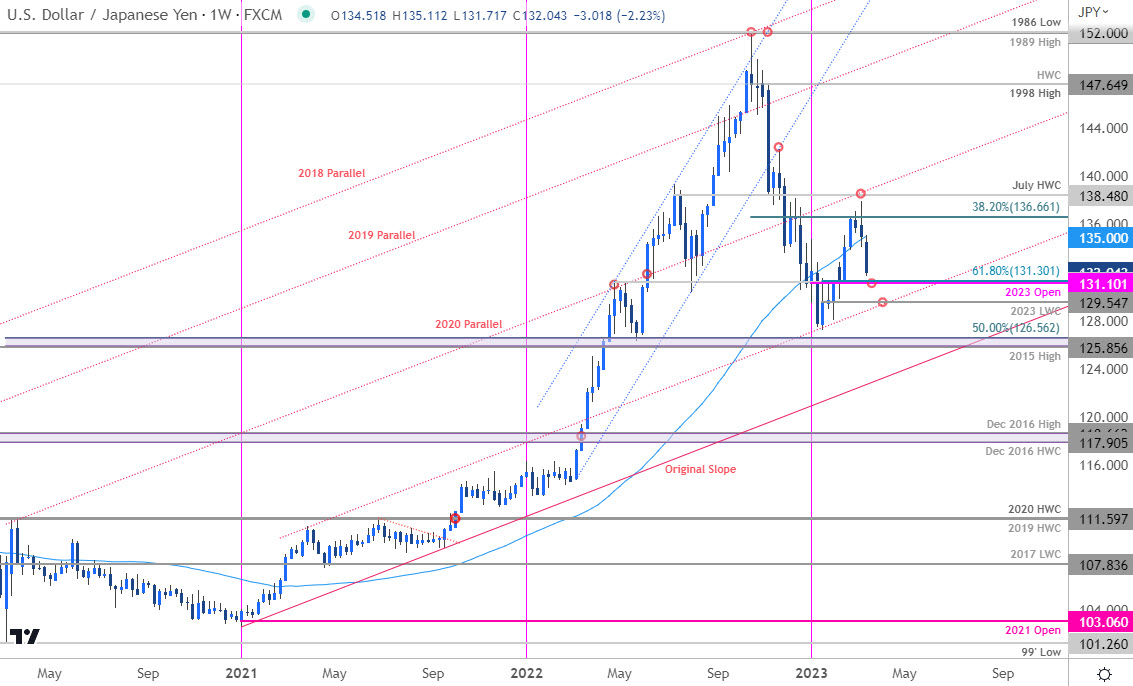
- Resistance 135, 136.66, 138.48– support 131.10/30, 129.54 (key), 125.85-126.56
The Japanese Yen rallied more than 2% against the US Dollar as a reversal off technical resistance in USD/JPY gathered pace for a third consecutive week. Price is now approaching key support levels and we’re looking for possible price exhaustion / inflection in the week ahead. These are the updated targets and invalidation levels that matter on the USD/JPY weekly technical chart.
Discuss this USD/JPY setup and more in the Weekly Strategy Webinars on Monday’s at 8:30am EST.
Japanese Yen Price Chart – USD/JPY Weekly

Chart Prepared by Michael Boutros, Sr. Technical Strategist; USD/JPY on TradingView
Technical Outlook: In last month’s Japanese Yen technical forecast we noted that USD/JPY was attempting a breakout above the 52-week moving average with subsequent resistance eyed at the, “38.2% retracement at 136.66. Ultimately a breach / close above the July high-week close / slope resistance (red) at 138.48 would be needed to mark resumption of the broader uptrend.” Price registered an intraweek high at 137.91 last week before reversing with USD/JPY plunging nearly 4.5% off that mark.
The decline is now approaching a critical support pivot at 131.10/30- a region defined by the 2023 yearly open, the April 2022 high and the 61.8% Fibonacci retracement of the yearly range. Ultimately, a break / weekly close below the 2023 low-week close at 129.54 would be needed to shift the focus back towards the next key pivot zone at 125.85-126.56.
Initial weekly resistance now stands with the 52-week moving average (currently ~135) backed again by 136.66 and 138.48- we’ll maintain this as our bearish invalidation level for now.
Bottom line: USD/JPY has reversed off key resistance with the pullback now reasserting below the yearly moving-average. From a trading standpoint, rallies should be limited by this week’s high IF price is heading lower - look for a reaction on a stretch towards these lower levels for guidance. Review my latest Japanese Yen short-term outlook for a closer look at the near-term USD/JPY technical trade levels.
Key Economic Data Releases

Economic Calendar - latest economic developments and upcoming event risk.
Active Weekly Technical Charts
- Australian Dollar (AUD/USD)
- Euro (EUR/USD)
- Canadian Dollar (USD/CAD)
- Crude Oil (WTI)
- Gold (XAU/USD)
- S&P 500 (SPX500)
- US Dollar Index (DXY)
- British Pound (GBP/USD)
--- Written by Michael Boutros, Sr Technical Strategist with FOREX.com
Follow Michael on Twitter @MBForex


