Japanese Yen Technical Forecast: USD/JPY Weekly Trade Levels
- Japanese Yen poised for largest weekly rally since July- more than 5.3% off 2023 extremes
- USD/JPY breaks multi-month, confluent uptrend support- initial support in view
- Resistance 147.69, 148.73-149.60, 151.69-152 – Support 142.48, ~140.05, 136.49-137.24
The Japanese Yen rally is accelerating with the USD/JPY off nearly 2% since the start of the week. The decline marks the largest weekly range since July with a break of significant technical support threatening further Dollar losses in the weeks ahead. These are the updated targets and invalidation levels that matter on the USD/JPY weekly technical chart.
Review my latest Weekly Strategy Webinar for an in-depth breakdown of this Yen setup and more. Join live on Monday’s at 8:30am EST.
Japanese Yen Price Chart – USD/JPY Weekly

Chart Prepared by Michael Boutros, Sr. Technical Strategist; USD/JPY on TradingView
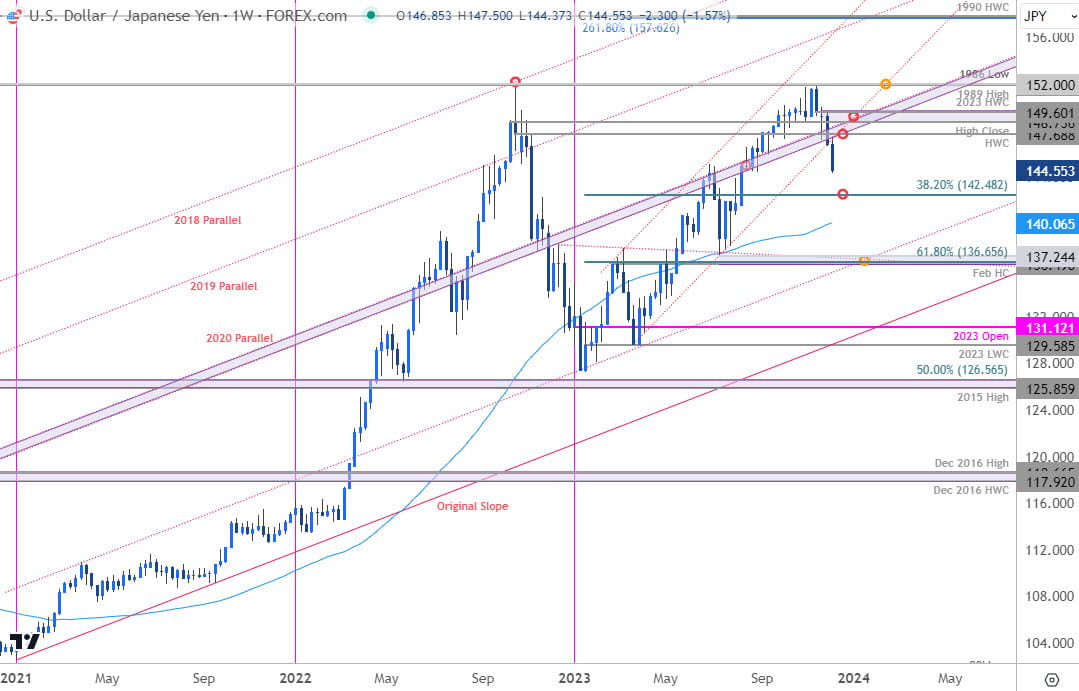
Technical Outlook: In last month’s Japanese Yen Technical Forecast, we highlighted a major resistance zone at 151.69-152- a region defined by the objective November-open, the October high, the 1989 high, and the 1986 low. We noted that USD/JPY was, “struggling just below multi-year resistance. The advance comes amid weakness in the US Dollar and Treasury yields and the non-confirmation high of related assets suggests the threat for exhaustion here.”
A final attempt to breach resistance failed the following week with USD/JPY plunging back below parallel support last week. The decline has now broken significant, multi-month uptrend support and threatens a deeper correction in the weeks ahead.
Initial weekly support rests with the 38.2% retracement of the yearly range at 142.48 and is backed closely by the 52-week moving average (currently ~140.05). Broader bullish invalidation is now seen at 136.49-137.24- a region defined by the February high-close (HC), the 61.8% Fibonacci retracement, and the July swing low.
Weekly resistance is eyed back at the 2022 high-week close at 147.68 followed closely by the 2022 high-close / 2023 high-week close at 148.73-149.60- a breach / weekly close above this threshold is needed to mark uptrend resumption towards the 152-pivot zone again.
Bottom line: USD/JPY has broken below confluent uptrend support with the decline now approaching initial support objectives. From at trading standpoint, look to reduce portions of short-exposure / lower protective stops on a test of 142.48- rallies should be limited to the highlighted 2020 parallel IF price is moving lower on this stretch. Keep in mind US Non-Farm Payrolls (NFP) is on tap tomorrow with the highly anticipated Fed interest rate decision slated for next week. Watch the weekly closes here as we approach support. Review my latest Japanese Yen Short-term Outlook for a closer look at the near-term USD/JPY technical trade levels.
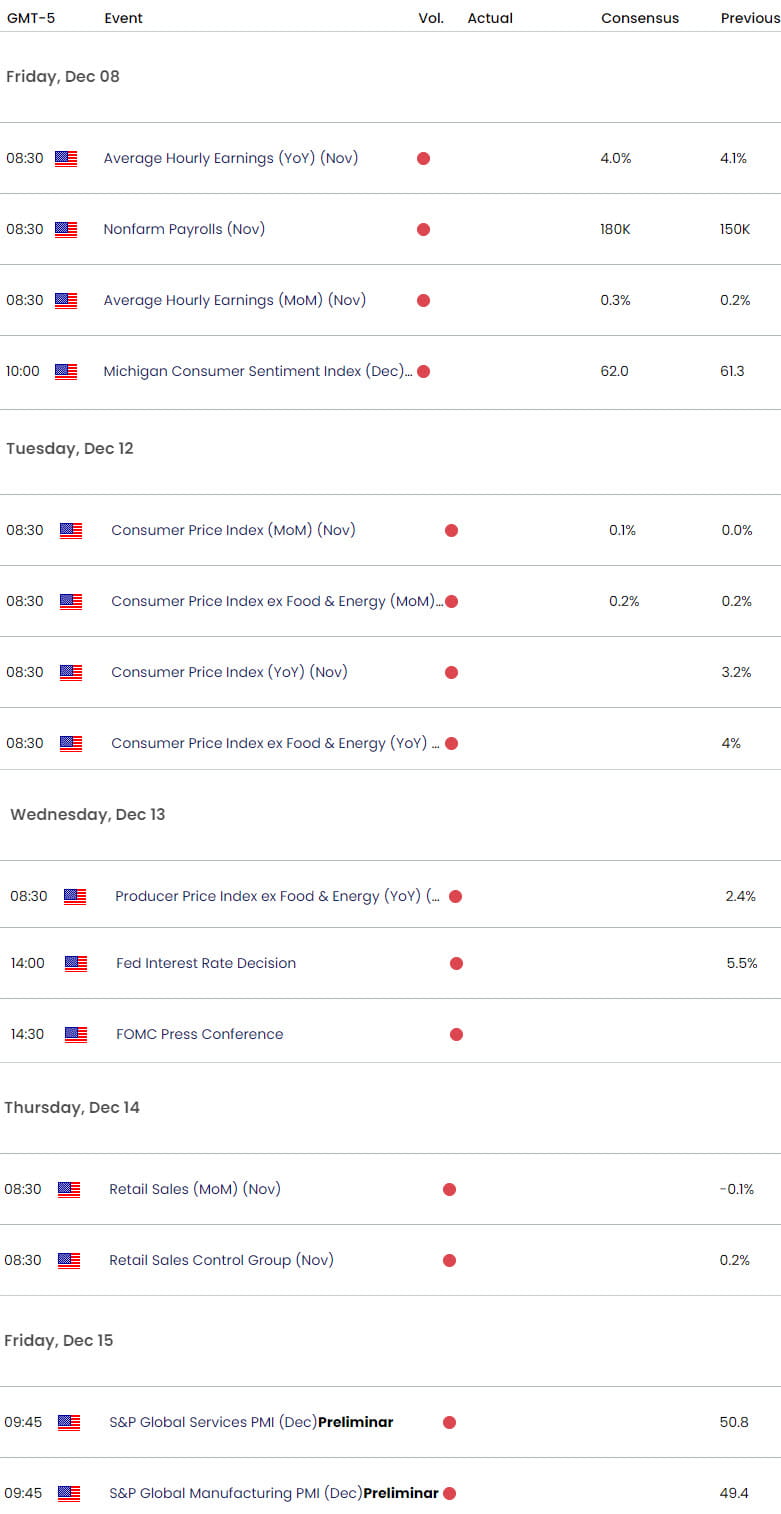
USD/JPY Key Economic Data Releases

Economic Calendar - latest economic developments and upcoming event risk.
Active Weekly Technical Charts
- Australian Dollar (AUD/USD)
- Gold (XAU/USD)
- Euro (EUR/USD)
- US Dollar Index (DXY)
- Canadian Dollar (USD/CAD)
- British Pound (GBP/USD)
- Crude Oil (WTI)
--- Written by Michael Boutros, Sr Technical Strategist with FOREX.com
Follow Michael on X @MBForex


