Japanese Yen, USD/JPY Talking Points:
- Carry unwind began to show last week in USD/JPY as USD weakness took over following the CPI report. But USD/JPY ran into a key support level on Monday night and bulls have went to work since then, pushing a sharp move of more than 250 pips off of the lows.
- The Yen turned last year with a strong push on November 10th 2022 following a CPI report in the US. That gave the thought that the Fed might be closer to finished with hikes, and this drove a scenario of USD-weakness that lasted for three months. A similar scenario had shown this year and USD/JPY weakness ran all the way until support came into play. This begs the question as to whether we’re seeing an oversold bounce or a return of bulls after a pullback provoked by CPI.
- I’ll be discussing these themes in-depth in the weekly webinar on Tuesday at 1PM ET. It’s free for all to register: Click here to register.
Yen markets are driven by supply and demand.
I know, that’s an obvious statement. But there is a somewhat complex scenario in the backdrop of JPY markets at the moment so I wanted to start off by establishing a foundation, if you will. Supply and demand are the main push points for market prices, but the natural next question is: What might alter that supply/demand equilibrium?
In the FX market carry or swap can certainly be such a driver. This is daily rollover payment or charge that a trader faces based on the rate divergence of the underlying economies represented in the pair. And when we have a case of growing divergence, such as we had in USD/JPY through 2021-2022 or again this year when the Fed continued to hike rates, this can increase demand in that pair as more traders join the side of the higher interest rate.
Increasing demand can lead to a bullish trend and for those that had joined earlier to clip the carry, well that’s a beautiful scenario of symbiosis. That’s the carry trade and when it shows, it can be beautiful. But it’s also a pretty clear pressure point on the supply/demand equilibrium as the growing rate divergence creates more and more demand and this drives prices to move higher and higher.
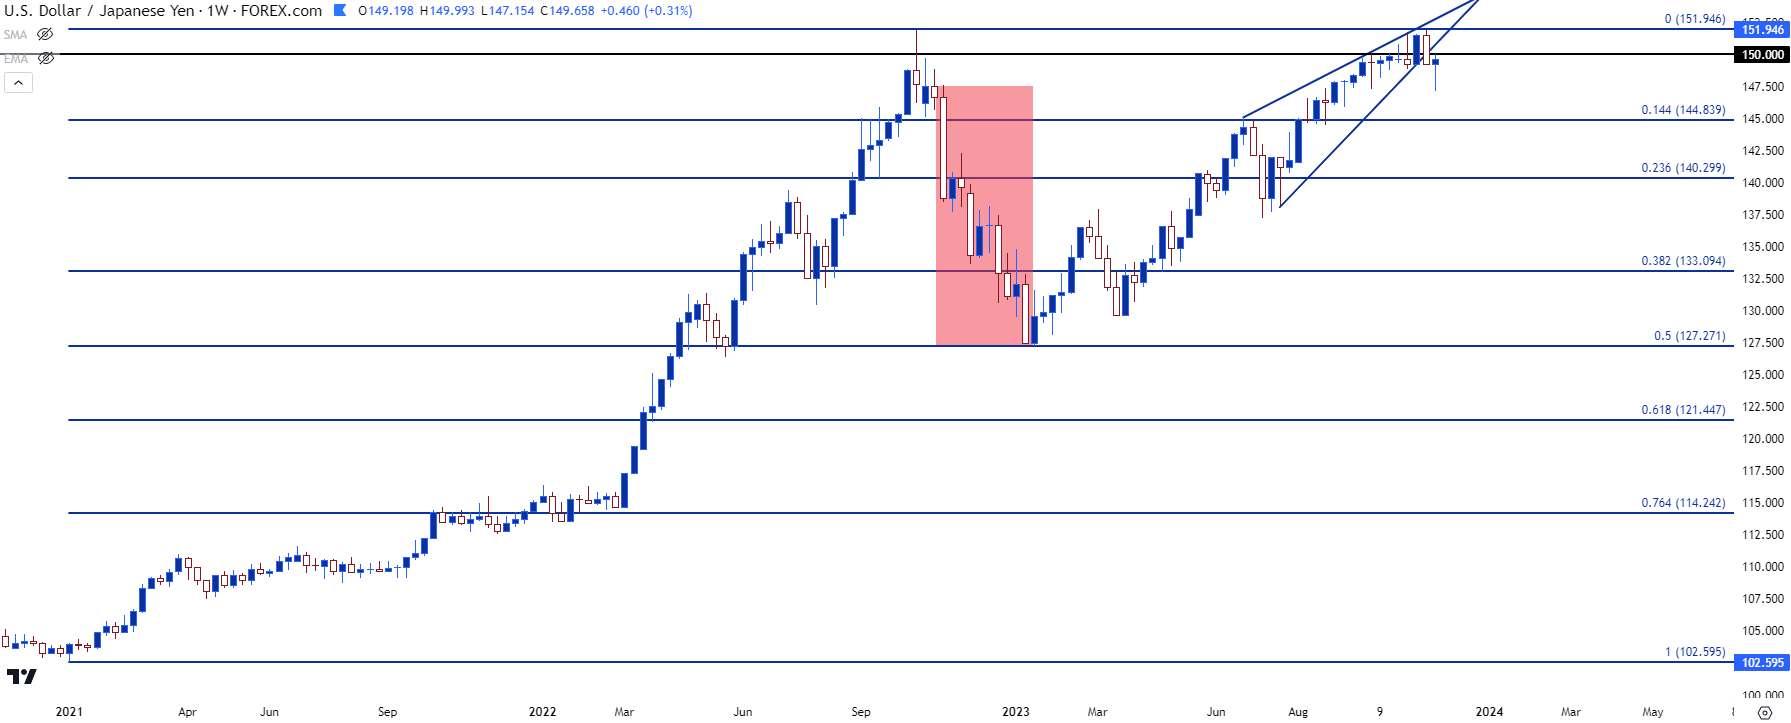
This explains the bullish trend in the pair that was so prominent for 21 months in 2021-2022; or the move that came back into the picture in January of this year. Positive carry on the long side of the trade served as a form of incentivization, and as more and more traders piled on to the long side of the move a bullish trend developed that also allowed for principal appreciation. That then attracted more bulls as a bullish trend had developed co go along with the positive carry. Again, it’s beautiful when it happens. But, like most other things in markets, supply and demand reactions are a bit more complex.
Carry or rollover isn’t the only factor of importance, as a risk or fear of principal losses can lead to a fast unwind scenario. This explains the red box in the middle of the below chart. And because the trade had become so crowded on the way up, this can lead to fast reversal moves as a crowded trade begins to unwind.
USD/JPY Daily Price Chart
 Chart prepared by James Stanley, USD/JPY on Tradingview
Carry Unwind
Trends can get crowded and this starts to point to sentiment, and it harkens back to that supply-demand scenario. For prices to continue moving higher, there needs to be more and more demand to continue to motivate new buyers to come in to continue pushing prices higher. This can last for a while but, often, there comes a point where price is so ‘expensive,’ on some basis, and the market is so heavily long that there’s few interested buyers left on the sideline. This can lead to stall, and perhaps even a pullback as longs begin to take profits; but once price gets to a level that’s perceived to be ‘cheap’ or a ‘value area,’ buyers can return, and that can push the trend back in an upward direction.
Now the question to consider is what creates that idea that prices are ‘expensive.’ This is a relative thing; but last year what finally did it was the Bank of Japan teasing and threatening possible intervention. That’s ultimately what helped to carve the high last year just inside of 152, when the BoJ intervened.
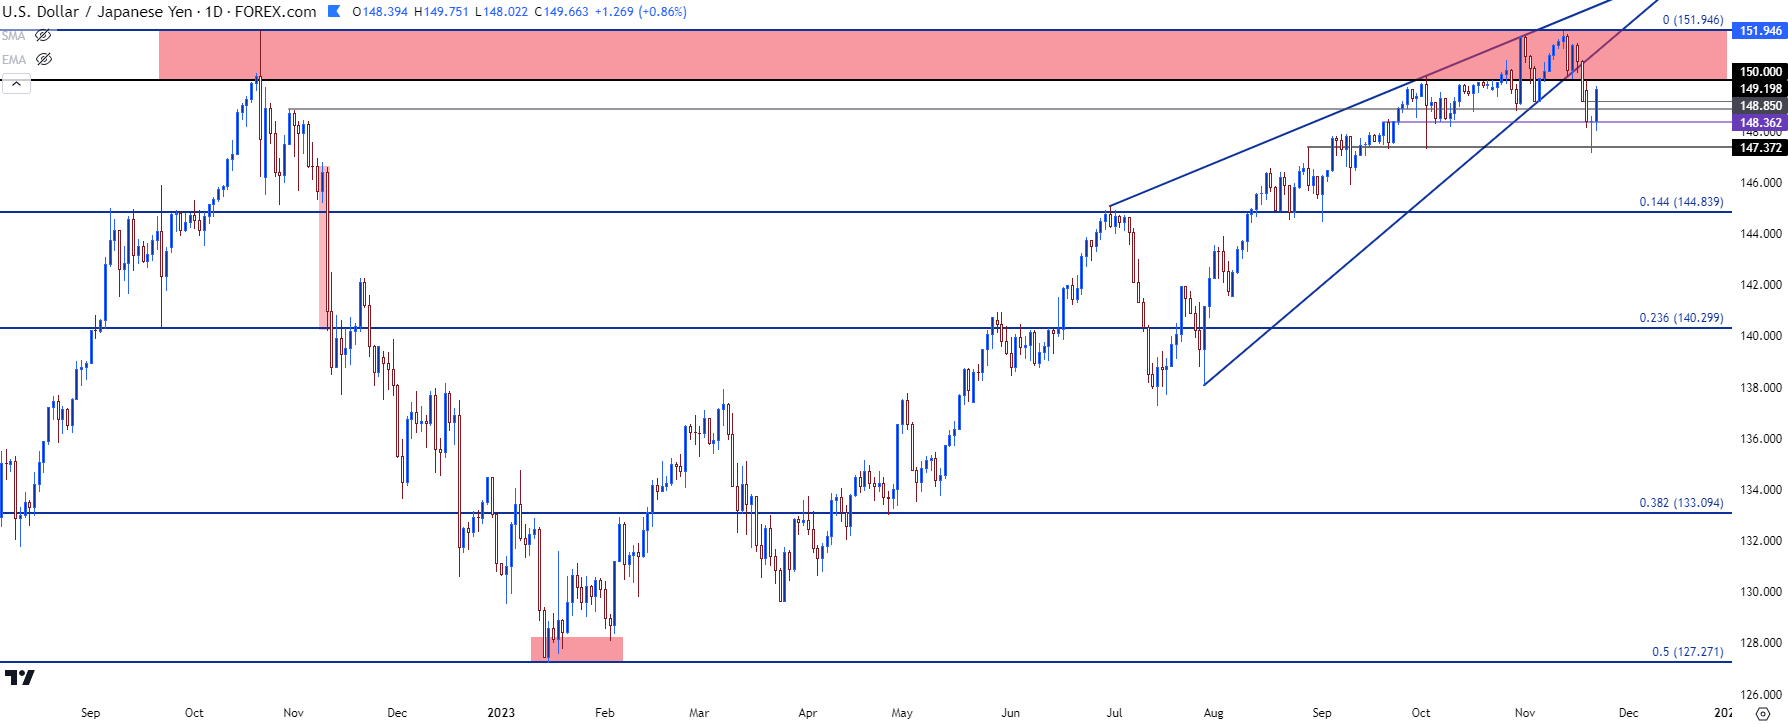
The BoJ intervened in mid-October and that helped to provoke a pullback – but there was still considerable demand as the pullback stalled above the 145.00 handle. What ultimately drove the reversal in that move was a CPI print on the morning of November the 10th. US CPI came in at 7.7%, which was a relief at the time, and markets cheered by pushing the USD-lower.
And all of the sudden, those carry trades that had driven for so long in USD/JPY got very worried as prices were reversing and now those bulls were facing the prospect of principal losses. This unsettled the supply/demand equilibrium as carry trades quickly bailed and in three months, USD/JPY erased 50% of the move that took 21 months to build.
Support eventually showed up at the 50% mark of that major move and that held into mid-January trade. At which point demand slowly returned until, eventually, we had another bullish trend in the pair with USD/JPY driving right back to the same area where the move had stalled last year.
USD/JPY Daily Price Chart: Return to Resistance
 Chart prepared by James Stanley, USD/JPY on Tradingview
USD/JPY Bears Take a Step But Run into Support
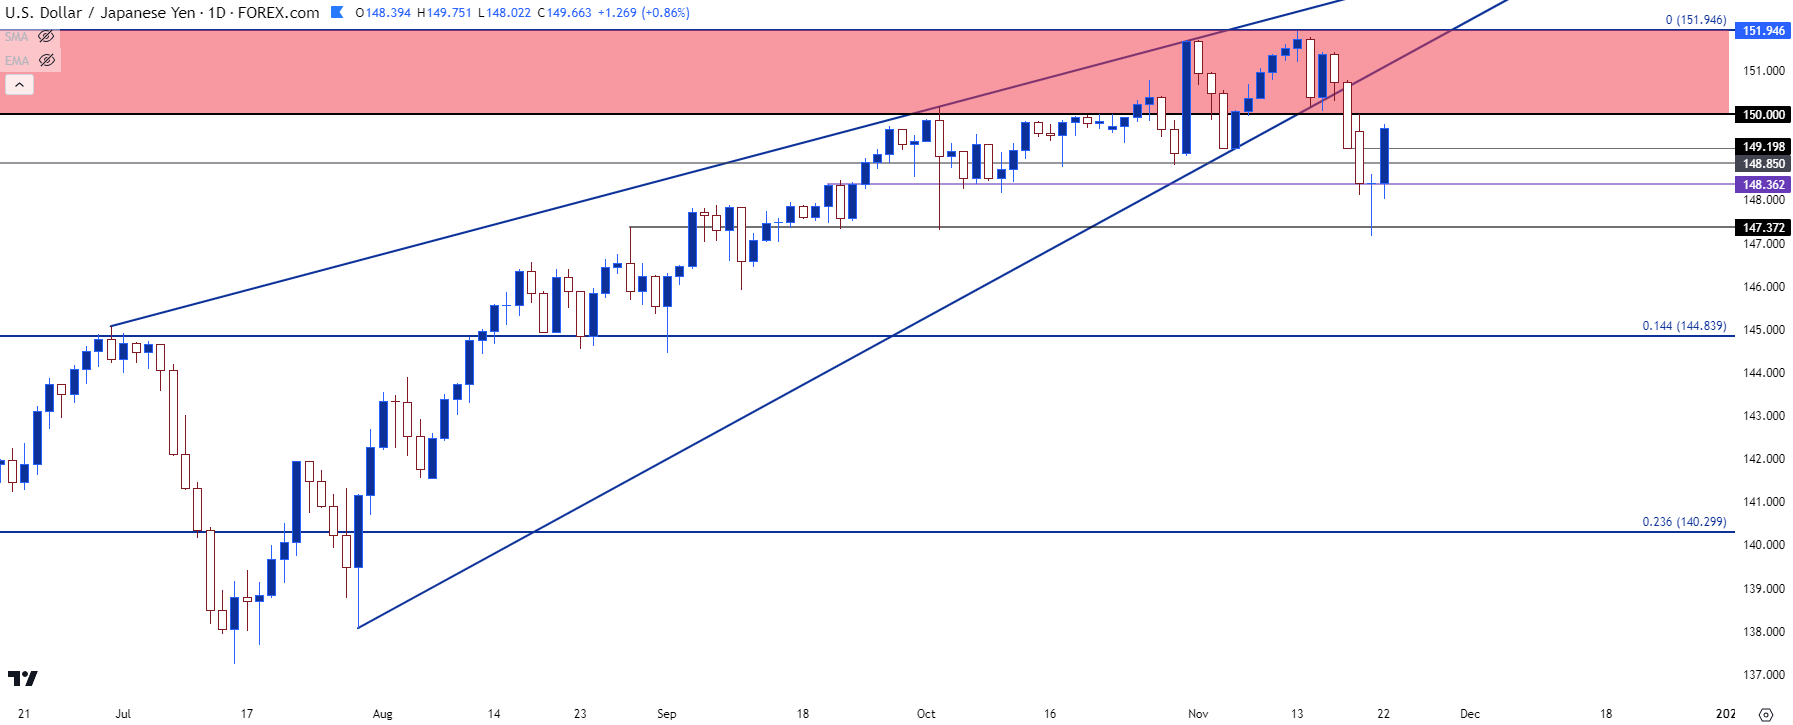
I had highlighted this theme in the weekend publication of US Dollar Price Action Setups, saying ‘For next week, there’s key supports at 148.84 and 147.37, and these would be items that bears would likely want to see taken-out to further build the reversal theme in the pair.’
The first level at 148.84 was traded through quickly, but the second level has proven more problematic for bears. This came into play on Monday night, and there was a contentious test at this level that held through yesterday morning.
But bulls have started to rush back in, and this has led to a sharp move in the pair with USD/JPY making a fast approach at a re-test of the 150.00 handle in the pair. That remains a major spot and I’m spanning that price up to a prior swing high at 150.16 to create a resistance zone. Bulls making a break above that would be a large show of demand, and this would open the door for a trip to next resistance at 150.78. Above that, I have another level at 151.22 and that’s followed by the high at 151.95.
For near-term support, bulls have already stretched this move quite far, but there’s a Fibonacci level around 149.13. Below that I’m tracking levels at 148.42 and then the 147.37 level. That can be spanned up to a prior swing high at 147.88 to create a support zone.
That’s the spot that bears would need to take out to signal oncoming supply which could highlight a continuation of the reversal that got started last week. But, at this point, the daily chart is showing a non-completed morning star formation. Those are often approached with aim of bullish reversal and, in this case, that would keep the door open for a push up to and another re-test of the 150.00 psychological level.
USD/JPY Daily Price Chart
 Chart prepared by James Stanley, USD/JPY on Tradingview
Markets Look to the End of Rate Hikes – but Has USD/JPY Topped?
One of the overwhelming takeaways from November trade so far is that the Fed may be closer to complete with this rate hike cycle than what was thought just a month ago. And action in the US Dollar echoes this, as DXY posted a gravestone doji on Fed day on November 1st, and that’s led to a sharp sell-off since then.
This was a major factor in the reversal in USD/JPY last year and it started to show here, particularly after last week’s CPI release, but the massive move off 147.37 support shows that there’s still some considerable demand out there. The big question is whether we get to a spot where USD/JPY is considered ‘expensive,’ and that 150.00 level may still hold some sway there. But, we’ll have to evaluate demand from bulls at the time to get a better feel for whether a longer-term setup is attempting to set a top.
Demand has ramped up over the past 24 hours but the question now is whether longer-term bulls use this bounce as an opportunity to get out of the trade before a larger reversal may set up. Because it looks unlikely that US rates will move up by much, if at all, and that motivation on the long side of the trade may be starting to wane.
USD/JPY Four-Hour Price Chart
Chart prepared by James Stanley, USD/JPY on Tradingview
--- written by James Stanley, Senior Strategist


