Japanese Yen Talking Points:
- USD/JPY has pulled back following the release of US CPI data.
- As I had discussed in yesterday’s webinar, a run of USD-weakness would likely be the largest push point for bears as Japan doesn’t appear ready to hike rates more aggressively and intervention is generally a band aid to stem the bleeding.
- This sets USD/JPY as a possible hyperbolic venue of USD price action: If USD strength comes back after DXY tests support, the positive carry on the long side of the pair can draw bulls back in without the fear of a near-term re-test of the 160.00 handle. But – if USD weakness persists, there could be a growing fear of a larger reversal and that can motivate carry traders that have driven demand in the trend to cut positions.
At this point USD/JPY seems to be a more volatile venue of the USD and that statement can be applicable on both sides of the matter.
On the bullish side of the USD, the positive carry on the long side of USD/JPY can help to bring more demand, leading to even higher prices. And, on the short side of the USD, much like we saw in Q4 of 2022 and 2022, if there’s a growing fear of a reversal in the USD, carry traders could suddenly get worried of principal losses which could lead to a fast decline. This is what we saw after CPI reports in November in each of the past two years and this morning has seen a similar, albeit shorter-term example of the same type of thing.
US Core CPI print at 3.6% which is the lowest in three years. While this isn’t enough to open the door for rate cuts, it’s a step in that direction, and the near-immediate response in the USD was a pullback. And in USD/JPY, there was a similar pullback but to a larger degree. As a case in point, USD/JPY’s daily bar is currently down by -0.91% while the DXY daily bar is down by less at -0.62% (both numbers as of this writing).
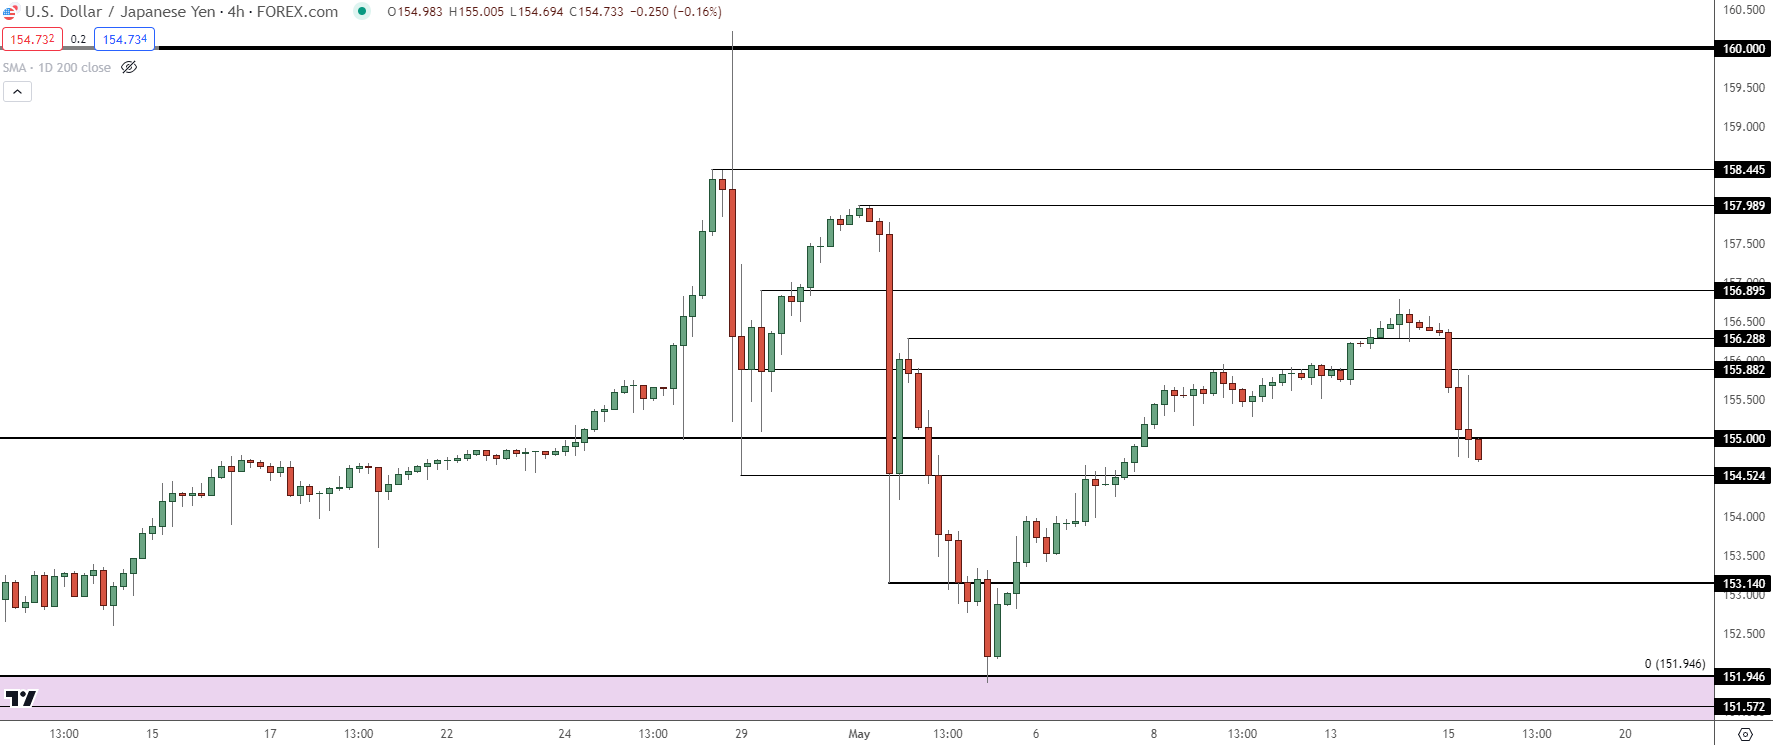
USD/JPY Four-Hour Price Chart
 Chart prepared by James Stanley, USD/JPY on Tradingview
USD/JPY: What Would Bears Need to Take More Control?
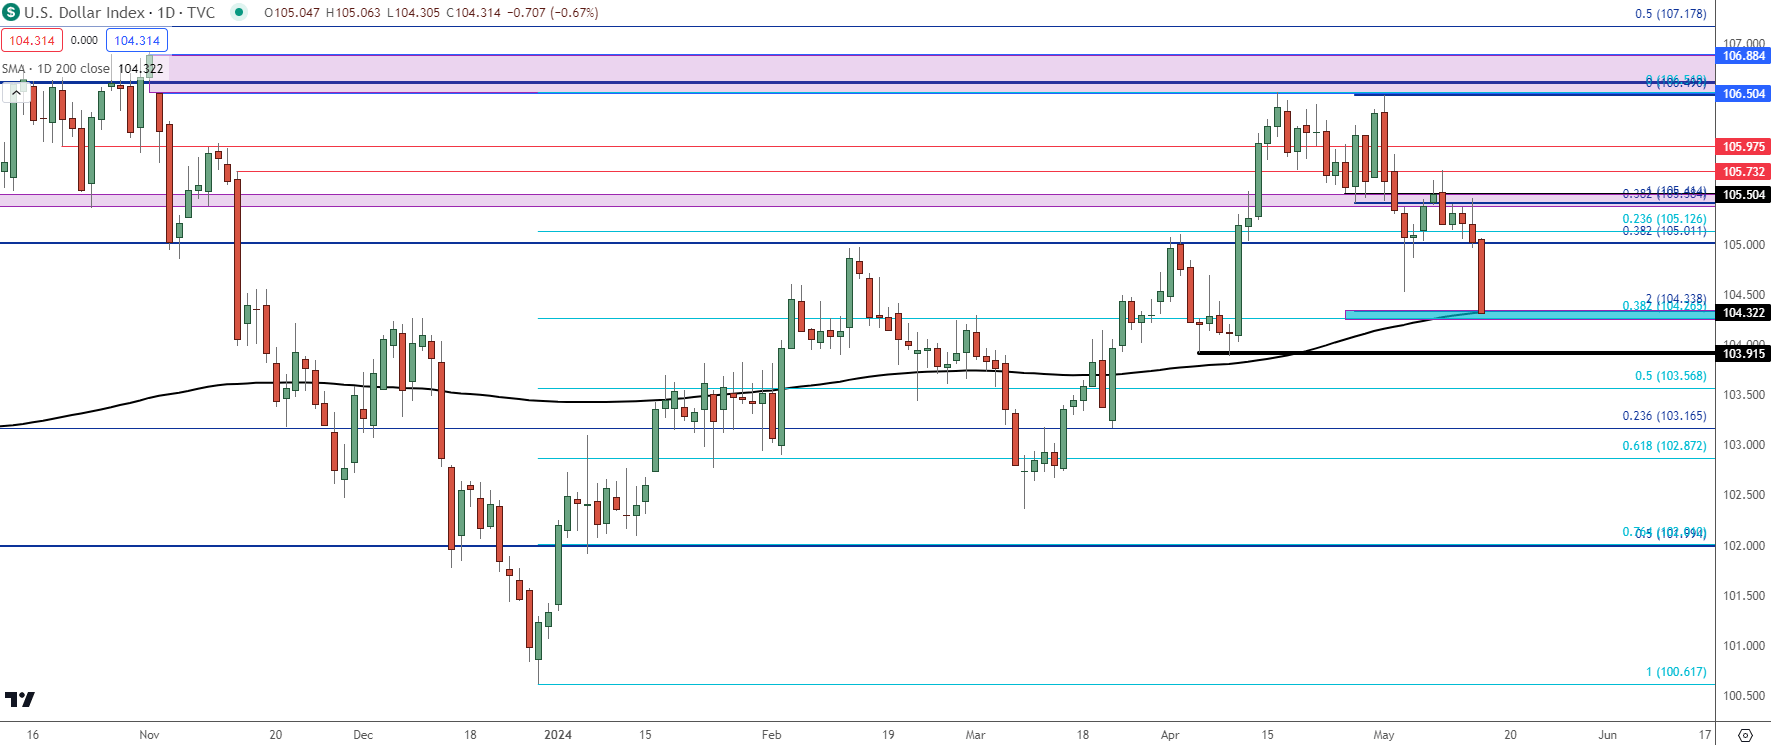
USD/JPY bears would likely need a deeper rout in the US Dollar. At this point DXY is testing a big spot of support at the 200-day moving average, which is confluent with a Fibonacci level as well as a prior price swing from the March 1st high. And much like I’ve talked about throughout this year, the Dollar has held on to a degree of strength even during pullback scenarios as there’s been a sequence of higher-highs and lows building through the first four months of this year. The question now is whether bulls respond to support, and this could have consequence in USD/JPY.
US Dollar Daily Price Chart
 Chart prepared by James Stanley; data derived from Tradingview
USD-strength a big part of what allowed USD/JPY to come roaring back this year. And, notably, the sell-off in Q4 started after a US CPI print in November drove a higher probability of rate cuts in 2024. And as that priced-in along with USD-weakness, USD/JPY finally pushed back below the 150.00 level.
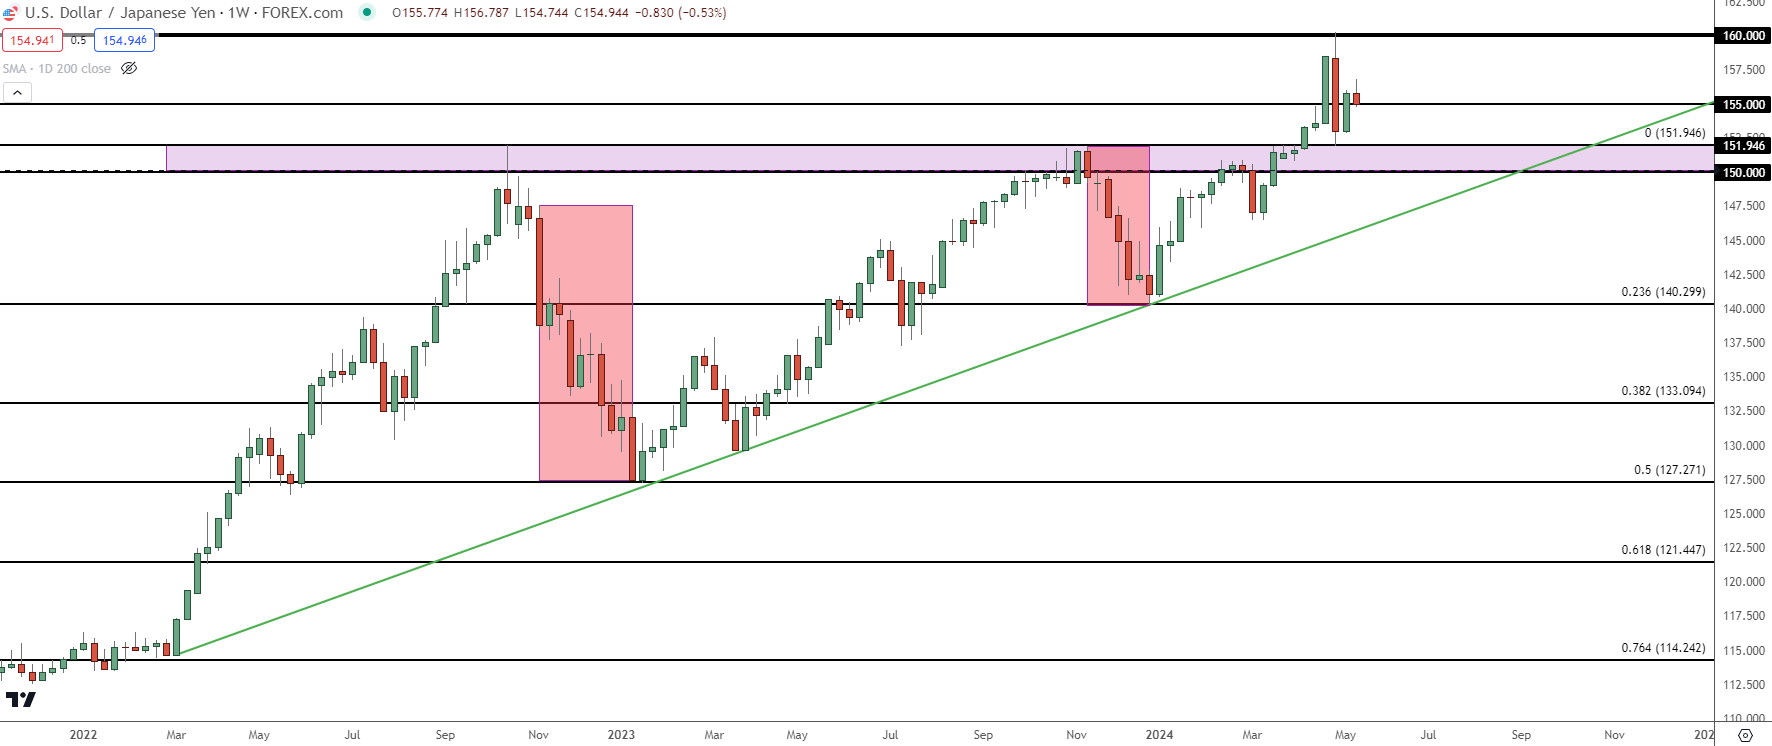
That was a similar scenario as 2022, when the BoJ had intervened in October of that year to defend the 152.00 level in the pair. That intervention was enough to back bulls off of the highs, but the reversal didn’t show until the next month, on the back of a CPI print on November 10th, that drove another round of USD-weakness. USD/JPY followed in a big way and that sell-off lasted into 2023 until support played in at the 50% mark of that major move.
So if USD/JPY bears are going to get run, they’re probably going to need to see a similar scenario in the US Dollar; and for that to happen, markets will likely be tracking data for signs of growing weakness in the US economy.
But, its important to note, with a carry trade backdrop such as we have now, the reversals or pullbacks in that move can be fast and violent. Carry traders buying in drive the move and a long the way there’s a tendency for stops to be placed under supports.
Stops on long positions are sell to close logic, and usually they’re set to execute ‘at best.’ This means the possibility of slippage as the directive for that order type is ‘get me out even if at a worse price.’ And as that type of sell-off develops it can further motivate other bulls to close, leading to even steeper price drops and more stops taken-out along the way.
As a case in point, the Q4 reversal in 2022 wiped out 50% of the trend in three short months – that had taken 21 months to build.
USD/JPY Weekly Price Chart
 Chart prepared by James Stanley, USD/JPY on Tradingview
USD/JPY Strategy
At this point there’s the possibility for a greater turn but that’s probably going to need some help from US data getting less positive.
A daily close below the 155.00 level would be a key first step for bears taking greater control, and there's another spot of possible support at the swing around 154.50. But the bigger levels with a bit of historical reference are a bit lower.
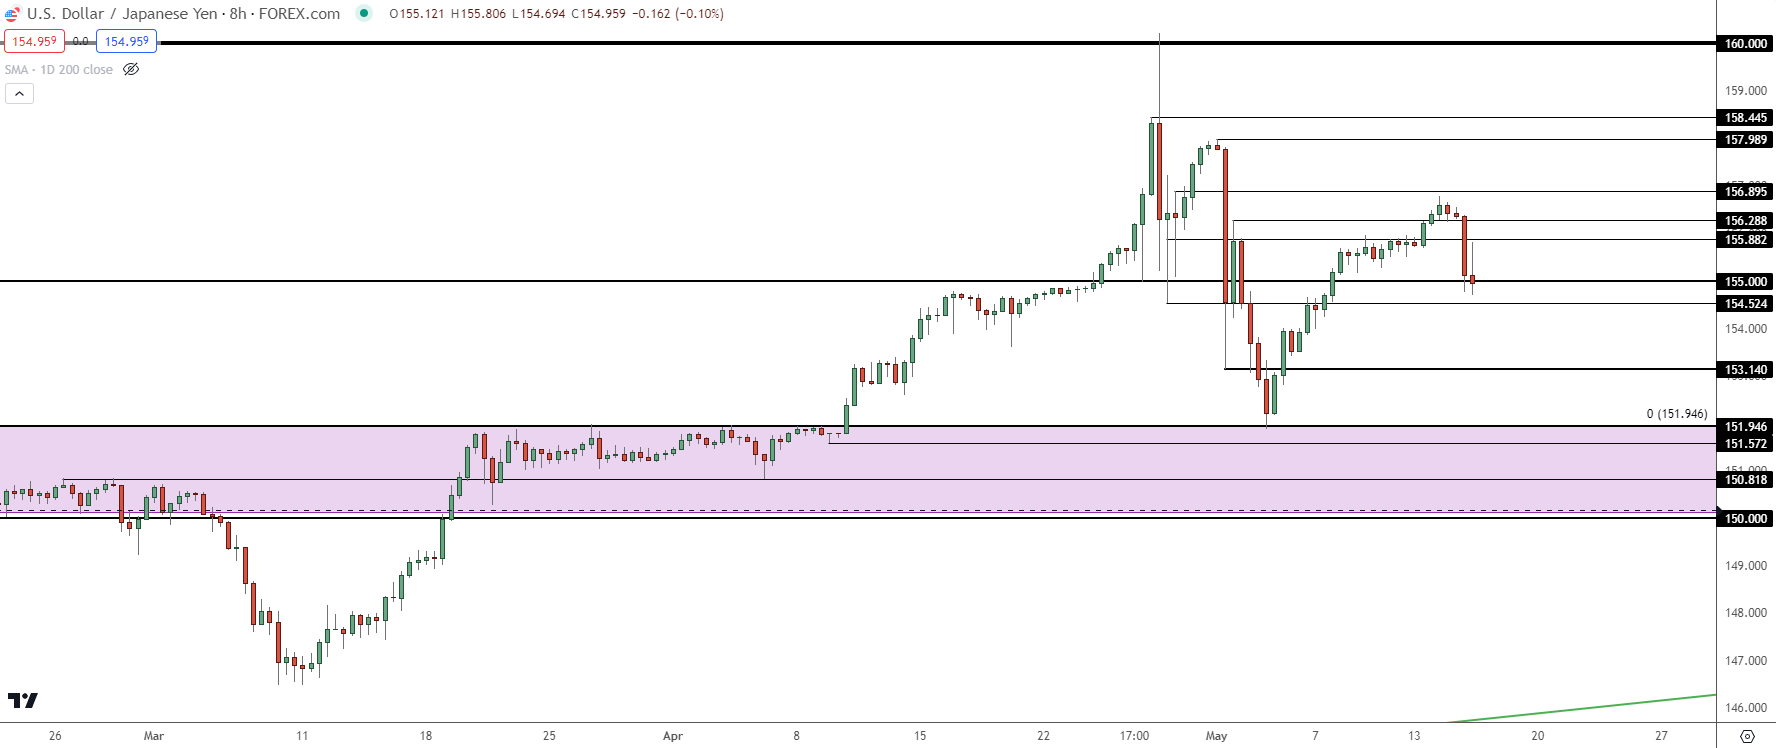
At this point the 151.95 level is of high interest. This was what held the lows on NFP Friday which then played into an almost 500-pip incline. If price breaks below that point, bears could get a bit more steam, and there’s another possible spot of support at 151.57. That’s followed by a point of resistance-turned-support at 150.82 and if that breaks, the 150.00 level is back in view.
It’s not all doom and gloom for bulls yet, however, as there is still an open door for topside scenarios, especially if the US Dollar finds support at the spot noted above. A daily close above the 155.00 level could be seen as a bullish factor as it would imply a level of defense from buyers. That would then expose swings at 155.88 and 156.28 for re-test.
Given the BoJ’s intervention at 160.00 that would seem to be a level that bulls wouldn’t want to re-test in the near-term, but there remains a lot of distance between current price and that point, perhaps too much to dissuade buyers so long as the US Dollar isn’t falling down.
USD/JPY Eight-Hour Price Chart
 Chart prepared by James Stanley, USD/JPY on Tradingview
--- written by James Stanley, Senior Strategist


