Japanese Yen, USD/JPY Talking Points:
- USD/JPY is trading at a fresh 34-year high as the pair has broken-out from the 155.00 level.
- While the Finance Ministry has already opined on the prospect of intervention, the bigger question is whether the BoJ starts to nod towards more rate hikes at tomorrow’s rate decision. Without a change in monetary policy, the concern is that any intervention impact could be short-lived as the carry is still decisively-tilted to the long side of USD/JPY.
- I’ll be discussing these themes in-depth in the weekly webinar. It’s free for all to register: Click here to register.
The stakes are getting raised in Japan as the Yen has weakened to a fresh 34-year low against the U.S. Dollar.
The next couple of days are big for this theme: The big question for tonight is whether the Finance Ministry orders an intervention now that USD JPY has traded through the big figure. Then Thursday night in the U.S. (Friday morning in Asia) brings the next Bank of Japan rate decision – and this would be the most opportunistic spot for Japanese policymakers to impact the theme. But there’s consequences to rate hikes, and for a Japanese economy with the very fresh memory of the ‘lost decades,’ that consequence may seem even more daunting, perhaps even to the point of inaction, as we’ve largely seen so far.
But – without a change in policy any intervention could be seen as but a speed bump and a possible waste of capital, as the positive carry on the USD/JPY pair can continue to drive asset flows and that could mean even more Yen-weakness. We’ve seen this multiple times over the past two years and it’s playing out again in front of our eyes.
Intervention isn’t exactly a simple prospect, as the BoJ is essentially forced to buy a currency that their very own monetary policy is pushing-down. This happens with the bank’s FX reserves, which are finite. If there were a simple answer, we’d likely already have seen it by now, but it really does appear as though the Bank of Japan is getting pushed deeper and deeper into a corner.
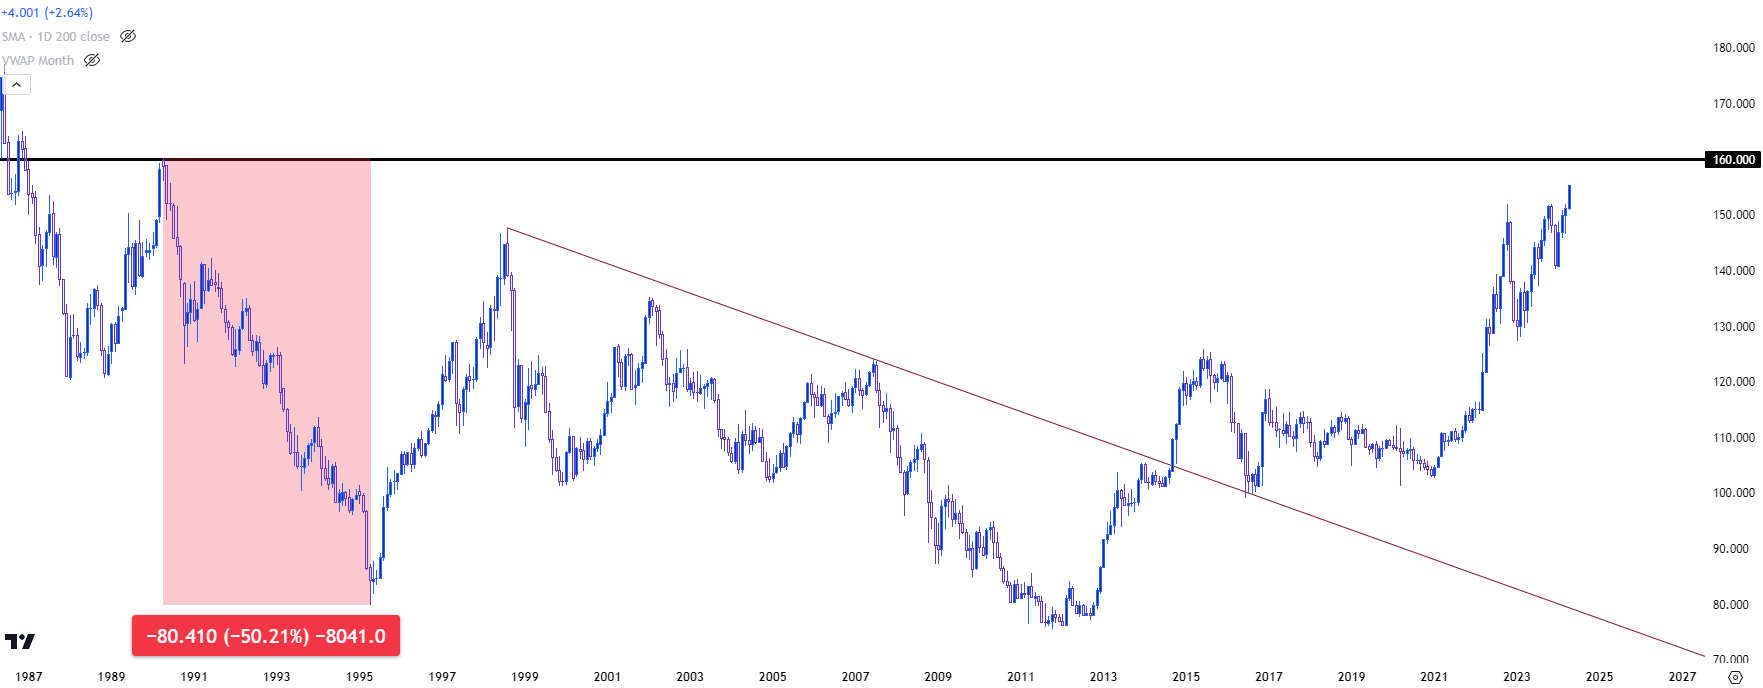
On the chart, the next major spot overhead is the 160.00 handle, which last traded in 1990; and it only traded briefly, right around the time that the Nikkei had topped. The response to that was brutal, as USD/JPY lost 50% over the next five years. That level of currency strength evaporated growth for the export-heavy economy, which led to the ‘lost decades’ in Japan, which impacted birth rate to play into the demographic dilemma that the country currently faces (and will continue to face).
USD/JPY Monthly Price Chart
 Chart prepared by James Stanley, USD/JPY on Tradingview
It’s a Policy Problem and Policies have Consequences
At the source of the move is continued disparity in Japanese and U.S. monetary policy, and this isn’t a new thing. As inflation showed in the U.S. economy in 2021, the bullish trend in USD/JPY got started and as USD/JPY climbed into 2022 trade, the prospect of rate hikes from the Fed to temper that inflation drove a strong bullish trend.
As the Fed began to hike in March of 2022, the trend went into hockey-stick mode, as a near-parabolic move developed and held through the first nine-and-a-half months of 2023. Japan stuck with negative rates throughout the Fed’s hiking cycle which only served to extend that disparity, as driven by the carry trade.
I used this as an example of numerous points in the fundamental analysis discussion of the Trader’s Course, and if you’d like to see the entire lesson, I’ve added that below:
Fundamentals from the Trader Course
Japanese Intervention/Hope for FOMC Rate Cuts
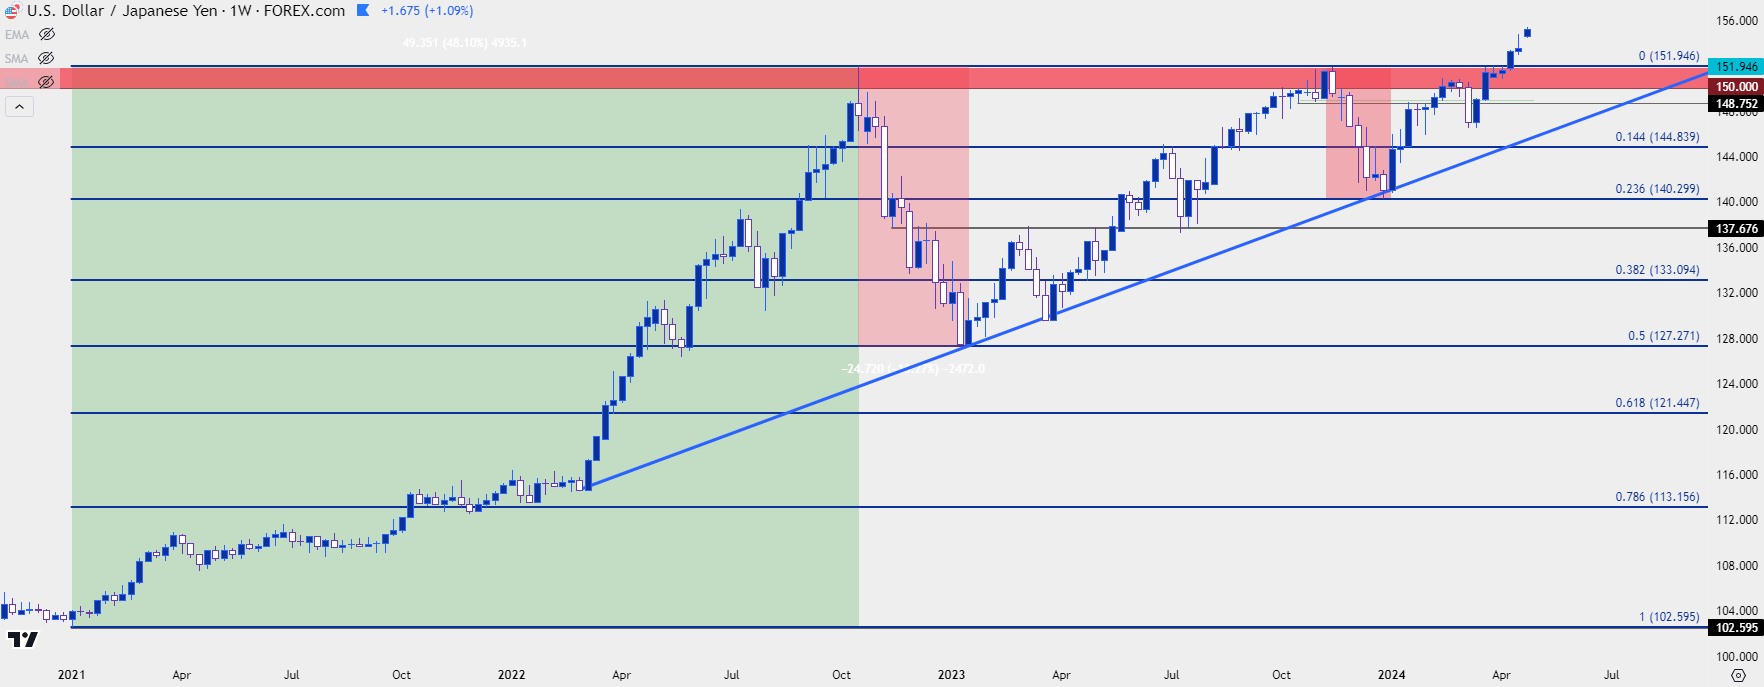
What finally tempered that trend in 2022 was first a show of intervention from the Bank of Japan, as ordered by the Japanese Finance Ministry. That stalled the move at the 150-152 area and pushed bulls back to support at 145. But what really drove the reversal was a lower-than-expected CPI print out of the U.S. on November 10th, giving hope that the Fed may be nearing the end of their hiking cycle. That created a three-month pullback that wiped away 50% of the prior bullish move, with support showing at that retracement level in January of last year.
The carry remained tilted to the long side, and as the Fed continued to hike and as U.S. data remained strong, USD/JPY got back to its bullish ways, eventually driving right back to the 150-152 area of resistance.
USD/JPY Weekly Price Chart
 Chart prepared by James Stanley, USD/JPY on Tradingview
Q4 Pullback
The Japanese Finance Ministry had made verbal threats of intervention last year, and that helped the pair to hold below the 152.00 level. And in November, a very similar driver appeared when another U.S. CPI report came in below expectations and fueled hopes that a rate cut might be the next move from the Fed, at some point in 2024. This retracement was a bit more shallow as price only moved down to the 23.6% Fibonacci retracement, bottoming on December 28th, alongside DXY.
Collectively – the two pullbacks in 2022 and 2023 helped to create an ascending triangle formation, which are often approached with aim of bullish breakout.
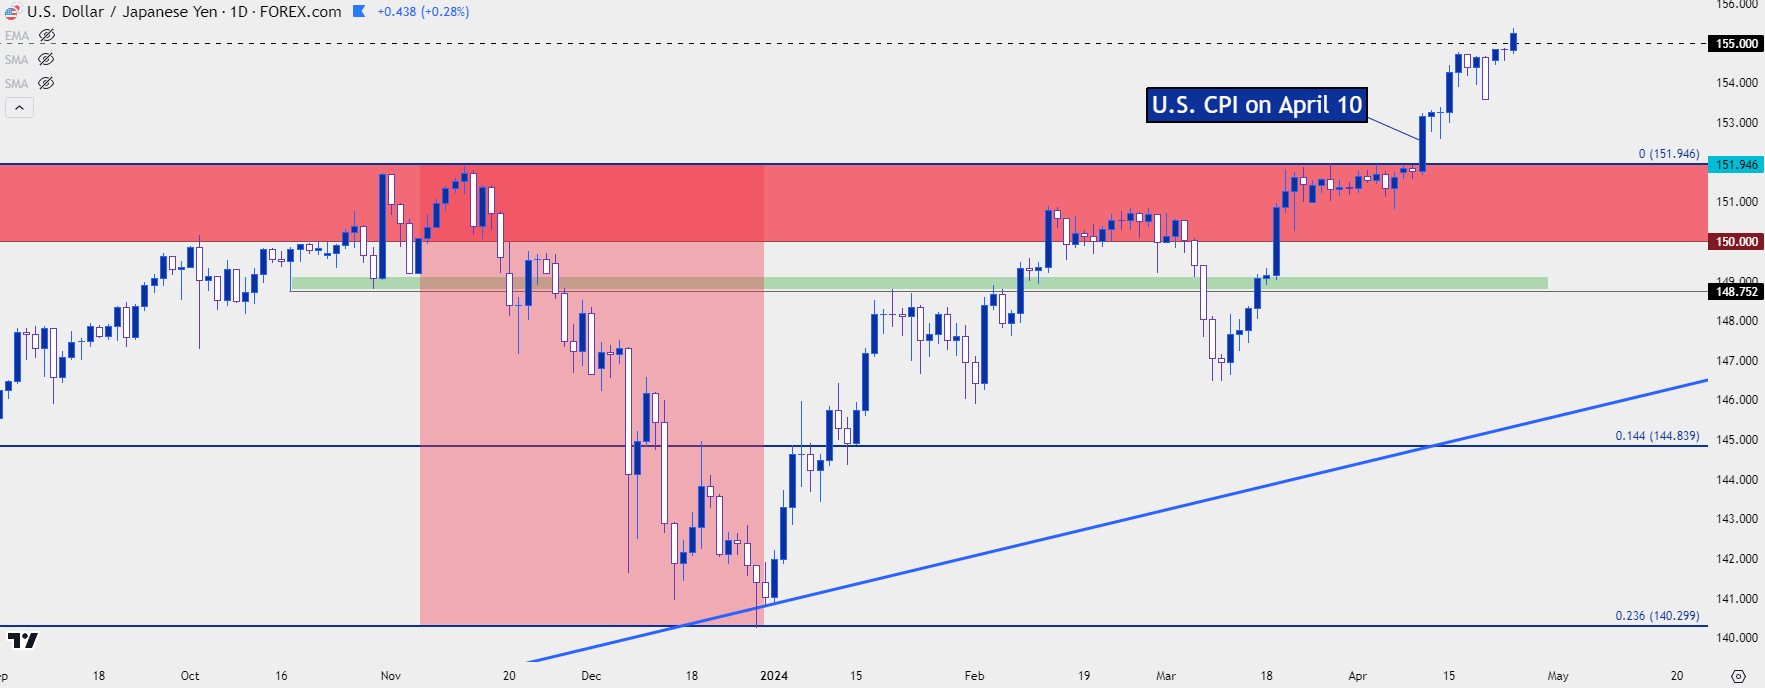
And that’s what hit on April 10th.
USD/JPY Daily Price Chart
 Chart prepared by James Stanley, USD/JPY on Tradingview
USD/JPY 155.00
I started talking about this in March after the Bank of Japan hiked rates. That was the first such move since 2007, but they were so incredibly careful while doing so that it highlighted their fear of tightening which seems to remain in-place today. They did push rates out of negative territory, to 0.1% from a prior -0.1%; but that was such a minimal change that the carry remained in-place, and if USD-strength was in the equation there was still attraction for traders to drive the pair higher.
But, perhaps more importantly than that is an episode of market mechanics. With that 152.00 level having been defended by the Finance Ministry already, with both verbal and actual interventions, then logically there were probably some stops lodged above that. Stops on short positions are ‘buy to cover,’ logic, and usually execute ‘at best.’ This is why and how stops get slipped – it’s from the logic of the order based on the liquidity in the environment - the aim is to get out of the market, even if it’s at a worse price. And for those shorts that got stopped out, if there weren’t sellers standing at the ready to offer liquidity to offset those buy orders, then price would climb until sellers came in.
And price has largely climbed-higher ever since, save for a pause at the 155.00 level, which has been taken-out today.
The next major spot on the chart is overhead at that 160.00 level and the focus is on the Finance Ministry tonight and the Bank of Japan tomorrow.
--- written by James Stanley, Senior Strategist


