Japanese Yen, USD/JPY Talking Points:
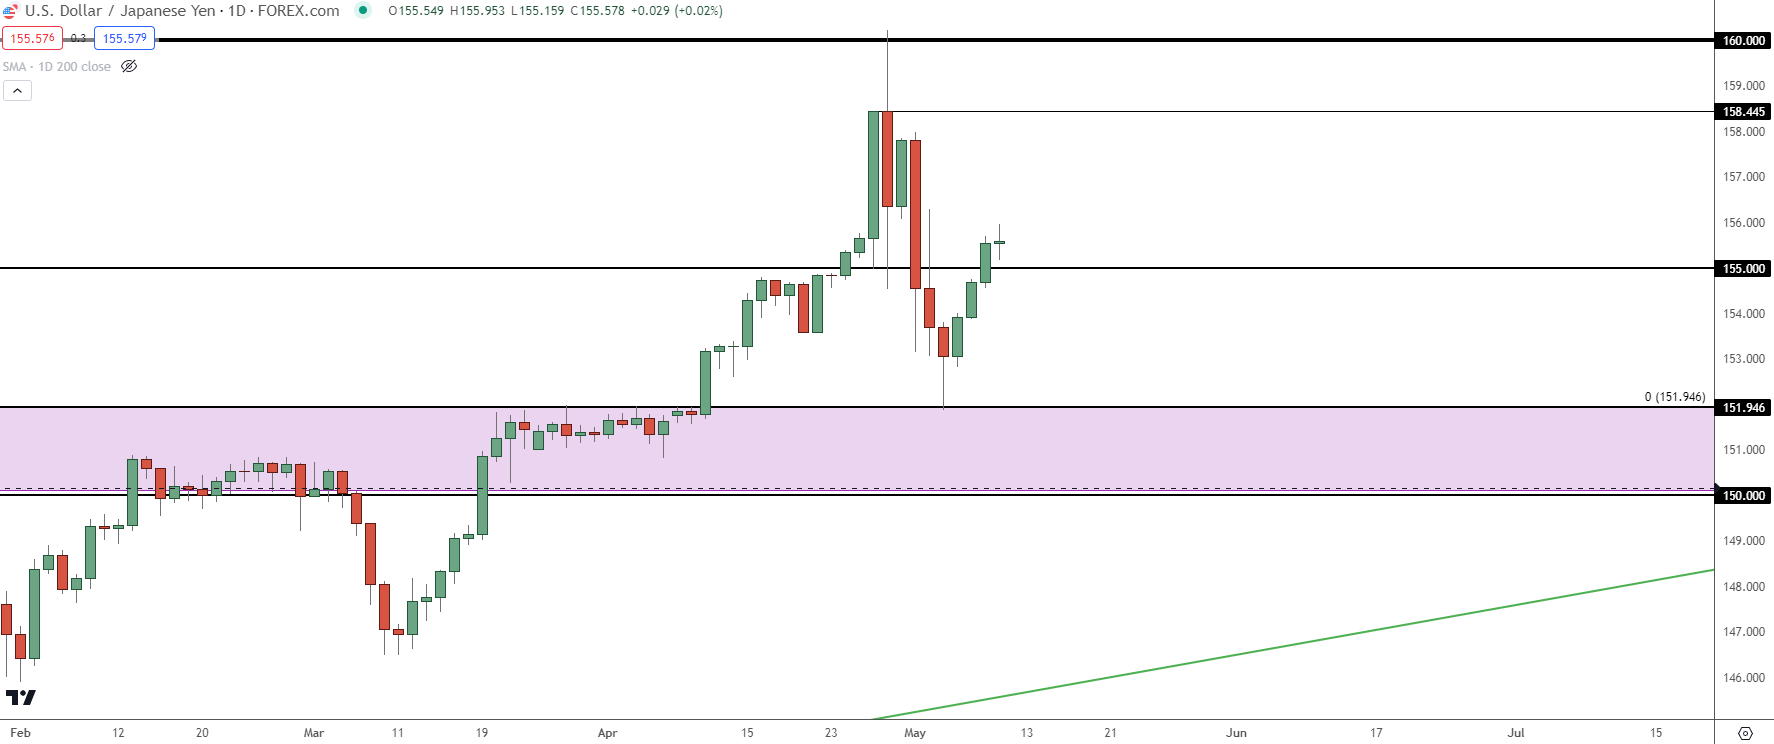
- USD/JPY has been in rally mode ever since last Friday’s test at 151.95.
- I had highlighted that support last Thursday ahead of the test, as that price was resistance in both 2022 and 2023. Since then, a strong bullish trend has developed, and it seems the one major fear factors for bulls would be another unexpected intervention from the Bank of Japan.
- Ueda mentioned the prospect of additional rate hikes this week and that wasn’t enough to dent the trend.
- I’ll be discussing these themes in-depth in the weekly webinar. It’s free for all to register: Click here to register.
It’s been a clean trend since last Friday morning.
That’s when the 151.95 level came back into play, just after the NFP report. This is a big level as it had held the highs in both 2022 and 2023, helping to provoke reversals even though carry remained aggressively-tilted to the long side of the pair. That price only traded briefly; for less than two minutes as bulls jumped back in to support the bid.
I had highlighted this theme on Thursday with a focus on that price level. And since then, bulls have continued to drive as the pair now sits approximately 370 pips higher.
USD/JPY Daily Price Chart
 Chart prepared by James Stanley, USD/JPY on Tradingview
As I had talked about a few times last week, intervention isn’t a great long-term solution. And this is, perhaps, one of the reasons the Finance Ministry did not order an intervention at 155.00 previously – because it was unlikely to be a lasting fix so long as rate differentials remain so far apart between the U.S. and Japan.
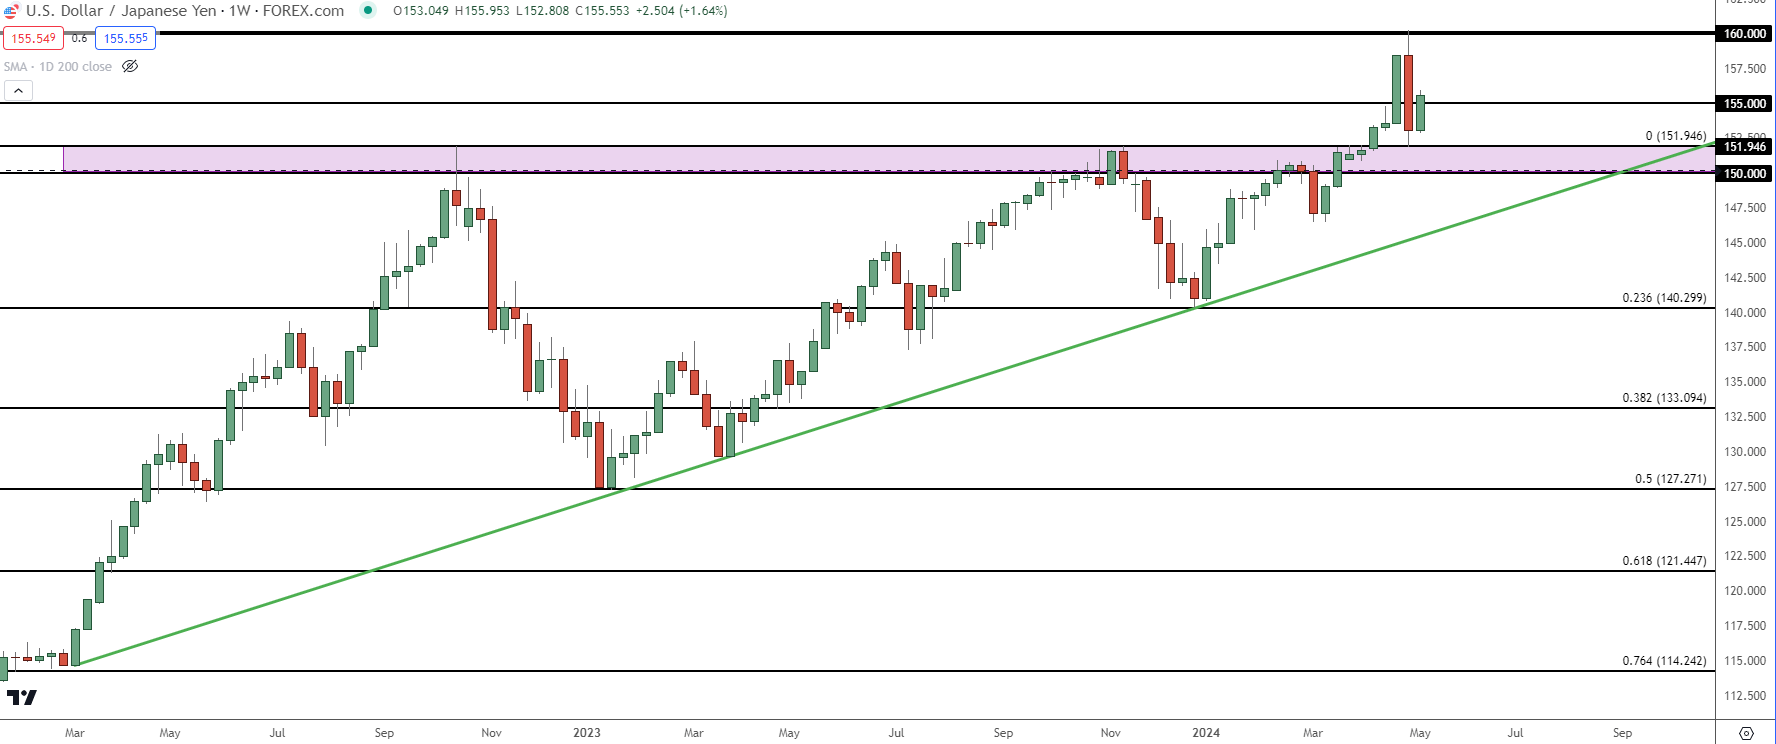
Over the past two years the major factor driving reversals wasn’t intervention or the threat thereof; but instead, a pullback or sell-off in the USD. The episode in 2022 is especially illustrative as the BoJ had intervened to defend 152 but that merely put bulls on their back foot, with continued support showing above 145.00.
What ultimately reversed that trend almost a month later was the U.S. CPI report on November the 10th that came along with the thought (or hope) that the Fed may soon be done with rate hikes. There was also a Euro-factor as the ECB had started to ramp up rate hikes in 75 bp increments and that further helped to pressure the USD.
If carry traders have a growing risk or fear of principal loss, that can be enough motive to close those trades and that’s what we saw in a big way in 2022 as USD/JPY retraced 50% of the 2021-2022 major move in just three months; and it had taken 21 months to build.
The pullback in 2023 was similar, albeit shorter-lived as the pair only retraced 23.6% of that prior trend. USD/JPY had jumped up to 151.95 at which point there were numerous threats of intervention. But it was another U.S. CPI report, this time on November 14th of 2023 that scared carry traders away from the trend. That retracement was milder, helping to set up the ascending triangle formation that I was highlighting in March, while warning of the potential for breakout.
USD/JPY Weekly Price Chart
 Chart prepared by James Stanley, USD/JPY on Tradingview
USD/JPY: How Offensive Does the BoJ Want to Play Defense?
If there’s not a larger fear of a USD reversal – the continued rate divergence could simply continue to add pressure to the long side of the pair. Intervention may be enough to scare away bulls from a price level but that’s not a permanent thing, and it may require even more intervention to continue to defend those prices. Intervention requires the Bank of Japan to burn finite FX reserves to, essentially, buy a currency that their very own monetary policy is pushing lower. The natural next question is ‘why not just raise rates?’ Well, there’s consequence to that, too, especially for a Bank of Japan that owns 54% of their own government bond market.
We know the BoJ intervened at 160 after last week’s open, but the alleged intervention after the FOMC rate decision remains a bit opaquer. Money market data indicates that there was in-fact an intervention, but there’s been no admission from any of the relevant parties. And then this week, US Treasury Secretary Janet Yellen openly voiced question to that premise.
But – this is not a factor that we cannot rule out, and for bulls, this would appear to be one of the main oppositions to continued recovery. This could make the prospect of chasing the trend a bit more daunting, but it does retain interest for trend continuation scenarios.
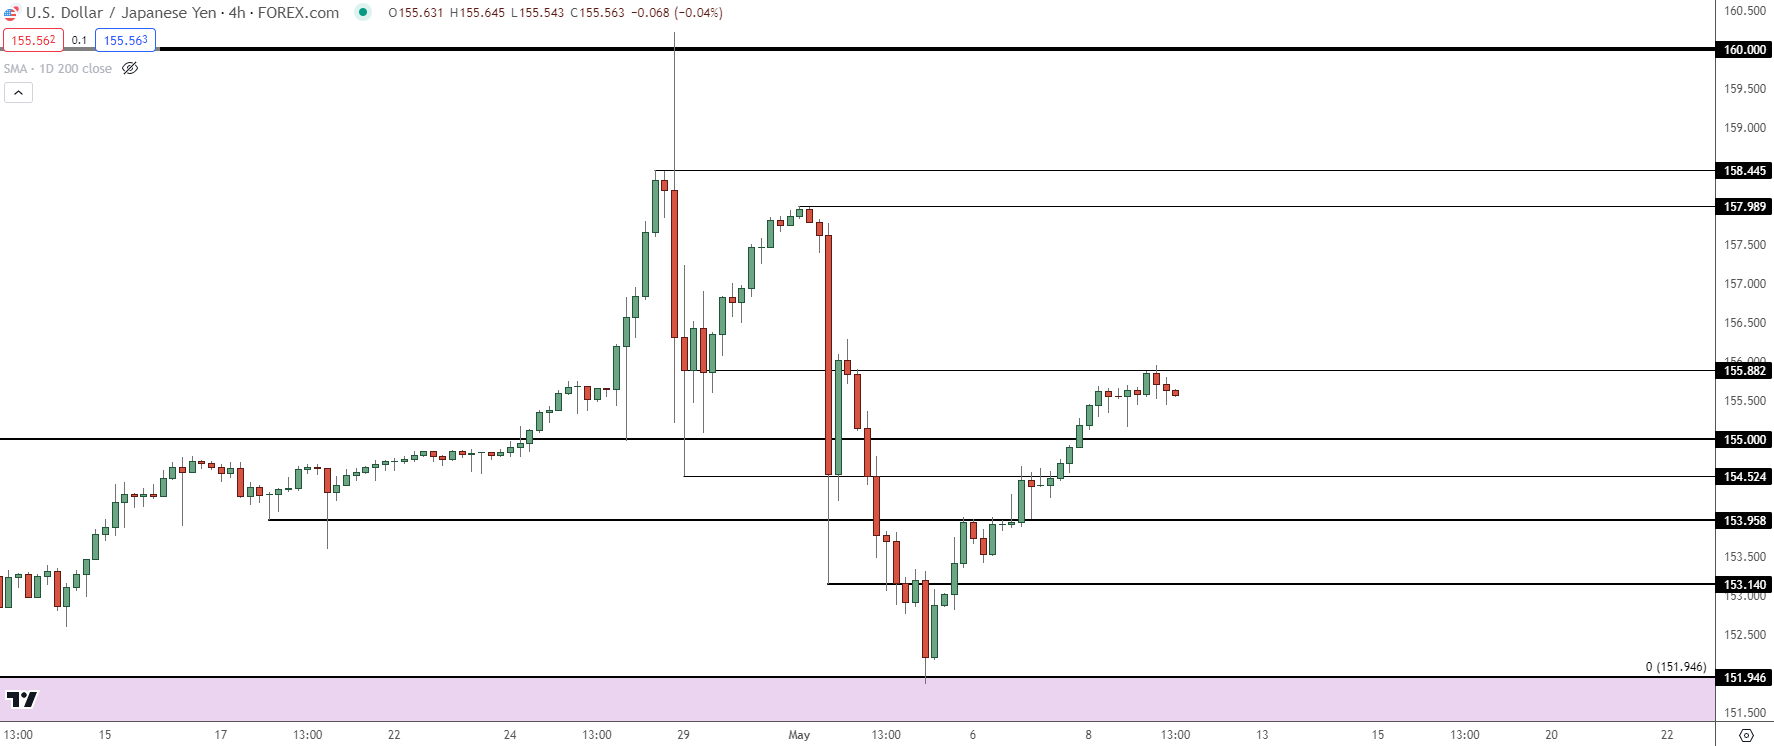
I had looked into something similar on Monday of this week, highlight a level of resistance from prior support at 153.95. At the time of that article that price was helping to set the high. But not even 24 hours later, after another breakout, price had pulled back for a support test there that ultimately led to the run through 155.00 and up to 155.88.
There could be similar scope for a pullback to the 155.00 handle and if that doesn’t hold, there’s another spot of support potential from prior resistance, around 154.50.
USD/JPY Four-Hour Price Chart
 Chart prepared by James Stanley, USD/JPY on Tradingview
What Can Ultimately Reverse This Trend?
It will probably take either rate cuts out of the U.S. or more aggressive hiking from the Bank of Japan. Both seem unlikely at this point which is probably one of the major drivers behind that trend – but – if U.S. CPI comes out well-below expectations next week, that can start to feed the rate cut theme around the Fed which could then have reverberations across market. In that scenario, I would expect USD weakness to go along with strength in stocks.
After all, the main driver of reversals in the pair over the past two years were below-expectation Core CPI prints out of the United States; and the past four months have seen all beats on that data point, so if the number comes in below-expectations, there could be quick shuffling that could shake longs out of the pair, and perhaps even lead to a reversal or pullback theme in USD/JPY.
The thought of BoJ rate hikes impacting the trend has held little hope so far, and like we saw in March when the Bank of Japan hiked rates for the first time since 2007 – it wasn’t enough to unsettle the carry trade. And that’s when bullish breakout potential started to look more likely, as there was a plethora of stop orders sitting above 151.95. Stops on short positions are ‘buy to cover’ logic, usually with ‘at best’ market execution. This is the same logic behind why stops get slipped – the order is designed to get out of the trade ASAP, even if at a worse price.
If this saga prolongs for long enough, there could be a similar repeat at the 160.00 level. That’s the price that’s been defended thus far, there’s some historical scope behind that level (going back to 1990), and this is probably a level that the Finance Ministry would not want to see the pair trade beyond. That can lead to traders trying to take shorts inside of that price, which could lead to stops above the level which, again, could lead to a fast break out when price tests through the big figure. But there’s some distance between current data and that scenario, in my opinion. For now, the focus is on support and the USD for indications of a more broad-based USD reversal theme.
--- written by James Stanley, Senior Strategist


