
Japanese Yen Talking Points:
- USD/JPY has pushed past the 160 level and is now trading at a fresh 37-year high, at levels not seen since December of 1986. I had highlighted this scenario last Thursday in the Japanese Yen Price Action Setups article.
- There were threats of intervention earlier in the session from Masato Kanda of the Japanese Ministry of Finance, which did bring a quick pullback to USD/JPY: But the fact that he was threatening intervention was read that they weren’t actually ready to intervene, and that led to a strong topside push in the pair, setting that fresh 37-year high.
- Does the fact that the BoJ hasn’t yet intervened after the 160 breakout mean that they won’t, and that there’s a free ride up to the next big figure at 165 or 170? No – absolutely not, this is a fluid situation and matters can change very quickly. As always, prioritize defense.
- If you’d like to attend next week’s webinar as it’s happening live, the following link will allow for registration: Click here to register.
It was another breakout in USD/JPY today as the pair pushed through the 160.00 handle. That was the price that was defended by the BoJ in late-April, leading to an 800+ pip sell-off in the week that followed. Support eventually showed at prior resistance, on the morning of NFP in early-May, and that led into a rally that saw those 800 pips clawed back by bulls which led into this morning’s breakout.
Interestingly the US morning began with threats of intervention from Masato Kanda of the Japanese Ministry of Finance, and one might even be able to say that those comments helped to provoke the move. Kanda stated that he was seriously concerned about the rapid weakness in the Yen, also stating that current weakness in the currency was not justified.
But, really, the source of the USD/JPY trend can be drawn right back to the carry trade and the still-wide rate differentials between Japan and the rest of the world. Logically, if the BoJ wanted to shift that paradigm they could start to do so by hiking rates. But as we heard at the June rate decision, it doesn’t seem as though the bank wants to do that just yet and thus, we have a continued breakout in several Yen-pairs, even EUR/JPY where the ECB has already begun their rate cutting cycle.
Of course, there is consequence to rate hikes in Japan after years of yield curve control and a bloated balance sheet at the BoJ; and that’s like the reason that the bank doesn’t want to tighten more aggressively. And this is also why their one mechanism of quelling Yen weakness so far has been intervention or threats thereof.
But after the April intervention yielded such poor results, with price merely pushing right back to the 160.00 level after costing $62 billion in finite capital reserves, the question his how much tolerance the MoF might have for trying to manage the situation with more interventions.
USD/JPY Daily Price Chart: Fresh 37-Year Highs
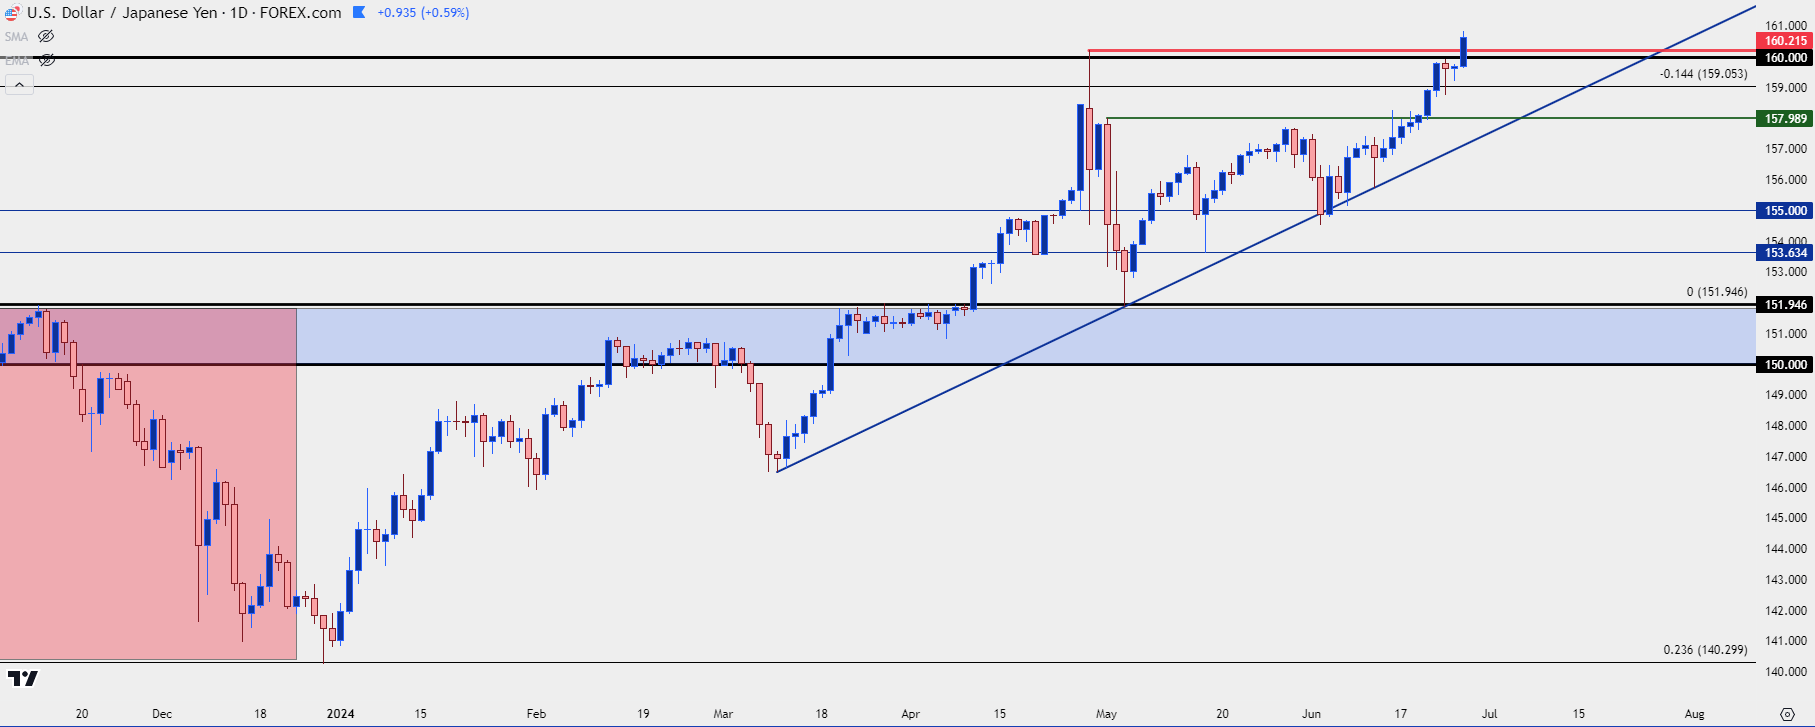 Chart prepared by James Stanley, USD/JPY on Tradingview
Does This Mean the BoJ Won’t Intervene Until 165 or 170?
While major psychological levels are common waypoints for such scenarios, the fact of the matter is that this is an unpredictable situation. There are some prior samples to work off, however, but in that case, we’re dealing with a rather small sample size. So, like any other aspect of market analysis, there’s no free lunch here.
In the past there’s been a pattern where the Ministry of Finance would opine about currency weakness not matching fundamentals along with threats of possible intervention; and that would then be followed by an intervention that would often appear unexpectedly.
Back in 2022 when the pair was making a run on the 150.00 level, the MoF had sent out a similar warning. And then on morning the pair pushed right through 150.00, and it didn’t stop until USD/JPY made a move towards the 152.00 level. The BoJ intervened to set the high on USD/JPY at 151.95, and that put bulls on their back foot.
But – even then, it didn’t lead-in to a full-fledged reversal, it only set bulls on their back foot. For the reversal, it was the US CPI report that was released a couple weeks later and as US inflation was showing below expectations, there was the thought (or hope) that the Fed would soon be able to cool rate hikes and eventually go back into a cutting pattern.
It only took three months for USD/JPY to wipe out 50% of the carry-driven trend that had taken 21 months to build, but it wasn’t because of intervention – it was driven by USD-weakness and the hope that the Fed would soon be able to shift from a hiking cycle and into rate cuts.
Verbal intervention was back in play in 2023, as USD/JPY was re-testing the same 151.95 level that had held the high the year before. But, that time, the BoJ didn’t need to intervene as another below-expectation US CPI report drove a round of USD weakness that helped to prod a pullback in the move. But, this time it was only a 23.6% retracement as support showed at 140.30 before bulls took control again.
What’s the point of this history lesson? Well, the fact is that the biggest driver of reversals in the USD/JPY pair over the past two years has had little to do with intervention and, instead, was driven by USD weakness, which helped to unwind some of the carry trade that had driven the pair to such heights.
This puts even more focus on this Friday’s Core PCE report as that’s the next major data point speaking to US inflation.
USD/JPY Weekly Price Chart
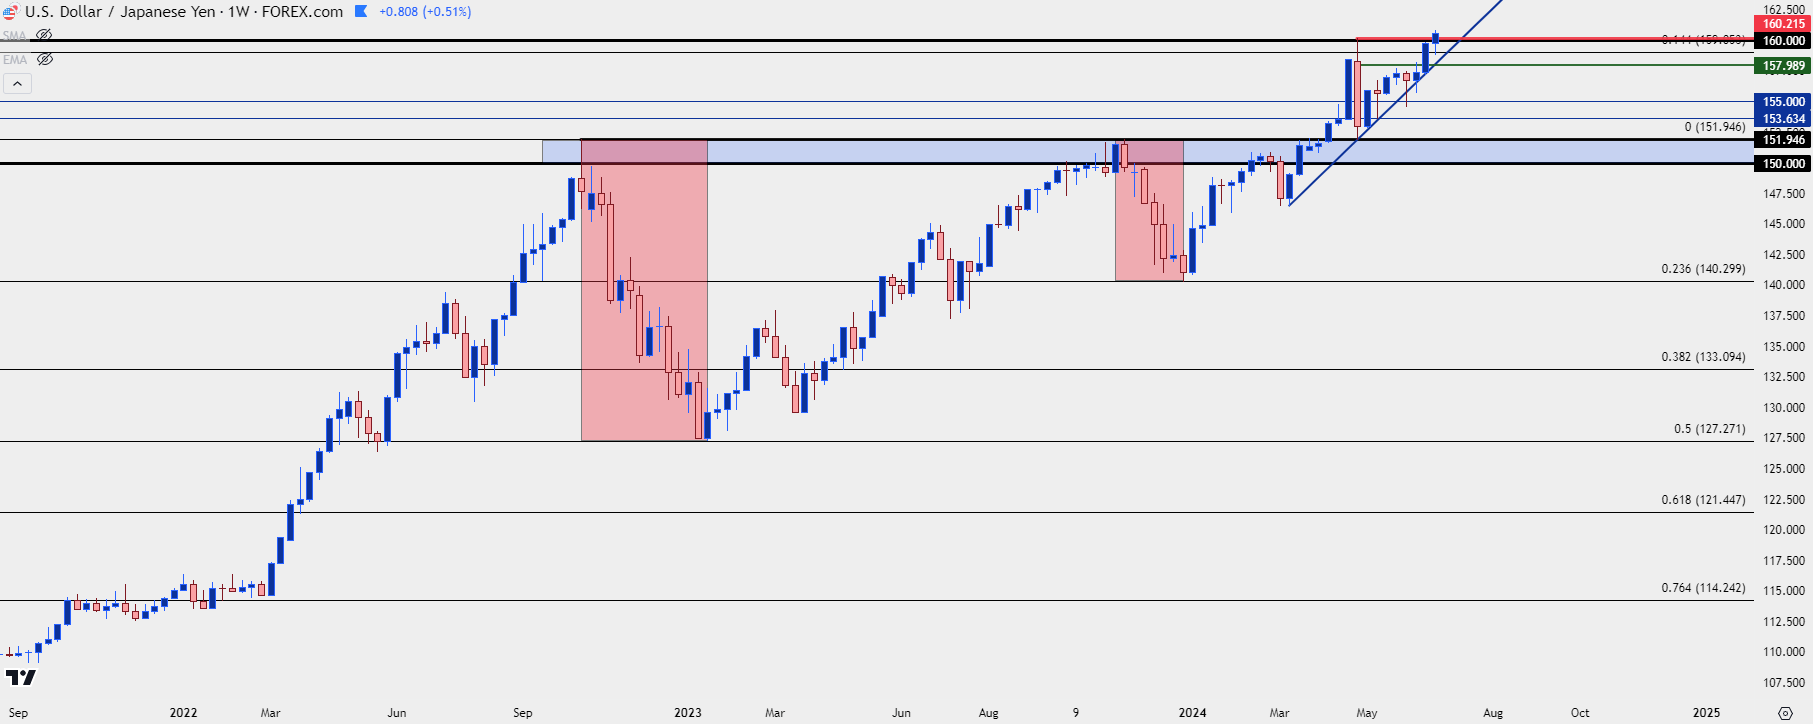 Chart prepared by James Stanley, USD/JPY on Tradingview
Intervention Scenarios
If the BoJ is asked to intervene from the Finance Ministry, the next operable question is what’s next?
USD/JPY has been a strong carry trade for years at this point and given that markets are driven by supply and demand this highlights that there’s likely a lot of longs still holding on as demand has far outpaced supply since the trend began back in early-2021. And when we do get those shocks of fear, that can prod some of those longs to close positions, which can lead to sharp pullbacks like we saw in Q4 of 2022 and 2023; or, on a shorter-term basis, what we saw in late-April as driven by that intervention.
But also like we saw in that prior example of intervention, once bulls have been backed off if there’s not an ongoing fear of more intervention, that can be an invitation to jump on a pullback.
The carry behind the pair still matters: And longs can earn rollover while shorts are forced to pay it, meaning there’s built-in motivation on the long side which can lead to a trending environment.
So, if there is an intervention – don’t try to catch the falling knife. For bulls, it’s probably best to wait, try to be patient, and let a support level show so that risk can be managed.
That 151.95 level that was resistance in 2022 and 2023 is what showed as support after the recent intervention, and that’s the point that drew bulls back-in on the basis of that carry until, eventually, price was back up to the 160.00 big figure.
And over the past couple of months, as USD/JPY was in that 800+ pip climb from support – episodes of weakness in the trend appeared alongside USD-weakness, such as around the US CPI report released in mid-May, or the pullback in DXY that appeared around the June open. Because if there’s fear that the USD is going to drop there can be motivation for carry traders to close positions, realize profits and wait for a better entry.
Over the past month, those pullbacks have been mere invitations for bulls to jump back on the bid while driving the trend-higher.
USD/JPY Four-Hour Price Chart
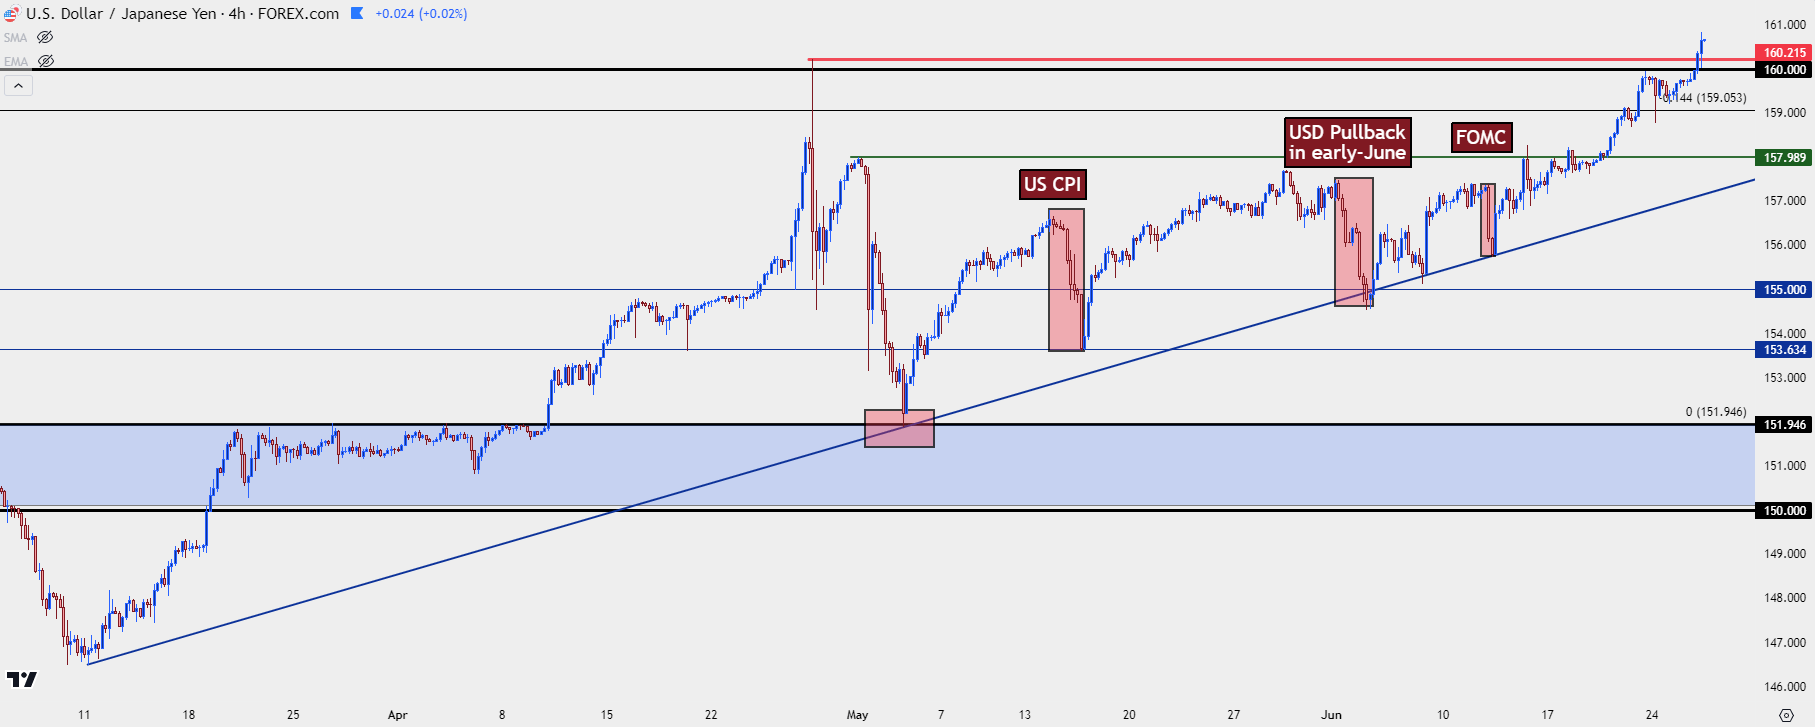 Chart prepared by James Stanley, USD/JPY on Tradingview
Non-Intervention Scenarios
At this point we’ve heard the warnings and USD/JPY has simply broken out to a fresh high. What if the BoJ doesn’t intervene until 165 or perhaps even 170? That wouldn’t be out of the realm of possibility and that would mirror the 2022 scenario.
In 2022 the verbal intervention started around the 145.00 handle in USD/JPY which did help to stall the move. But traders continued to push and soon 145 was in the rear view, and the focus then shifted to 150.00.
Given how badly the last intervention worked out for the BoJ it wouldn’t be surprising to see something similar happen here; but, again, expect the unexpected because we’re in the midst of some fairly exceptional circumstances with the Japanese Yen.
But, in that scenario the big question is whether or not the US Dollar would be the most operable venue to run with Yen-weakness?
As I shared on June 13th, AUD/JPY may be a bit more attractive to Yen-bears. And while the question remains as to when the US might start cutting rates, there’s actual conversations around the RBA about possible rate hikes. At the time, AUD/JPY was holding resistance inside of the 105.00 handle after building an ascending triangle, which is often approached with aim of bullish breakout.
The breakout hit less than a week later and the pair has been running higher ever since.
AUD/JPY Daily Price Chart
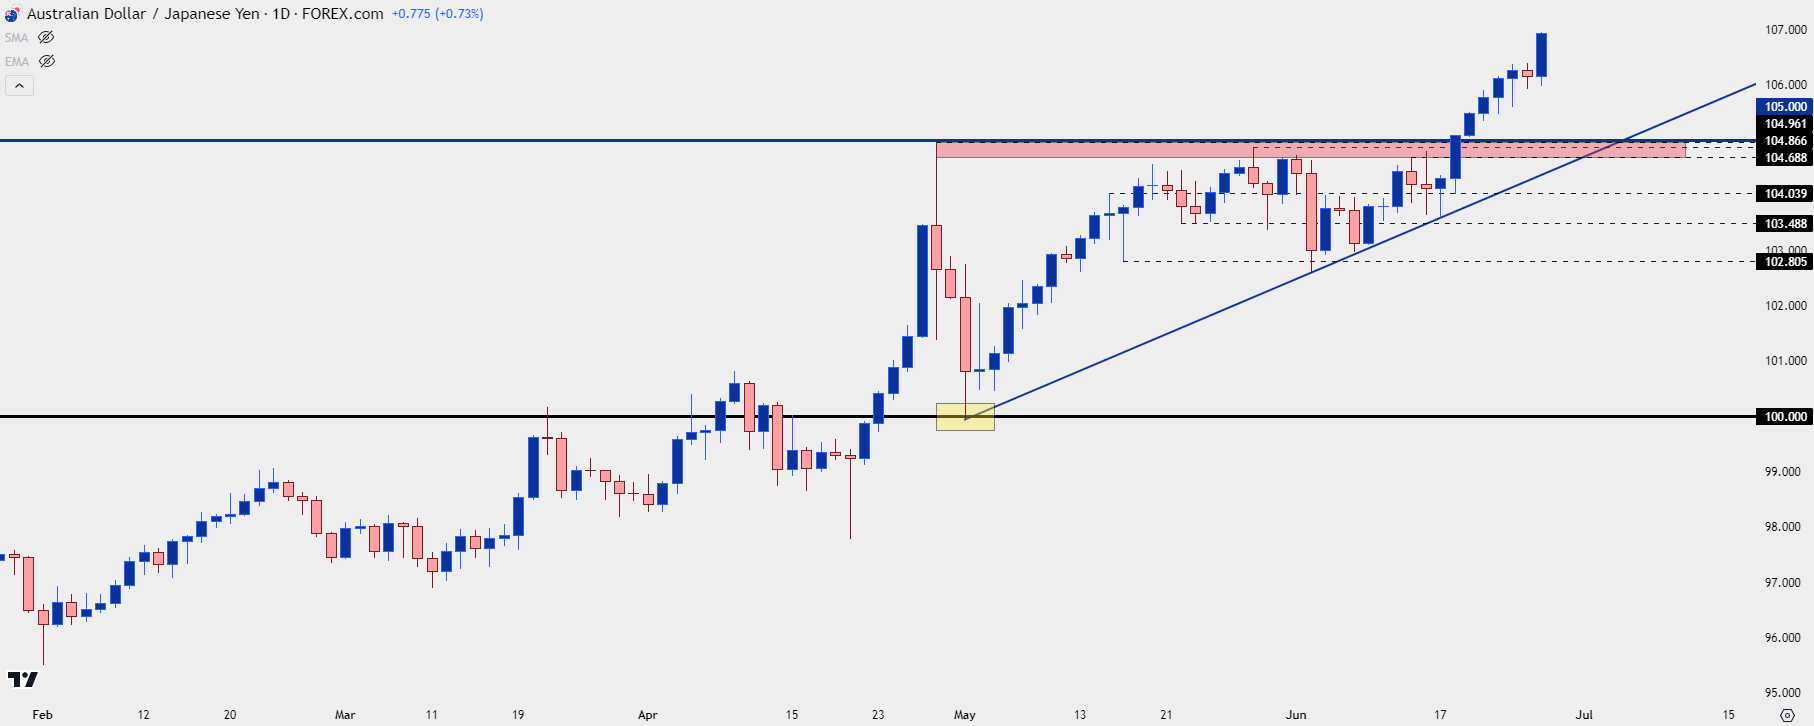 Chart prepared by James Stanley, AUD/JPY on Tradingview
GBP/JPY has a similar backdrop with a recent ascending triangle breakout, and it’s taken out the psychological level at 200.00.
If there is an intervention scenario to deal with, that becomes a spot of support that could be of interest for pullback scenarios. Given the fundamental backdrop I would consider this less attractive than AUD/JPY, but the techs are fairly clear as the pair has just pushed up to another fresh 15-year high.
GBP/JPY Daily Price Chart
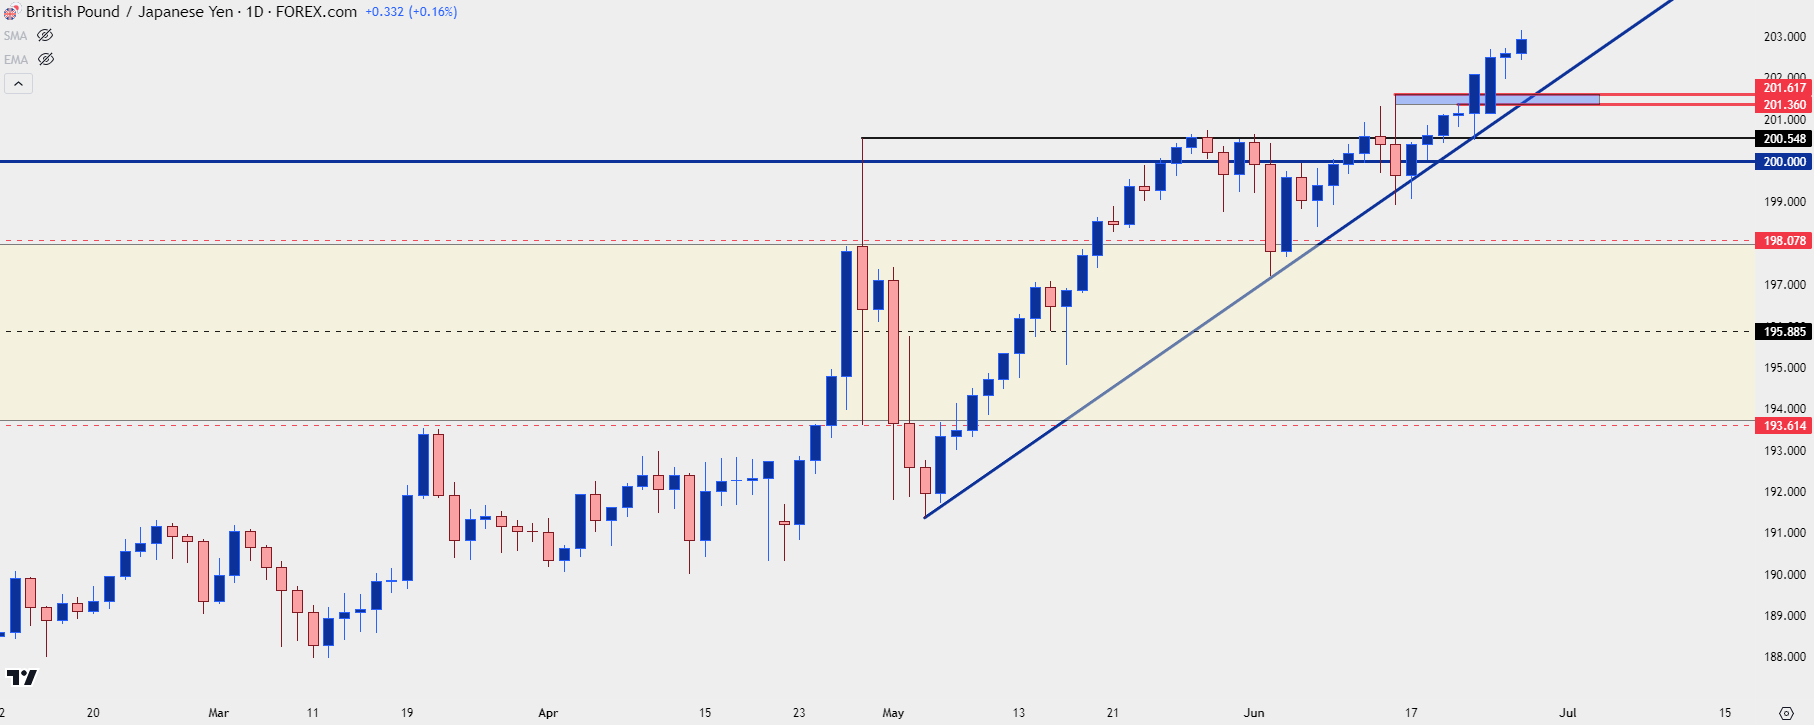 Chart prepared by James Stanley, GBP/JPY on Tradingview
--- written by James Stanley, Senior Strategist


