
Japanese Yen Talking Points:
- Yen-strength showed up overnight after another fresh warning from the Japanese Finance Ministry.
- Masato Kanda, Vice Finance Minister for International Affairs, said that Japan stands ready to take action against Yen depreciation, commenting that “We’re watching currency moves with a strong sense of urgency, and ready to respond appropriately if we see excessively volatile moves.”
- This helped to evoke pullbacks in EUR/JPY and GBP/JPY, and USD/JPY pushed below the 150-handle before pushing back for a re-test following the release of Core PCE in the U.S. The question now is which markets may be more opportune for continued Yen-weakness and which may be more opportunistic for reversal potential.
The Japanese Yen has been one of the weakest currencies in the world so far in 2024, and with the economy going into recession as inflation has started to fall, it seems like there may be even less tolerance for rate hikes anytime soon from the BoJ. That’s allowed speculators to push further on carry trades, with GBP/JPY jumping to a fresh eight-year high and EUR/JPY making a strong run towards re-testing the 15-year highs that were set last November.
In USD/JPY, however, traders had clawed back almost the entirety of the Q4 sell-off while pushing price back into 150-152 zone, which has elicited reversals in each of the past two years. That latter price of 152 seems to be the level that the Finance Ministry was cautious of in the past, as that brought out an intervention in 2022 that ultimately helped to form a top at the fresh 33-year high. That same price almost came into play again a year later, just before U.S. CPI was released in mid-November, which, again, elicited a sizable reversal in the pair that held over the next seven weeks.
But, unlike the 2022 episode, bears didn’t have as much room to run, and a contributing factor was the U.S. Dollar as DXY found support in early-2024 trade and began trending higher; and USD/JPY has tracked that theme well while funneling into a rising wedge formation.
USD/JPY Daily Price Chart
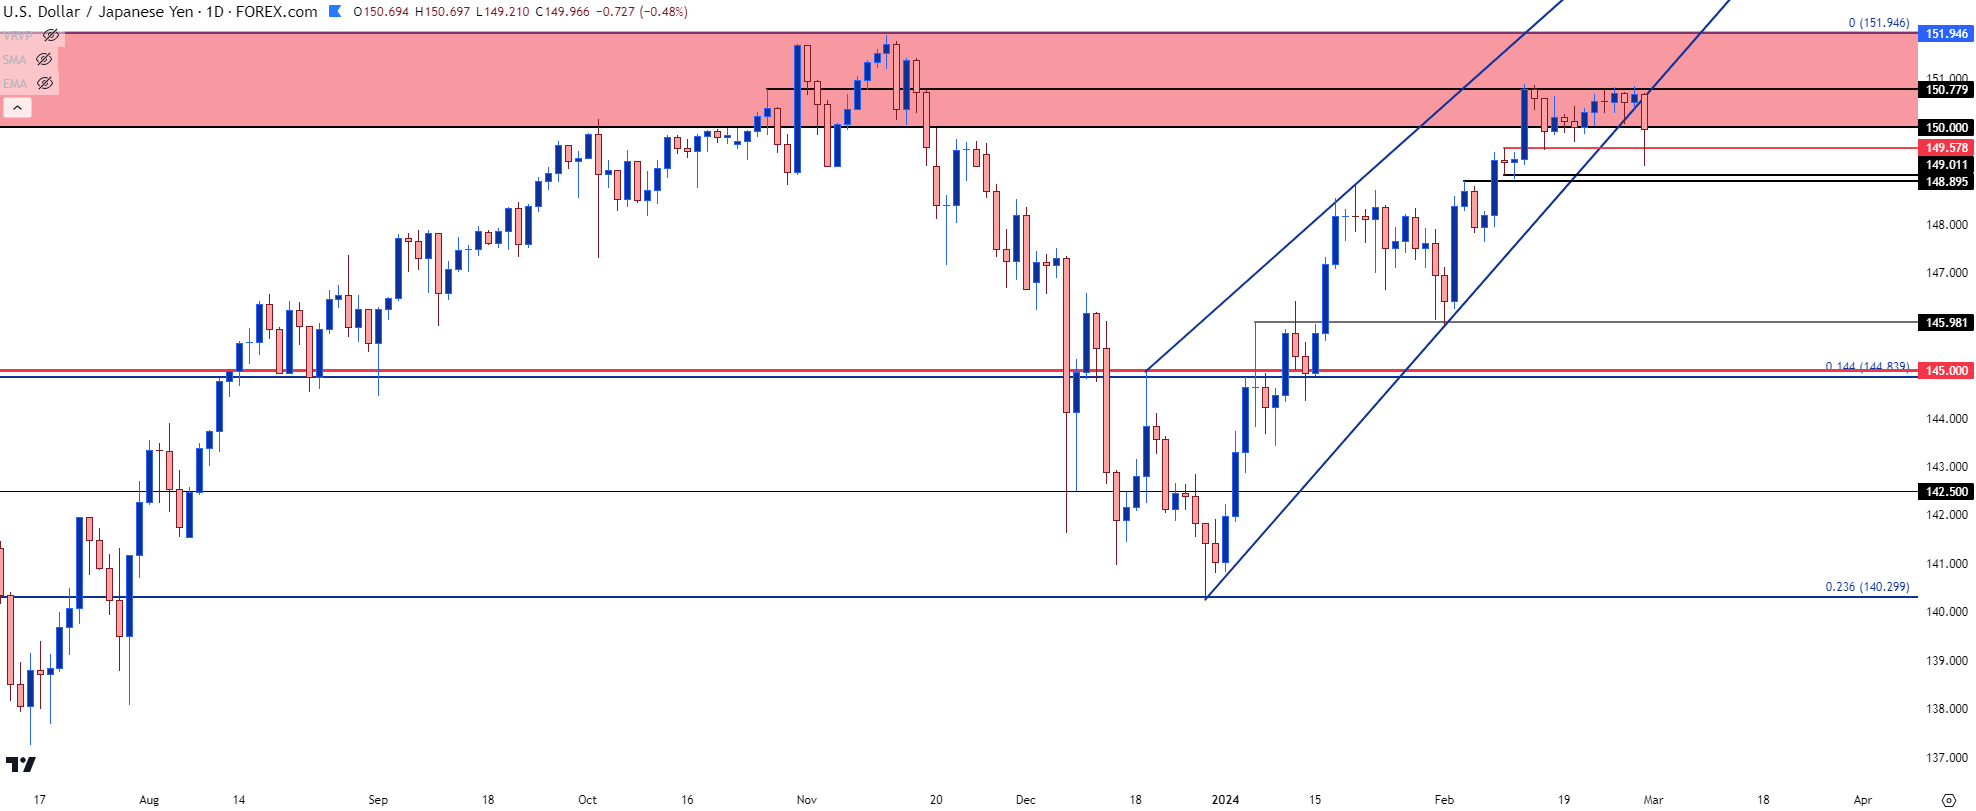 Chart prepared by James Stanley, USD/JPY on Tradingview
Yen-tervention
This isn’t the first episode or threat of Japanese Yen intervention that’s been in the headlines and, in the past, there were usually a number of verbal warnings, similar to what was heard last night, before an actual intervention took place.
Intervention isn’t an easy task, nor does it come without risk: The Japanese Finance Ministry generally orders the Bank of Japan to intervene, and this involves using finite capital reserves to buy JPY against other currencies. So, in essence, this would entail using capital to buy down a trade that their very own monetary policy is encouraging. The longer-term answer to solving the problem would be hiking rates and trying to reset the tables of that monetary deviation between Japan and other nations with higher interest rates; but that of course comes with other consequences and for a Japan that’s started to see economic growth with the Nikkei finally setting a fresh all-time-high, there may not be much tolerance for tighter policy options at the moment.
But the carry remains strongly positive in many Yen-pairs, USD/JPY included. And this is a contributing factor as to why strength came back so quickly in this cycle as opposed to the prior year when the sell-off ran for about three months while erasing 50% of the prior trend that took 21 months to build. With the U.S. Dollar showing strength in early-2024 trade, that carry was an attractive prospect and with price well-below the 150.00 zone where the Finance Ministry had grumbled in the past, there was seemingly an open door for USD/JPY bulls to push price right back to resistance.
This monetary deviation doesn’t necessarily mean that the BoJ, or the Finance Ministry, is without hope. When this played out in 2022, and the Finance Ministry ordered an intervention, it was enough to push bulls back down to support around the 145 handle, which held for a couple of weeks until the U.S. Dollar started to reverse. This was on the back of a lower-than-expected CPI report and this is also around the time that rate hikes were getting priced-in more aggressively in Europe and the U.K., further helping DXY to fall. And that crafted a strong reversal move in the Yen.
So, while intervention may not be seen as likely to elicit a full-fledged reversal as carry would remain decisively tilted to the long side, it could function as a first step of stalling bulls. The big question after that is whether USD-bears can take over.
Because while the carry does remain positive – the prospect of principal losses can fast make that carry trade an unattractive prospect, just as we saw in Q4 of both 2022 and 2023.
This is also a likely reason for the current rising wedge in USD/JPY. Bulls have remained aggressive and active around tests of support; but a bit less so on tests of fresh highs. Such formations are often approached with aim of reversal potential and that’s what started to fill-in last night after Kanda’s intervention threat.
USD/JPY Four-Hour Price Chart
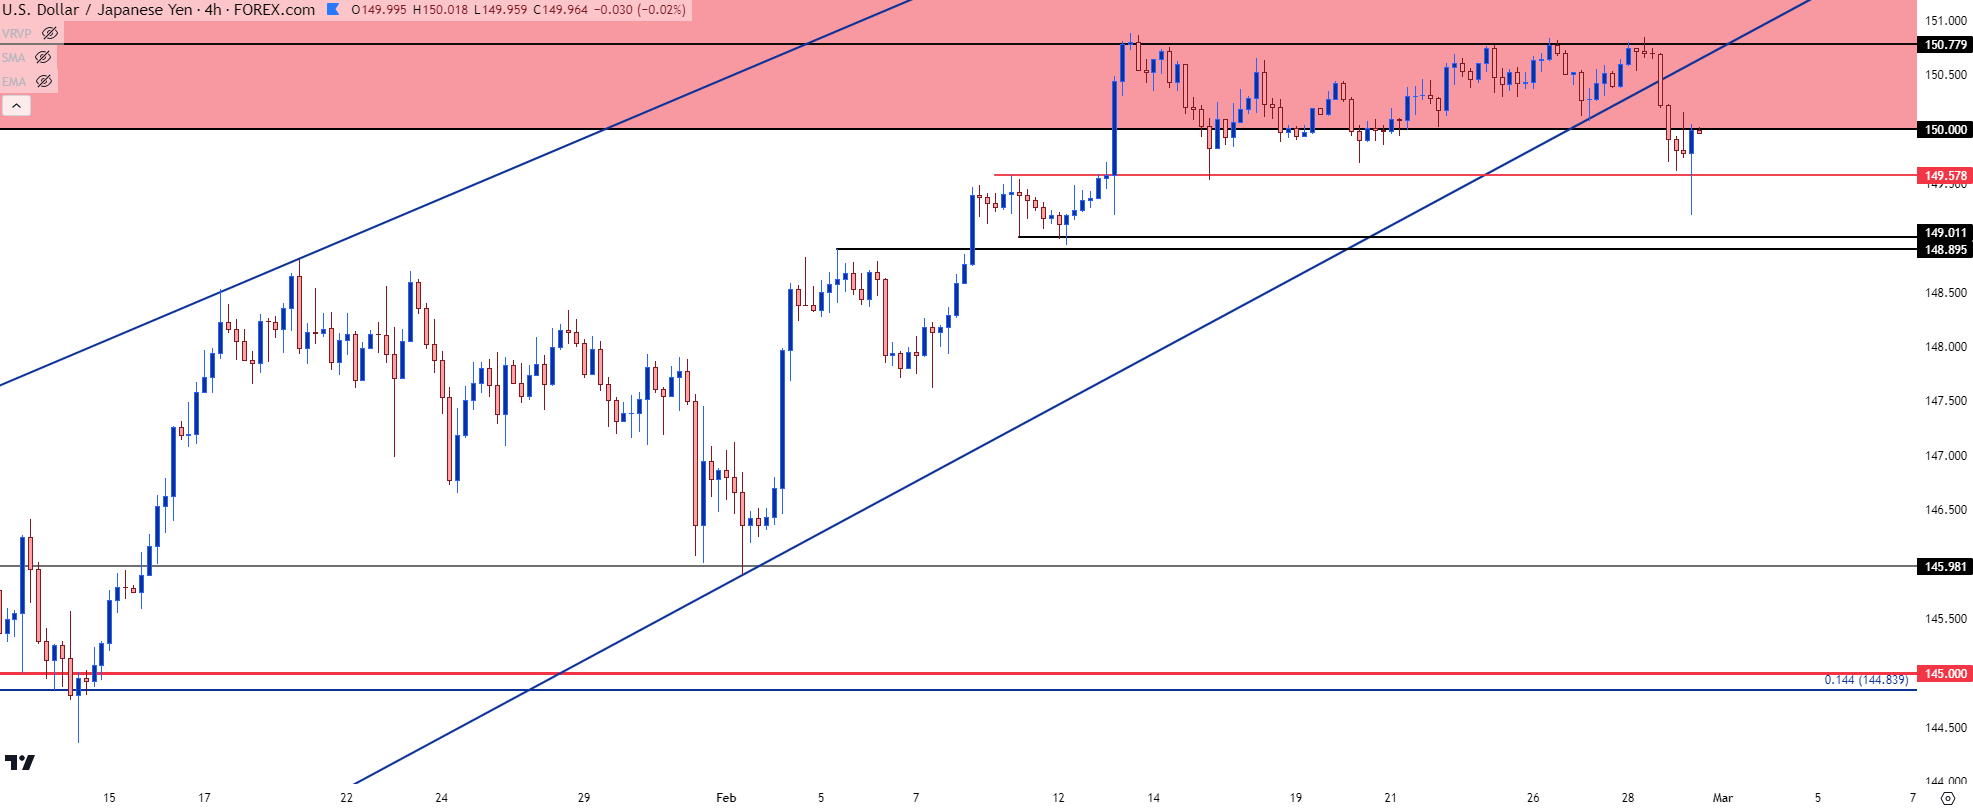 Chart prepared by James Stanley, USD/JPY on Tradingview
The Prospect of Opportunity v/s the Fear of Failure
Trending biases can be a helpful aspect of market analysis. But, of course, not every trend continues forever. Upon deeper investigation it’s the reasons for those trends that should remain of interest to traders because that’s also a way to build in the expectation for some sort of ‘change.’
In the Yen, the reason for weakness is fairly clear, and that’s the fact that the Bank of Japan hasn’t touched rates while most other major economies have been forced to hike to try to ward off inflation. As rates of USD or GBP or the Euro have lifted higher, so has the carry on USD/JPY, GBP/JPY and EUR/JPY, thereby acting as a driver to the long side of those pairs.
As more traders jumped into join the carry, there was also principal appreciation to go along with the long-side carry and that further drove bullish trends. The carry trade can be one of the most symbiotic and beautiful situations in market analysis when they do show up and that’s what traders were able to enjoy for 21 months from the 2021 open into Q4 of 2022, and then again for the first ten-and-a-half months of last year.
The challenge is the fact that those trades can quickly become crowded as driven by that carry. And then the fire in the movie theater analogy comes to light, where there’s only one exit door and it’s only so wide: If you wait, it may be too late, and this is what helps to explain the aggressive sell-offs that have shown in each of the past two years in USD/JPY. Also of note is the fact that sitting in short positions involves absorbing negative carry, as the trader in that situation would be long the lower-yielder and short the higher-yielder. This provides motive for bears to not sit around for too long in those markets as they basically have to pay daily interest to do so.
This can lead to a dynamic where the bullish trend is slower and more formulaic as buyers push sequential higher-highs and lows while the bearish reversal is fast, aggressive, and quicker. This is also a smaller example of what took place last night after Kanda’s comment, with USD/JPY pushing below the support side of a rising wedge before catching a bounce after the U.S. open, eventually re-testing the 150 psychological level as resistance.
Does this mean that the top is in for this cycle? Not necessarily, as we’ve seen similar threats stall the trend before buyers ultimately challenged the Finance Ministry until, eventually, they acted.
Predicting price movements is always a challenge but it can be perhaps even more challenging when the drivers behind those turns can be a simple comment or suggestion from a government official. But, now that the rising wedge has broken, traders can look for holds of lower-high resistance to keep the door open for bearish setups.
The level of 150.78 appears to be a line-in-the-sand. This was a swing-high from October of last year that’s come back into play over the past few weeks to hold resistance through four separate inflections. Below that and down to 150 we’ve basically had a range, so that 78-pip space is quite noisy, but the 150 level remains of interest, as well, if sellers can hold resistance at or around the big figure.
USD/JPY Two-Hour Price Chart
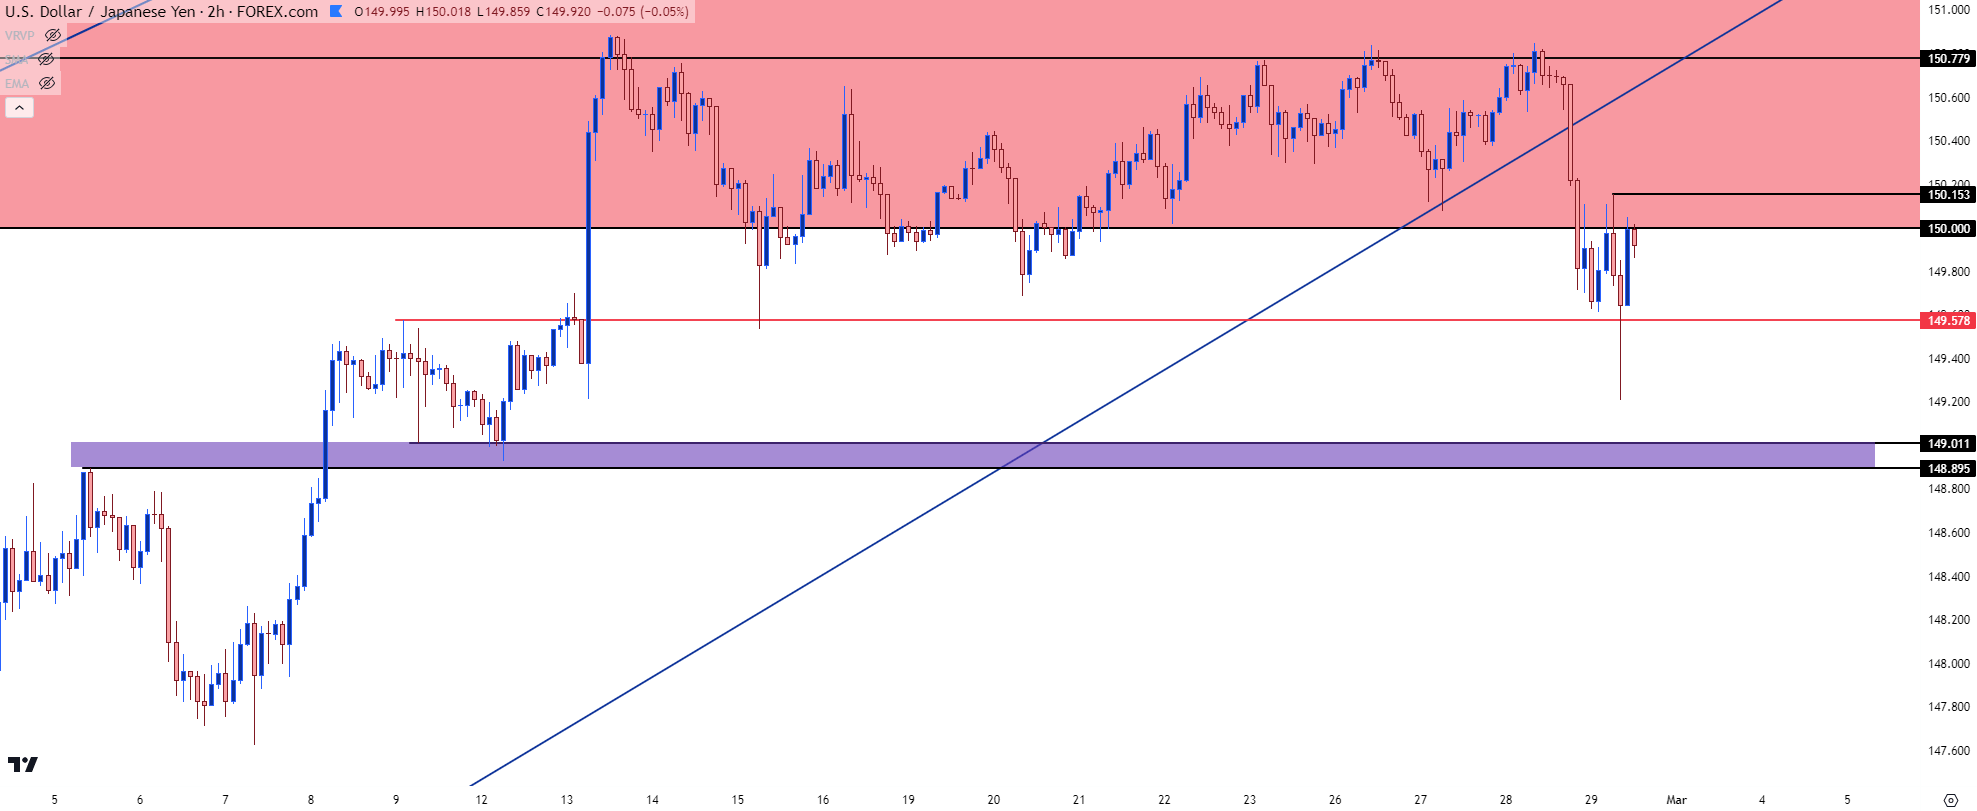 Chart prepared by James Stanley, USD/JPY on Tradingview
EUR/JPY
As I’ve been discussing on webinars, for traders that do want to look for Yen-weakness there may simply be more amenable pastures elsewhere given that long-term resistance in USD/JPY coupled with the recent history of the Japanese Finance Ministry defending the 152.00 level in the pair.
EUR/JPY has posed a sizable pullback after Kanda’s comment overnight and there’s now a support test showing at a prior point of resistance. While the European economy may not offer much to be excited about, the ECB hasn’t been talking up rate cuts to the same degree as the Fed, which could further tamp down on USD-strength. On the below daily chart of EUR/JPY, we can see prior price structure showing impact on near-term price dynamics. The lower-high from last year has come back into hold the 2024 high at 163.72; and the January swing-high came back into play overnight and has so far helped to hold the low at 161.87.
If bulls can hold support at that higher-low, the door for topside continuation can remain open; and if they can’t, and we see Yen-strength continuing to play-out, then likely the USD/JPY setup would have some additional bearish structure to work with after price pushed below the support side of the rising wedge.
EUR/JPY Daily Price Chart
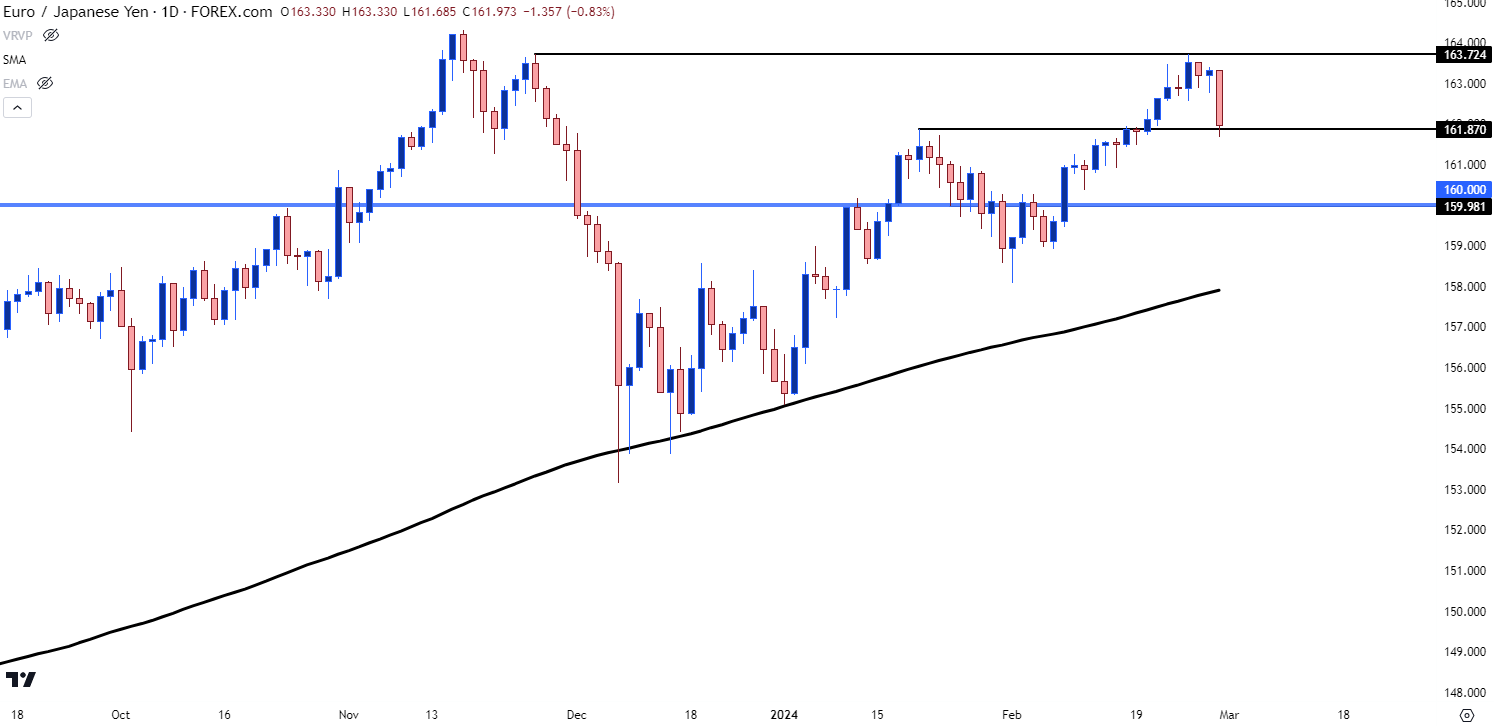 Chart prepared by James Stanley, EUR/JPY on Tradingview
GBP/JPY
While recessionary tendencies have begun to show in Germany and as the Fed talks up rate cuts for later in the year, the British Pound can stand out from a couple of different perspectives as inflation remains very high and the Bank of England may not have the same flexibility for weaker monetary policy.
This is reflected in price as GBP/JPY has set a fresh eight-year high on Monday. Meanwhile, USD/JPY remains at resistance that’s been in-play for the past two years and EUR/JPY held resistance at a lower-high from last year. This could similarly make GBP/JPY as an option for traders looking for ways to voice Yen-weakness and, from the monthly chart, there’s a long-term zone of resistance that sits above, starting at around the 193.61 level, which helped to set the high over a three-month period back in 2015.
GBP/JPY Monthly Chart
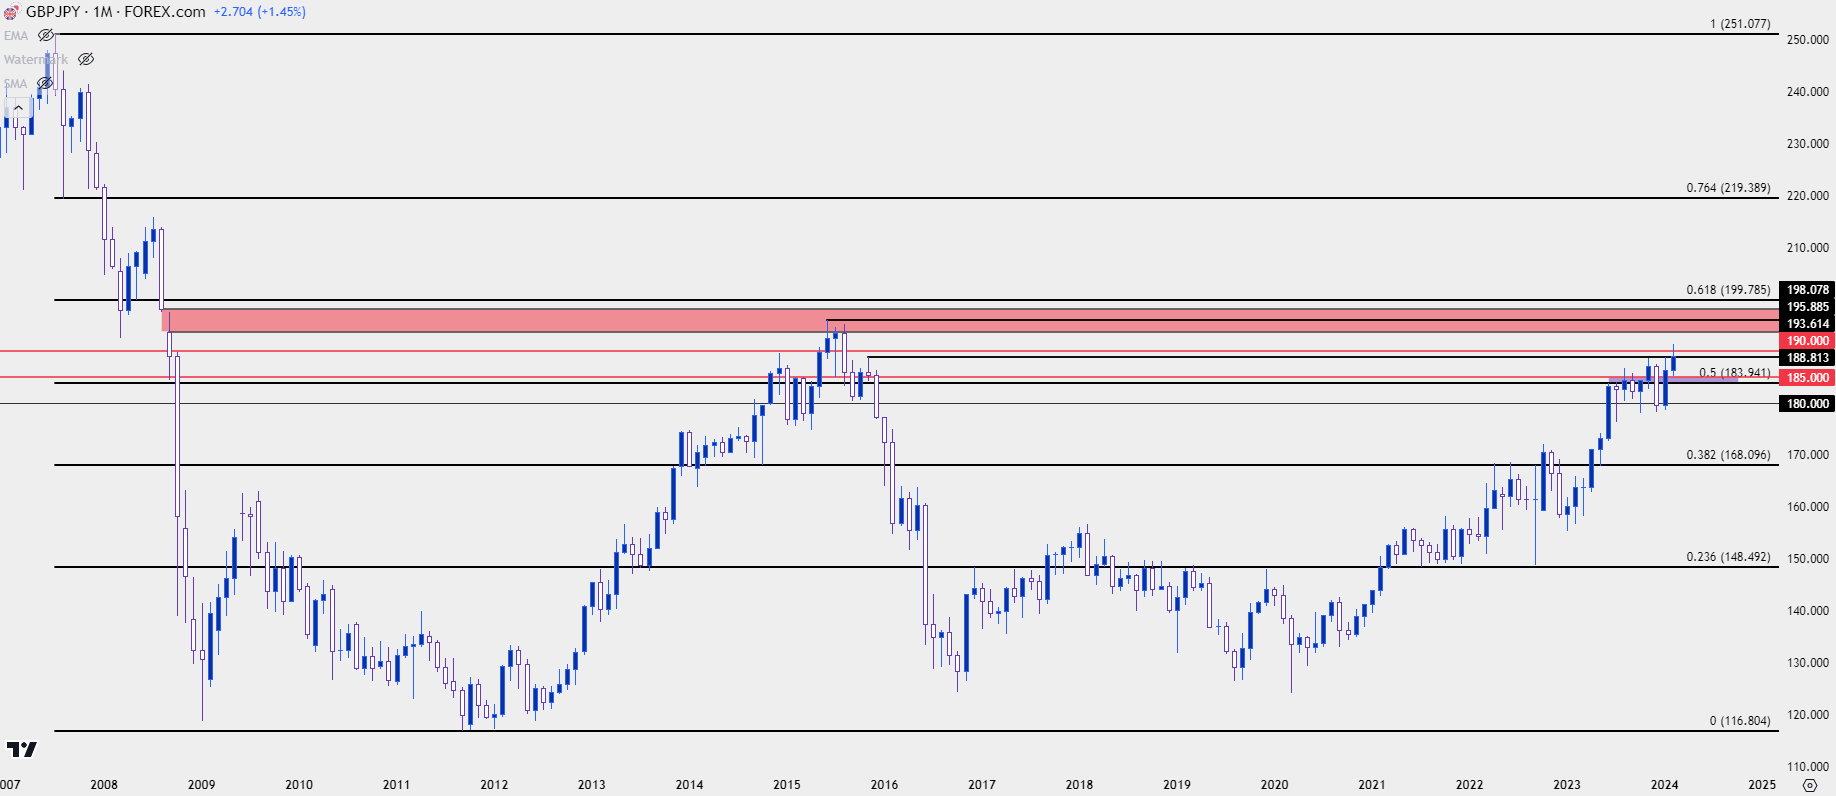 Chart prepared by James Stanley, GBP/JPY on Tradingview
From the weekly chart we can see lacking acceptance above the 190.00 psychological level, which was resistance two weeks ago and then broken-through last week. This week, so far, has pared back much of last week’s breakout and depending on how this week finishes, we may be looking at a bearish outside bar.
If this week does finish as a bearish outside bar that could produce challenge for trend followers and, instead, would tilt the focus for support back towards the 185.00 area.
GBP/JPY Weekly Price Chart
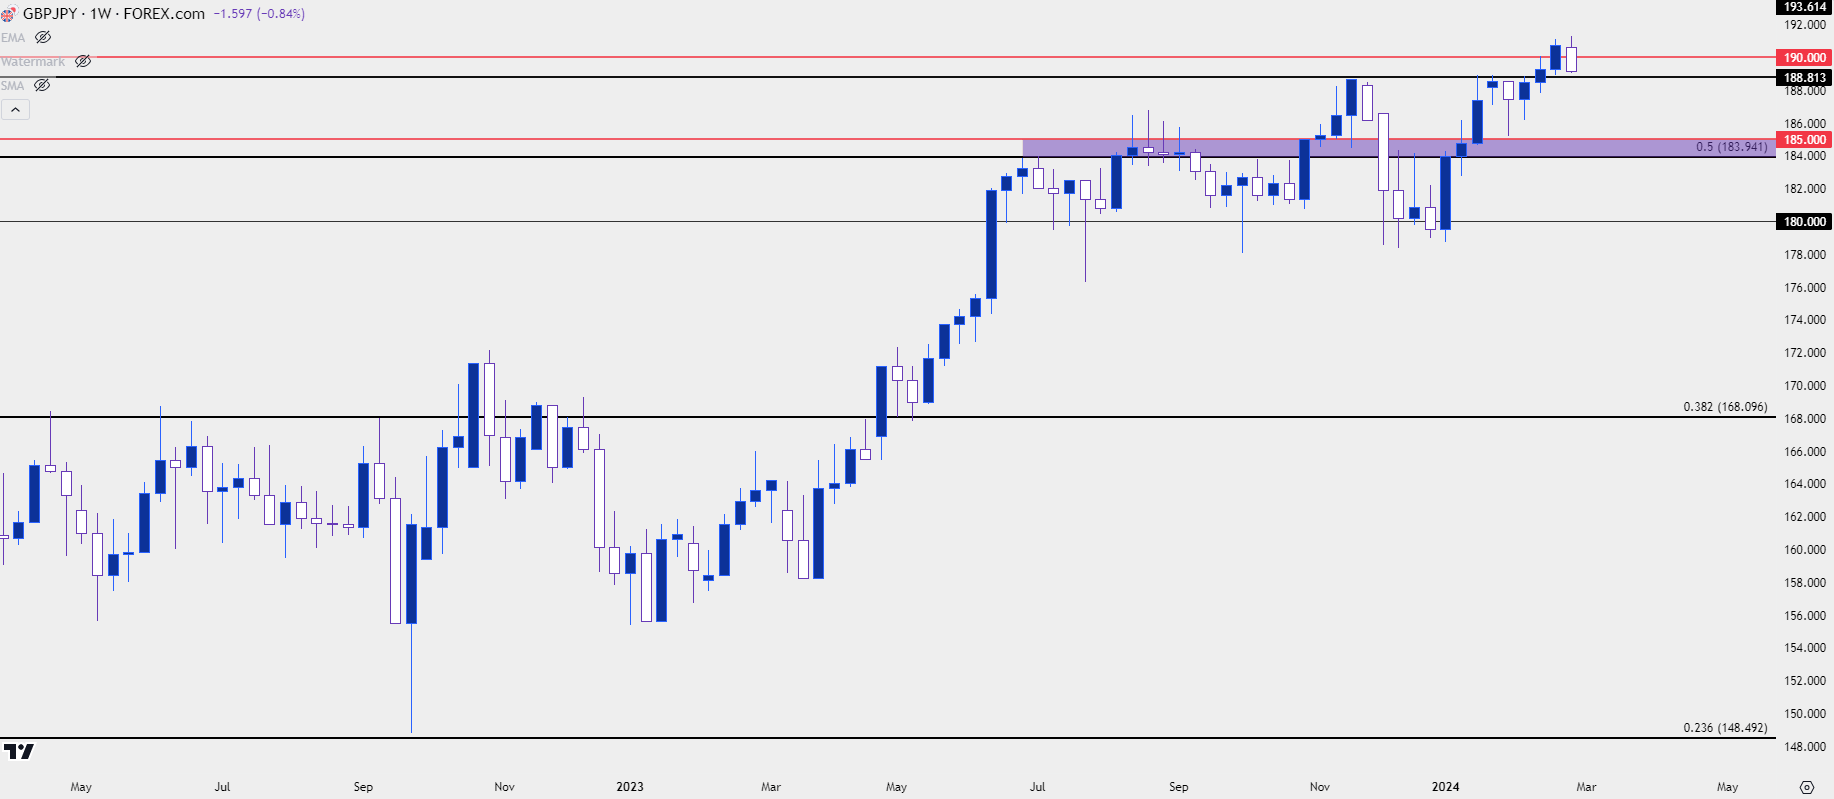 Chart prepared by James Stanley, GBP/JPY on Tradingview
As price has cut back-below 190.00, there hasn’t yet been a significant support response to show. There is a level of note nearing, around the 188.81 level, which had helped to provide resistance over a few different occasions. If bulls can hold that into the end of the week and, perhaps even evoke a bit of a bounce, then the bearish outside bar referred to above could be eliminated and that can allow for trend following approaches to continue to look for continued Yen-weakness.
GBP/JPY Daily Price Chart
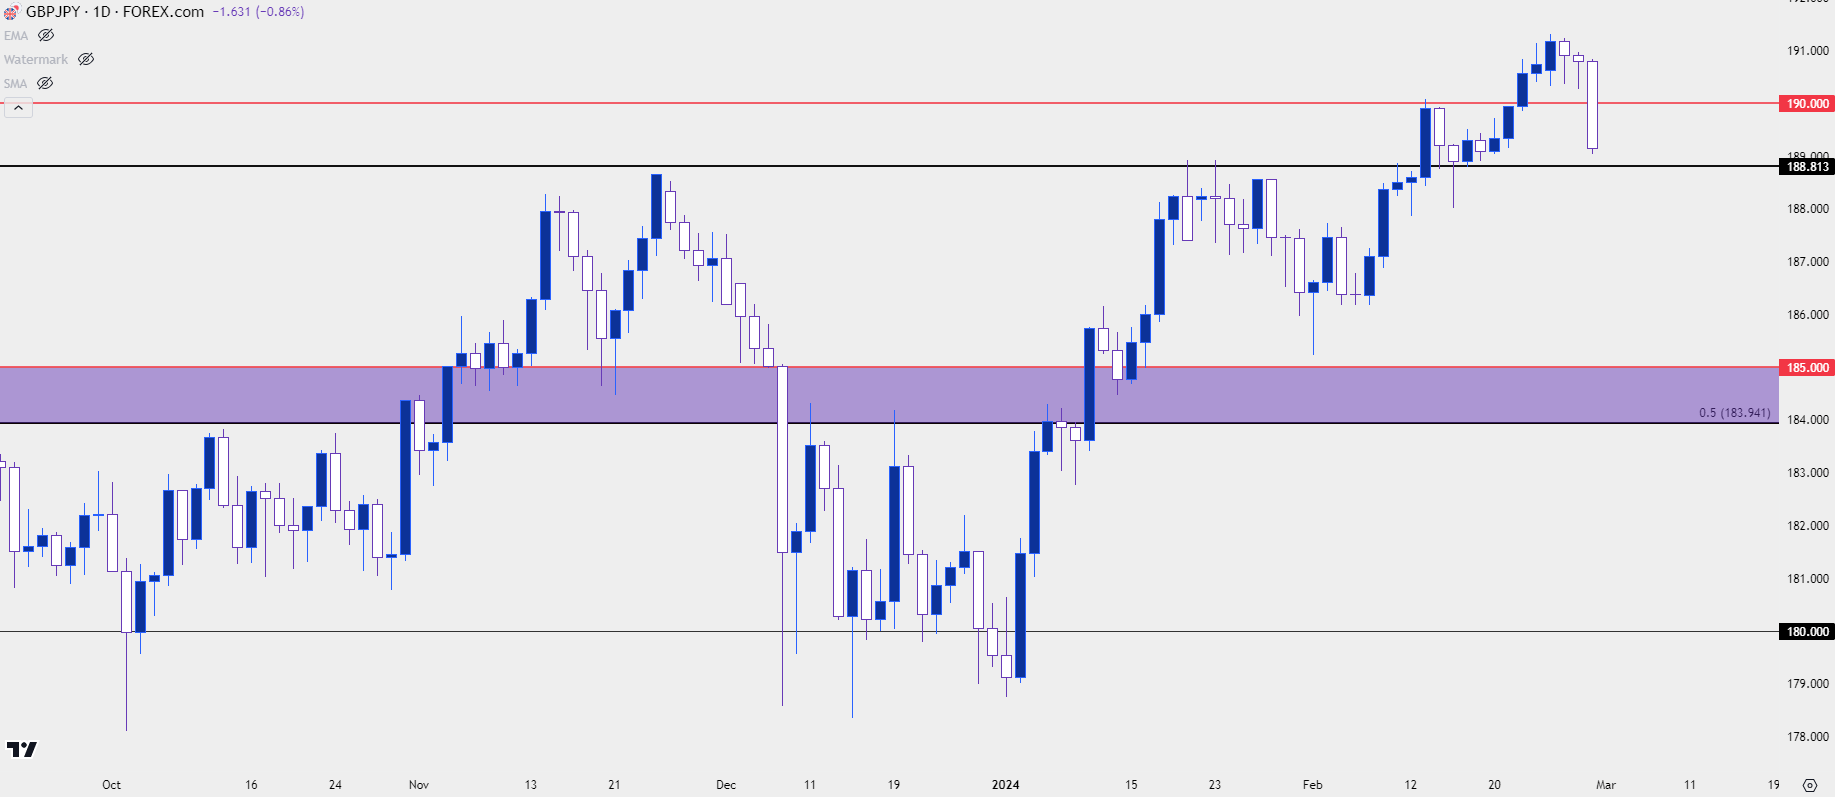 Chart prepared by James Stanley, GBP/JPY on Tradingview
--- written by James Stanley, Senior Strategist


