Japanese Yen, USD/JPY Talking Points:
- USD/JPY has pushed up to a fresh three-week high today to test above the 157.00 handle.
- GBP/JPY has made a fast run at the 200.00 level and EUR/JPY has re-tested 170.00, so there’s a couple of key psychological levels in-play on JPY pairs away from the USD.
- I’ll be discussing these themes in-depth in the weekly webinar. It’s free for all to register: Click here to register.
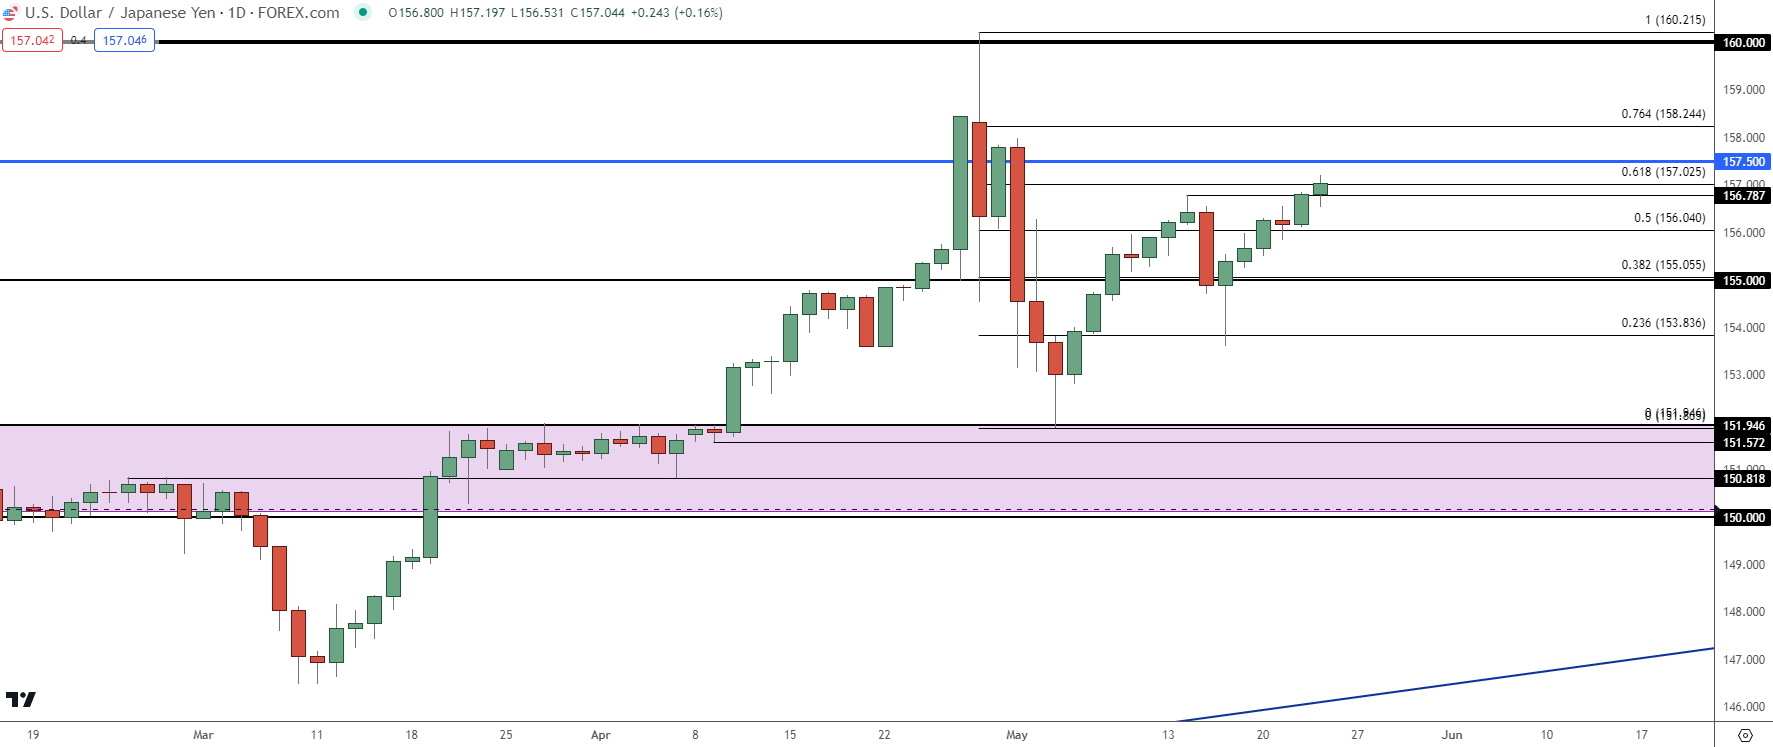
USD/JPY has continued to rally after the reversal that started last Thursday and this has pretty much went along with a general show of USD-strength, as DXY has similarly been rallying since setting a fresh low a week ago.
I had previously mentioned that I’m of the mind that USD/JPY could continue to trade like an amplified USD, and to that point, USD/JPY is up by 2.22% from last Thursday’s low, while DXY is up a more modest 0.82% (both number as of time of writing). But – this can work the other way, as well, especially considering how long the carry has continued to build in the pair. If there’s a growing fear of a larger move of USD-weakness, carry traders could be compelled to close positions in USD/JPY and that could lead to fast declines, particularly if we see tests below prices like 151.95 or the 150.00 handle. But that hasn’t been a concern of late as buyers have continued to load-in after the re-test of support at prior resistance on the morning of NFP a few weeks ago.
The 61.8% Fibonacci retracement of that intervention-driven pullback plots at 157.03, and that’s the price that’s currently helping to hold resistance in the pair.
USD/JPY Daily Price Chart
 Chart prepared by James Stanley, USD/JPY on Tradingview
USD/JPY: The Range
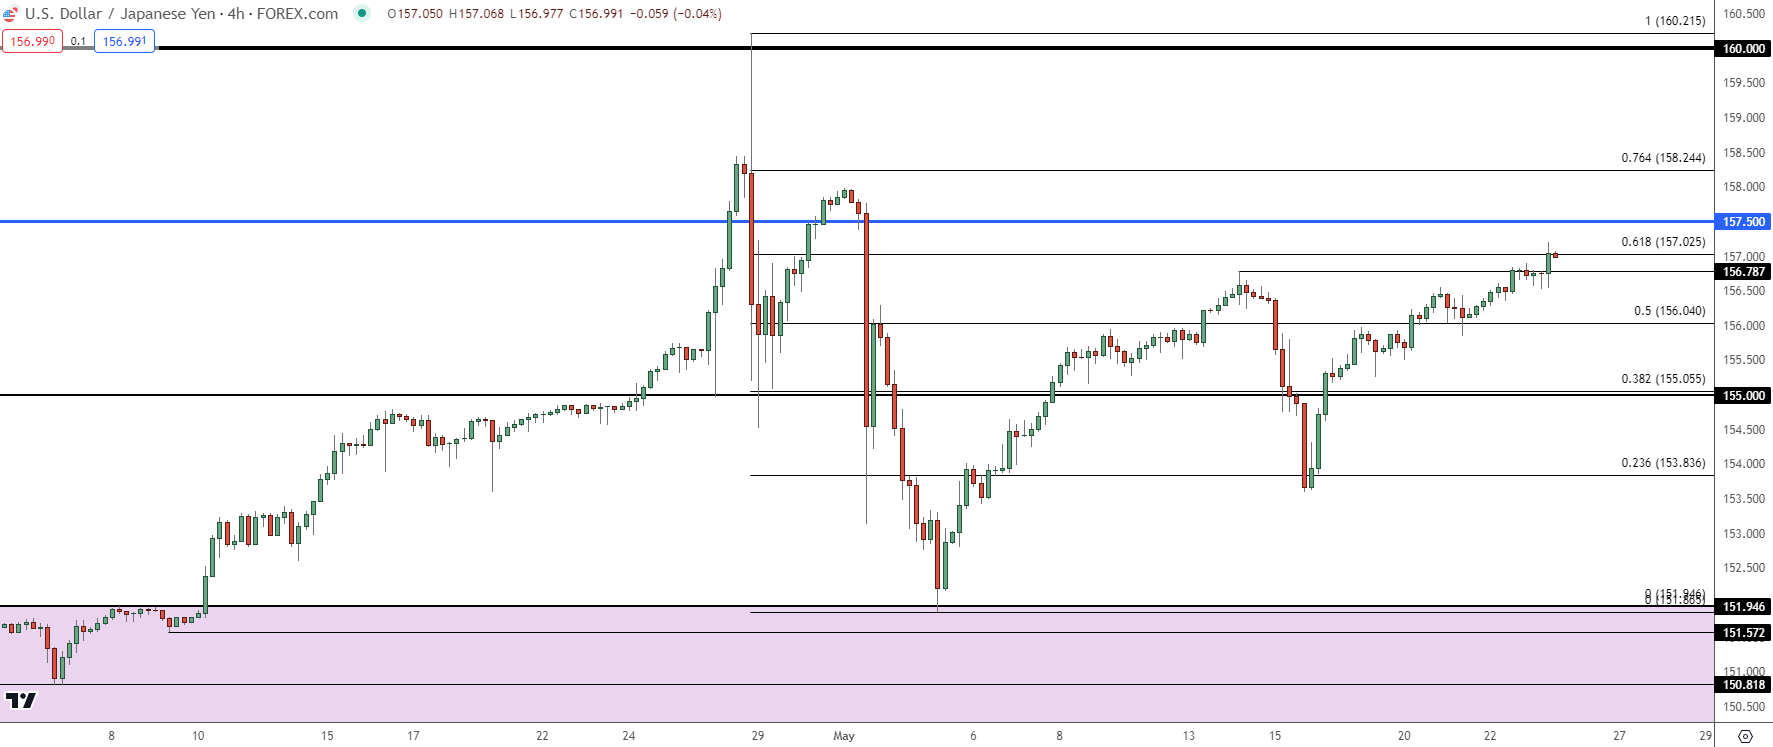
The large movements that developed earlier in the month continue to define an important range for USD/JPY. The pair tested above the 160.00 handle briefly, and that was followed by the intervention from the BoJ. But – after a hastened move back to 155.00, bulls returned and continued to push the pair higher, until another bearish wave showed after the FOMC rate decision on the first day of May.
There remains some contention around what was behind the move. There were accusations of intervention but that hasn’t yet been confirmed. The ‘why’ is more debatable than the ‘what,’ as price in the pair continued to fall into the Friday NFP report that week, with an eventual re-test of the 151.95 level.
That price had set resistance each of the past two years and that was the spot that led to breakout on April 10th, around the release of US CPI. As I had discussed leading into that, there were likely a number of stop orders sitting above price which could propel a bullish breakout if they were triggered. The impact of that was significant as it led to an 800+ pip move over the next few weeks, all the way until the BoJ finally stepped into stem the bleeding.
Those two levels of 151.95 and 160.00 define the current range in the pair and that remains of note.
USD/JPY Four-Hour Price Chart
 Chart prepared by James Stanley, USD/JPY on Tradingview
EUR/JPY
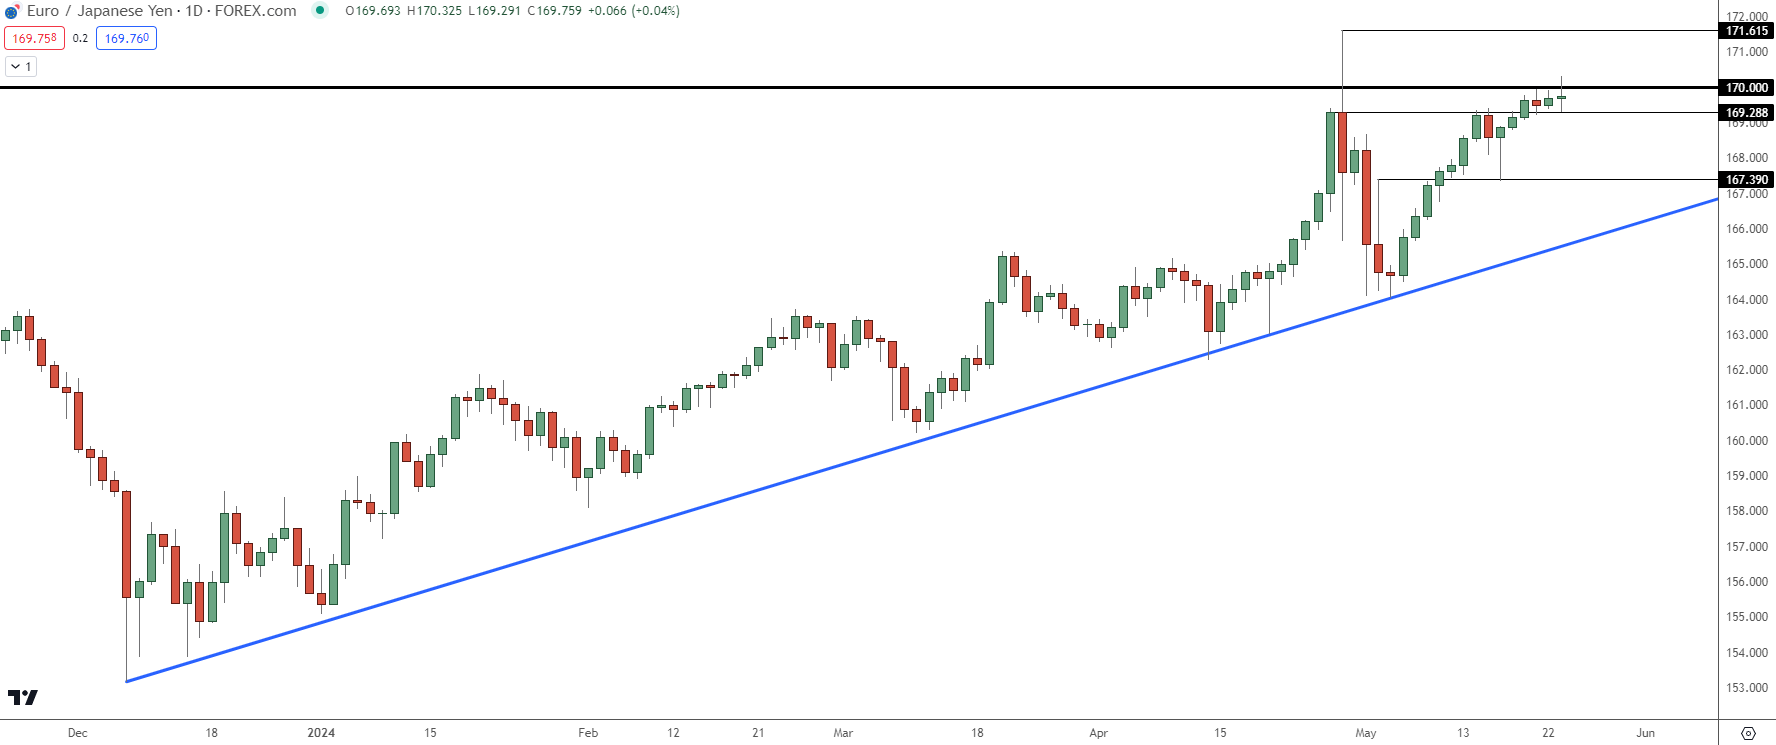
While USD/JPY is often the focal point for the Finance Ministry and the Bank of Japan, there was a similar scenario of a psychological level coming into play before the intervention in EUR/JPY. The pair had rallied up to re-test the 170.00 handle before the intervention arrived and the pair was similarly slammed back with aggression. But – from the lows around the NFP report on May 3rd, bulls started to come back and have largely remained in-control of price ever since.
This has led to another re-test of the 170.00 handle this morning after price postured below the big figure for the past couple of days.
The main difference here from the above in USD/JPY is the prospect of near-term rate cuts out of Europe. If the ECB does cut rates in June, particularly if that happens alongside the BoJ talking up more rate hikes, that could compel a greater tendency for reversal in EUR/JPY. It’s a difficult argument to push at this point since there’s been continued higher-highs and higher-lows, but for those that are looking for a return of Yen-weakness at some point, that fundamental deviation could be of interest.
For support, the 169.29 level is notable on a near-term basis as that was resistance-turned-support. And below that is another similar spot of resistance-turned-support at 167.39. That was also the spot of a very visible support push from bulls, so this would seem a spot that buyers would want to continue to defend.
EUR/JPY Daily Price Chart
 Chart prepared by James Stanley, EUR/JPY on Tradingview
GBP/JPY
While the ECB may be close to cutting rates, recent data out of the UK seems as though the BoE may be a little further away, and in-turn that can impact dynamics in the GBP/JPY pair.
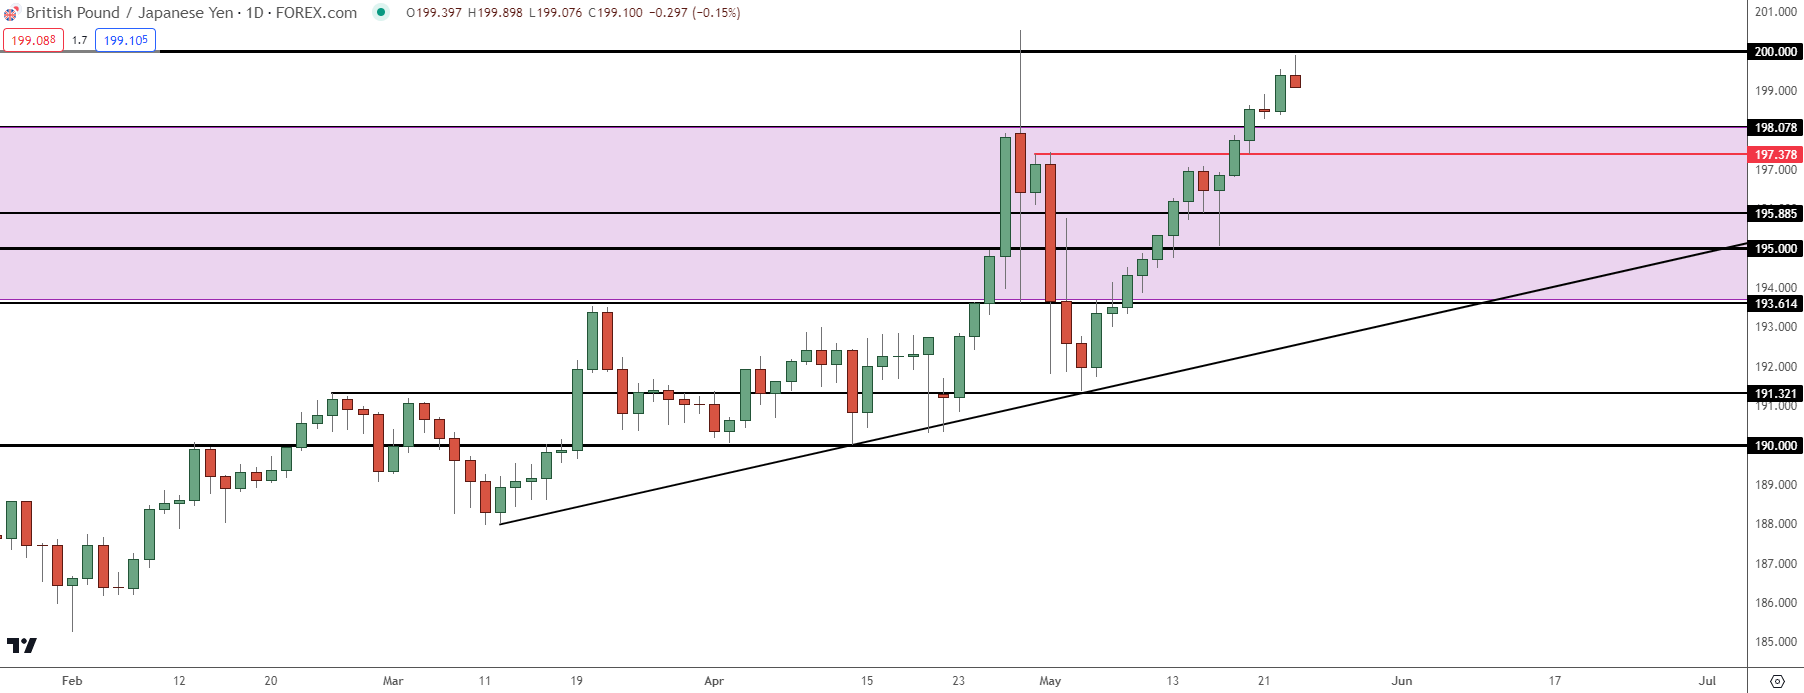
GBP/JPY has yet to re-test the 200.00 level, which was only in-play briefly before the intervention swing. And like both EUR/JPY and USD/JPY above, the pair set a low on the morning of the NFP report later that week.
But what stands out here is what happened after, as buyers loaded in and continued to drive in what’s been an impressive bullish trend. There’s also been a build of bullish structure along the way, with support levels at 198.08, 197.38 and 195.89 that remain of interest.
GBP/JPY Daily Price Chart
 Chart prepared by James Stanley, GBP/JPY on Tradingview
--- written by James Stanley, Senior Strategist


