
Japanese Yen Talking Points:
- Japanese monetary policy remains at odds with much of the developed world as the BoJ has kept monetary rates pegged to the floor despite increasing inflation.
- This deviation in monetary policy has created divergence in currency pairs, with JPY-weakness showing prominently over the past two years against many major currencies. The deviation in interest rates has allowed the carry trade to drive significant trends in a number of JPY-markets.
- The threat of intervention has recently re-entered the picture as USD/JPY has tested back-above the psychologically important 150.00 level.
- I’ll be discussing these themes in-depth in the weekly webinar on Tuesday at 1PM ET. It’s free for all to register: Click here to register.
USD/JPY remains at a difficult spot as the fundamental backdrop has remained decisively tilted in one direction, but the threat of intervention acts as a hindrance to trend continuation. At this stage, the deviation in many JPY-pairs remains wide with the Bank of Japan keeping rates pegged to the floor despite rising inflation. Most other major economies have already reacted to the inflationary pressure with rate hikes and in the US, there remains the possibility of even more hikes as data has remained strong.
This has helped to keep the carry trade alive as many JPY-pairs continue to show positive carry rates and until the Bank of Japan addresses rate policy, this theme can remain. Unless, of course, the possibility of principal losses re-enters the equation, similar to what showed in Q4 of last year in USD/JPY. If traders feel the possibility of principal loss outweighs the benefits of sticking to the long side and collecting the carry, that could lead to a fast unwind scenario and this is what seemed to help USD/JPY bears so much last year. And the other side to consider is the negative carry on the short-side of the trade. By being long of the lower-yielding currency and short of the higher-yielding, holding short positions could entail an additional cost in the form of rollover. And this is one of the prime reasons that such situations will often show ‘up the stairs, down the elevator’ type of price action.
We saw a glimpse of this last week when USD/JPY tipped above the 150-handle. That was the site of intervention last year and it’s what helped to form a 2022 top as the pair fell by more than 2,400 pips in the three months after. For this iteration, USD/JPY traded above that level for about 10 minutes before being slammed-lower by more than two big figures, with support showing at a prior swing of 147.32.
The wide-ranging accusation was that this was another round of intervention. But a week later, that’s not so clear, as Reuters has reported that BoJ money market data indicates that it may not have been intervention-driven. Japanese policymakers have remained tight-lipped on the matter, as is the norm, and this could effectively keep the market guessing with the continued fear that another test over the 150 level could be met by a forceful reversal move.
At this point, short-term price action in USD/JPY remains in a consolidative state, near the mid-point of that move from last Wednesday. Bulls haven’t yet dared for a re-test above the 150 handle. But there’s also been continued support in the direction of the carry, as buyers have continued to defend the 148.42 swing.
USD/JPY Four-Hour Price Chart
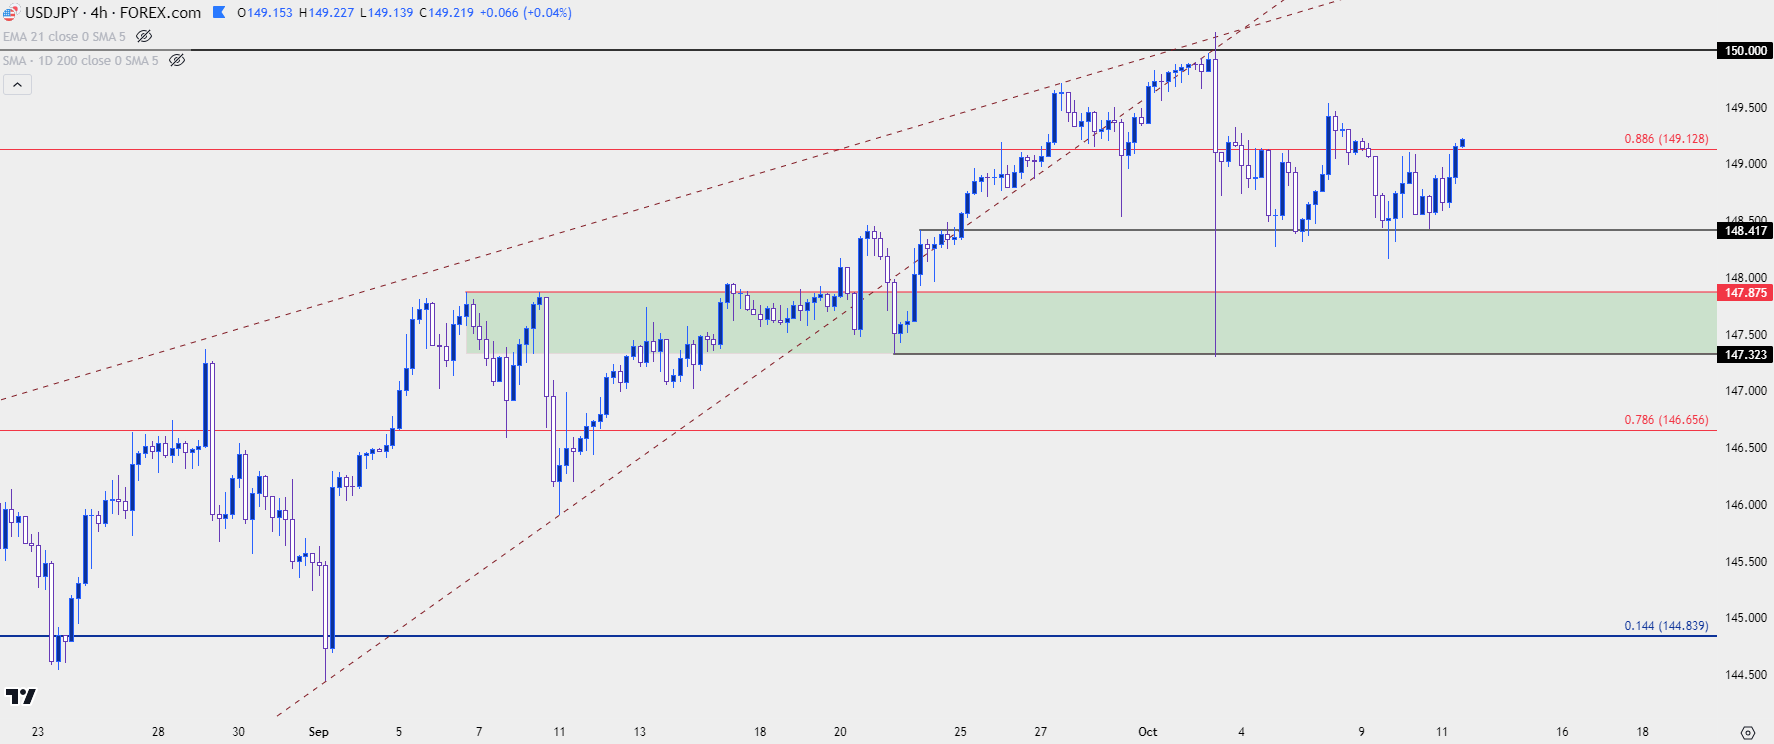
Chart prepared by James Stanley, USD/JPY on Tradingview
USD/JPY Strategy
Taking a step back, one must ask what theme they’re plotting for on USD/JPY. The carry remains positive and there’s no signs yet that the BoJ is willing to shift policy, as that could trigger a number of repercussions that they may not want to deal with. As of this writing we’re less than 100 pips away from 150.00, so if the BoJ doesn’t intervene on the next test above that level, for how long might it reasonably run before they do? And if looking for a continued breakout it really seems as though one would be wagering on Japan, in essence, losing control of the matter, of their own currency, which would certainly seem to be an outcome that they’d like to avoid, if at all possible.
The more enticing scenario might be in the event of a deeper USD pullback, and this would really harken back to that theme from last year. In that instance, the Bank of Japan intervened after the 150 level was traded through and the morning of the intervention prices had come very close to the 152 level. The intervention itself helped to push the pair back to support, which remained in-play for much of the next month.
What finally undid that trend was a falling US Dollar, on the back of slower inflation figures bringing in the prospect of fewer rate hikes from the Fed. As that theme developed last year, with a massive showing on the morning of a CPI release on November 10th, the USD/JPY bearish theme took on new life, and that patterning of lower-lows and highs remained for the next two months.
USD/JPY Daily Price Chart
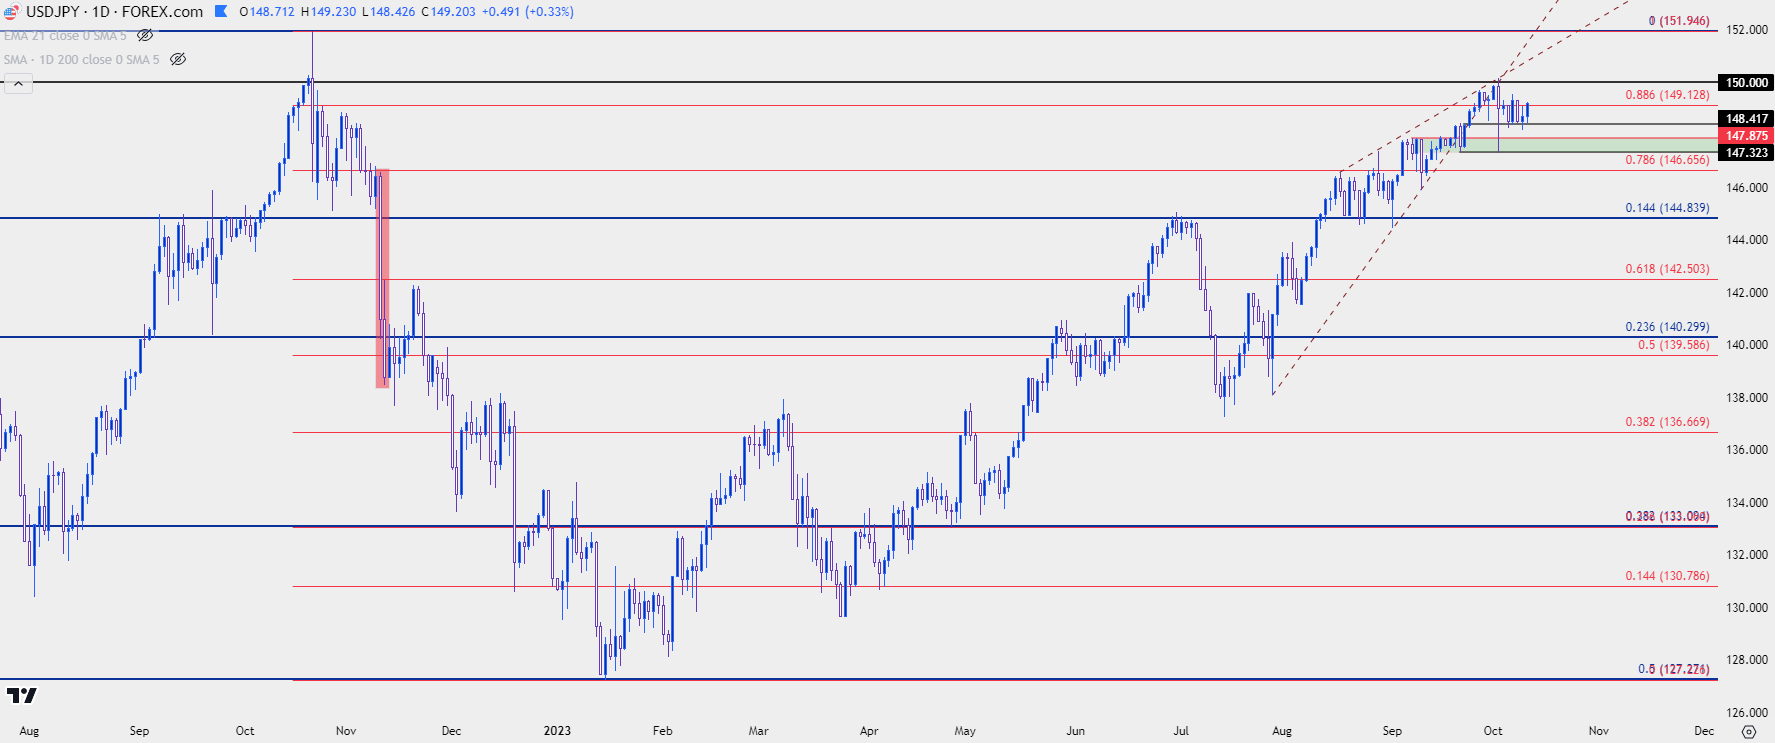 Chart prepared by James Stanley, USD/JPY on Tradingview
From the weekly chart below it’s clear that we’re still not seeing much evidence of reversal. All that has shown via price action is stall near the big figure that helped to build a top last year. And last week’s candle finished as a doji, which further illustrates that stall-theme after the 150 test.
But, from that weekly chart we can garner a bit more information, which the highlight of support at prior resistance in an approximate 56-pip range between 147.32 and 147.88. Given that this was the low point after the 150 pullback move, this is a big spot for bulls to defend to keep the door open for topside. If, or when, that fails to be the case, the door for possible reversal can open a bit more wide.
USD/JPY Weekly Price Chart
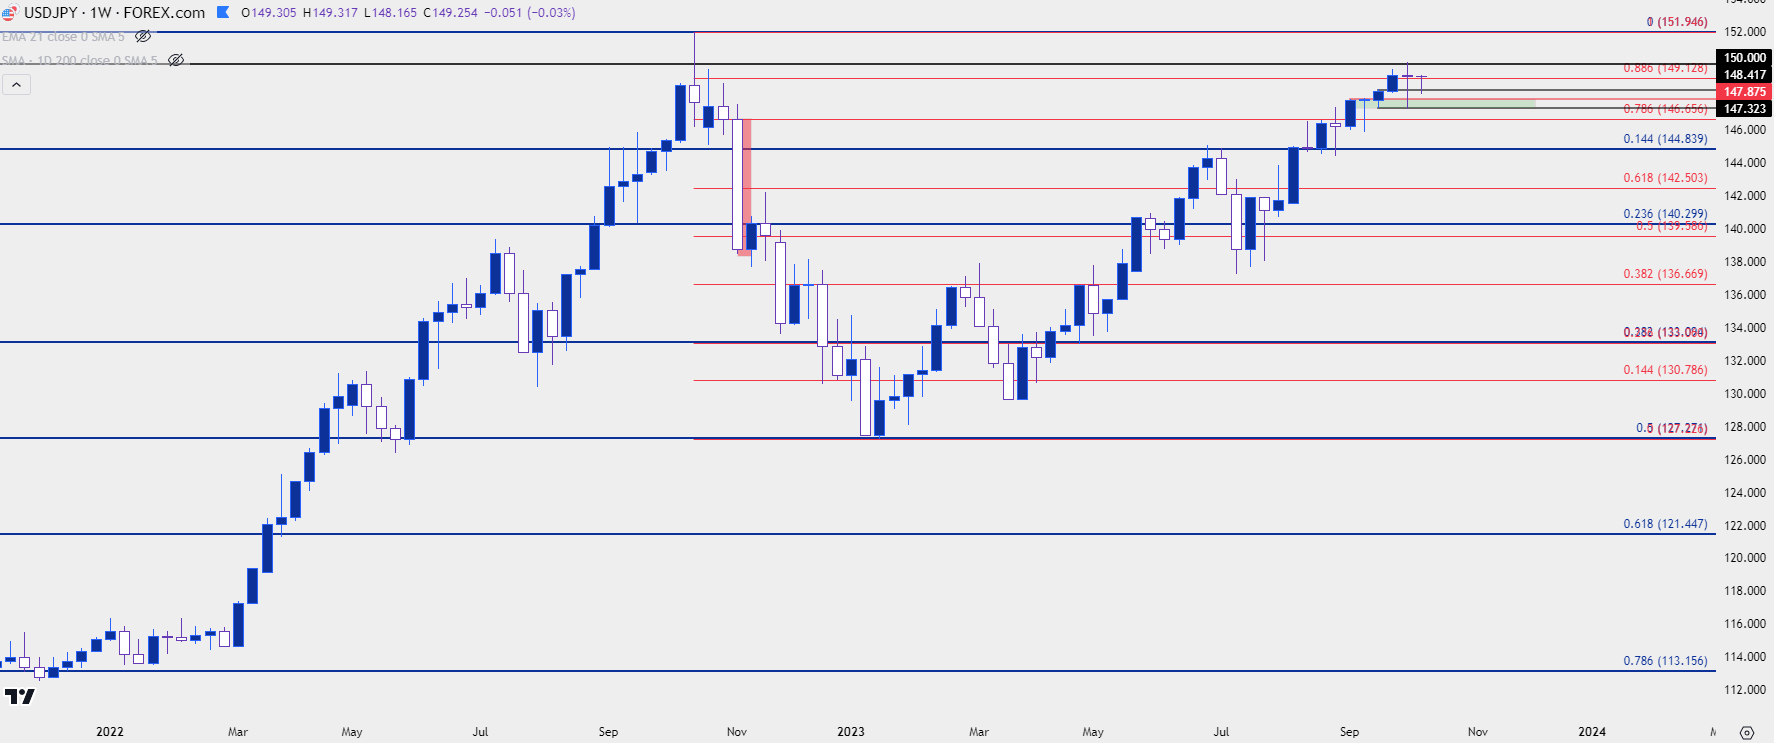 Chart prepared by James Stanley, USD/JPY on Tradingview
EUR/JPY
While questions remain around how many rate hikes the Fed may have left in store, that question doesn’t’ seem so prominent in Europe. And if we have, in fact, seen the final ECB rate hike for this cycle, the question of fundamental drive can start to come into the picture for EUR/JPY forecasts.
The carry does still remain positive here, as driven by the rate differential; but again, the question is what’s next and if traders fear that the prospect of continued gains doesn’t outweigh the possibility of a pullback, well then we can start to see reversal themes beginning to price-in. And crowded trades can unwind even quicker than they wound-up, as the exit door is only so wide and if carry trades are watching principal evaporate, that could provide even more motivation for the reversal.
In EUR/JPY, the pair has essentially stalled for the past three-and-a-half months, holding inside of the 160.00 handle on the pair.
EUR/JPY Monthly Price Chart
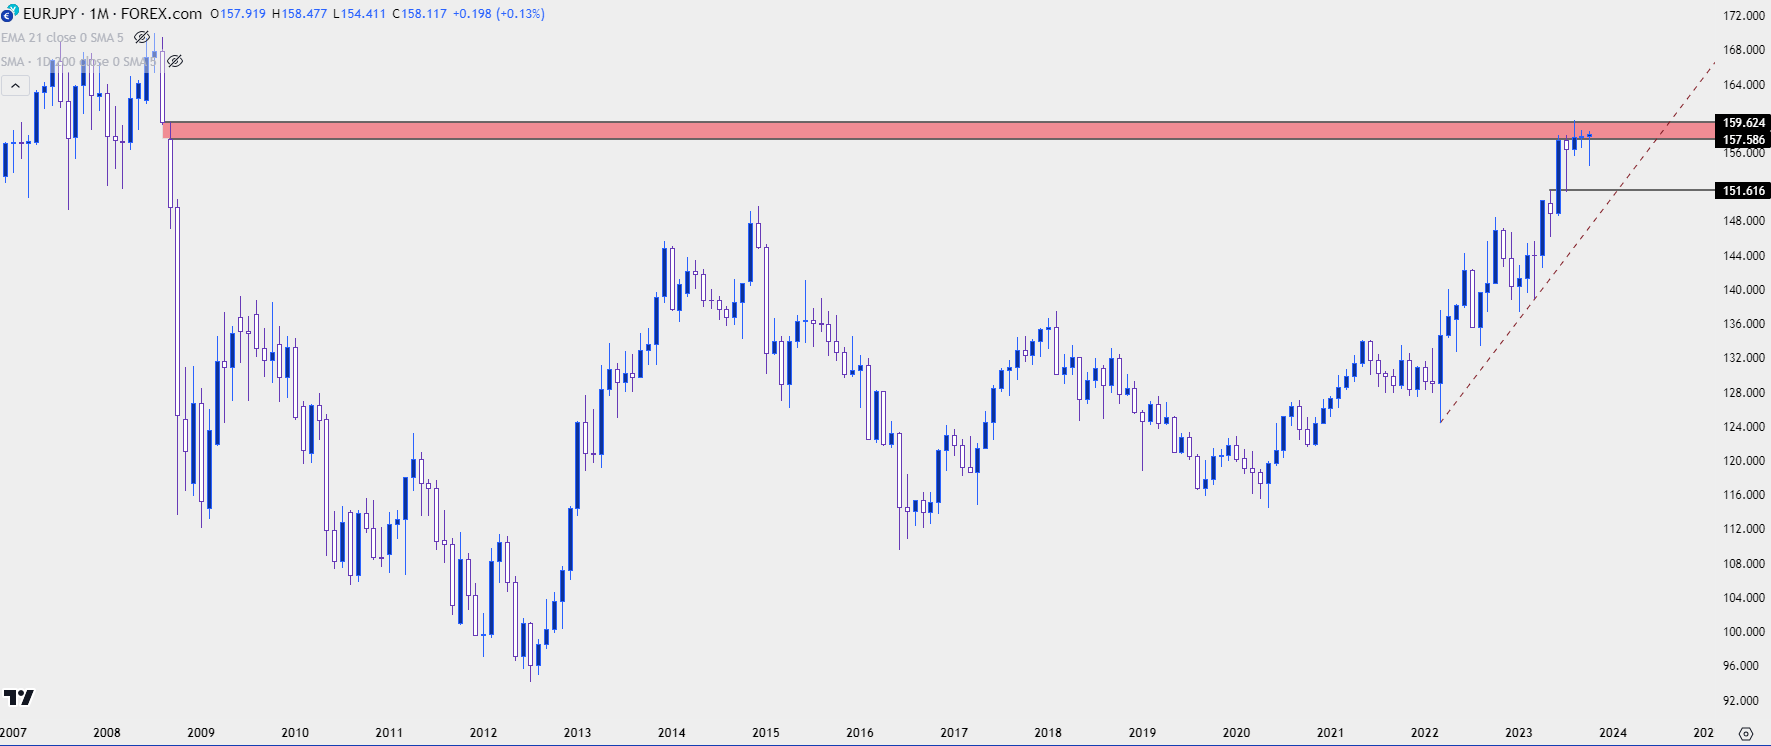 Chart prepared by James Stanley, EUR/JPY on Tradingview
That grind is even more evident on the weekly chart, where there’s been indecision candlesticks printing for the past eight weeks, in the form of either spinning tops or dojis. Bears took a shot last week with a test below the 155.00 level, but prices snapped back into resistance.
This keeps the door open for possible capitulation if bulls can finally force a test above the 160.00 big figure. Or, alternatively, if we can start to see greater development of bearish trending action, that could similarly begin to open the door for reversal potential.
EUR/JPY Weekly Price Chart
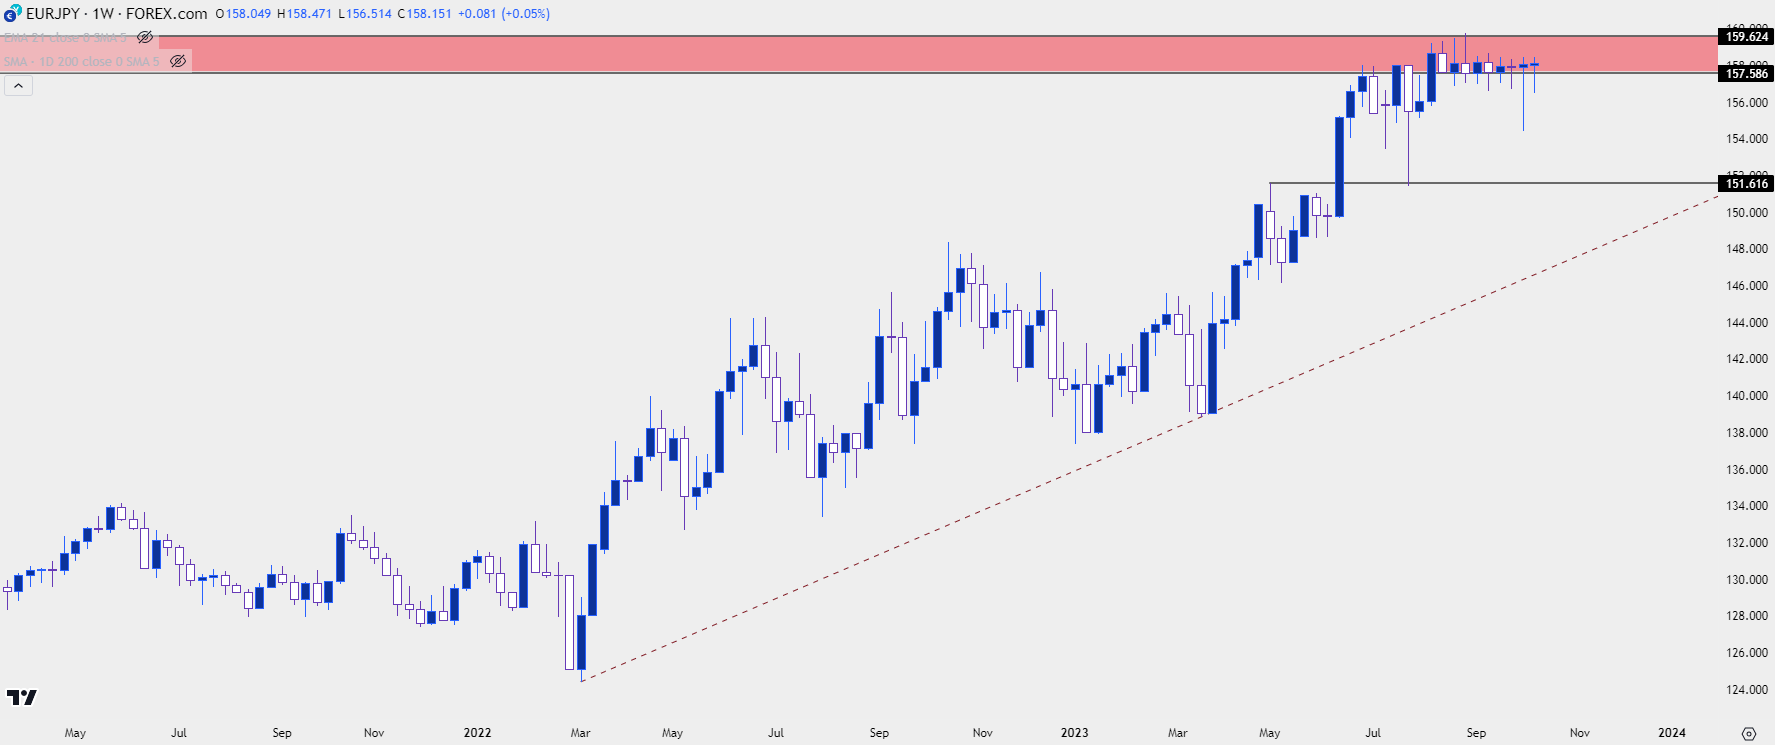 Chart prepared by James Stanley, EUR/JPY on Tradingview
GBP/JPY
On that above monthly chart of EUR/JPY, the resistance zone in red was generated by a gap on the monthly chart, taken from August-September of 2008. And while that gap has long filled, that area has also come back to hold resistance over the past four months.
Interestingly, that same gap in GBP/JPY is what came into play to hold the highs back in 2015. This was pre-Brexit and the pair was running with Abe-nomics, until that zone formed three months of stall that eventually led to a reversal.
In GBP/JPY, price hasn’t yet been able to test that same zone as the pair has remained around a key Fibonacci level at 183.94. Sellers tried to force a breakdown earlier in the month but were quickly offset as prices are making another approach at a re-test of 183.94.
GBP/JPY Monthly Price Chart
 Chart prepared by James Stanley, GBP/JPY on Tradingview
The weekly chart in GBP/JPY looks a bit more contentious after last week’s bar, which printed as a hammer formation. This came after a test below 180.00 after which bulls responded in a big way. But – this does set the stage for another re-test of resistance in the pair with the 183.94 Fibonacci level nearing, and above that is another spot of interest at the 185.00 level. The question after is for how long that test might run – and whether sellers start showing a response in anticipation of what’s on the fundamental horizon.
GBP/JPY Weekly Price Chart
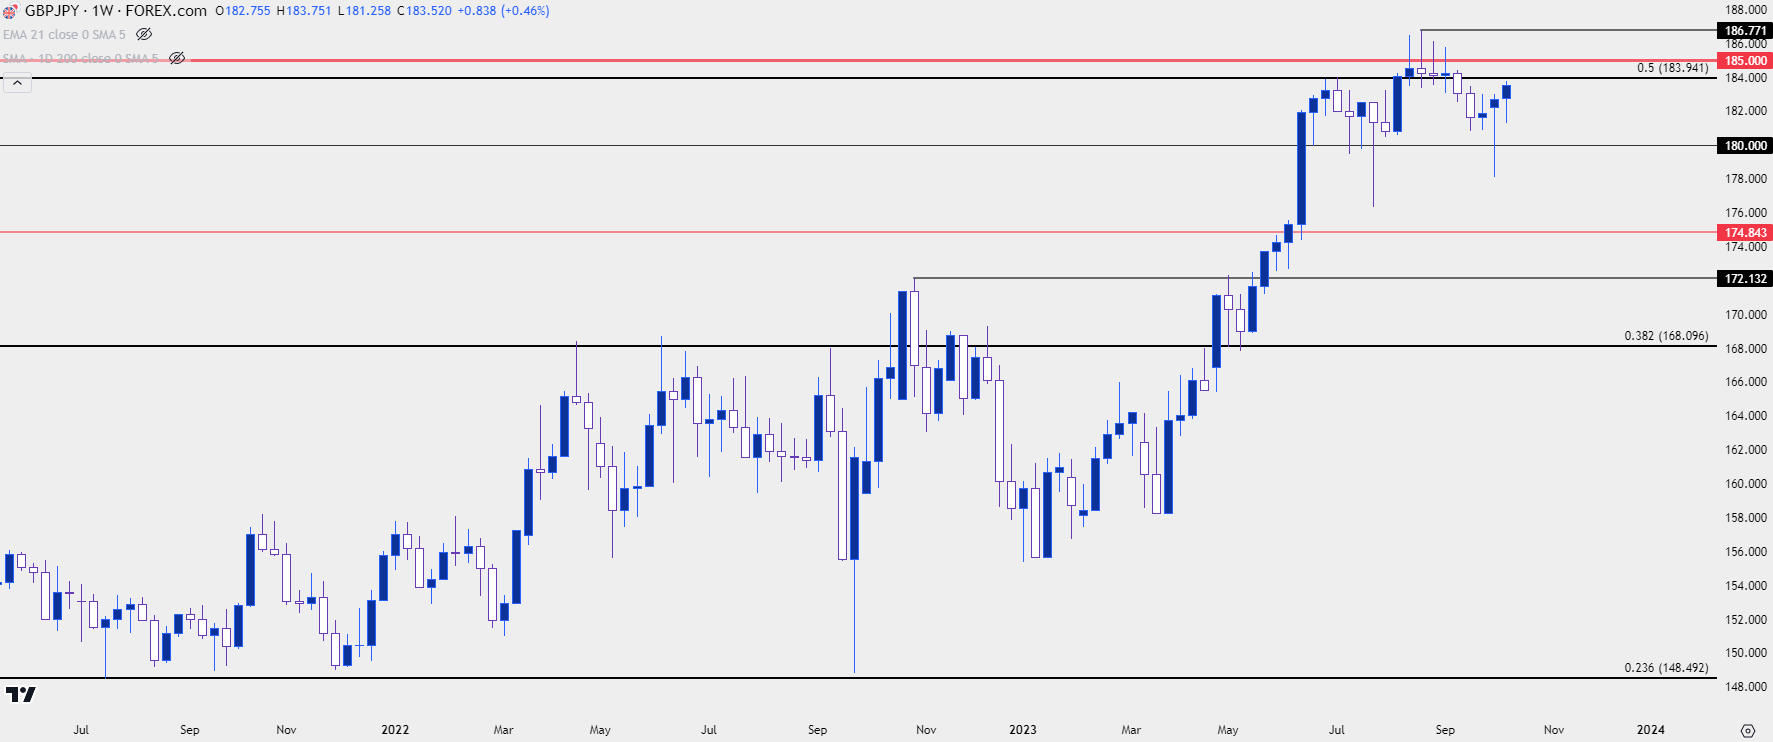 Chart prepared by James Stanley, GBP/JPY on Tradingview
--- written by James Stanley, Senior Strategist


