Japanese Yen Talking Points:
- There’s building speculation that the Bank of Japan may soon look to exit their negative rate policy in the coming months.
- While the BoJ has remained at ultra-loose policy levels since the pandemic, their economy has barely avoided recession after the revised GDP figure was released on Monday, but three consecutive quarters of lower private consumption highlights additional risk in making policy more restrictive.
- Some are expecting that move from negative rates to take place next week while some others are looking towards April. I remain dubious on the matter although projecting too much here could be a fool’s errand as what the BoJ has done is highly-experimental and unlike anything the world has ever seen with their Yield Curve Control policy. On top of that, central bank rates have been negative for eight years in Japan, since February of 2016. So, there’s not a template to operate off of here. As always, I’m tracking price action first and foremost and that’s what I investigate below.
Is the Bank of Japan on the verge of shocking the world? Some analysts are starting to think so, and others think that shock may show in April with the Bank of Japan finally leaving their negative rates regime.
I want to get this out up front in the effort of transparency: I have no idea if they will do that, and neither does anyone else. I’m personally dubious because the timing seems ill-suited to such a risk, and the BoJ is known as being a somewhat conservative central bank, even with how much of an outlier they’ve been with policy over the past 12 years. The Bank of Japan has been sitting on negative rates for eight years now, and their yield curve control policy has essentially cornered the Japanese government bond market. What the BoJ has done here is so out of the norm that there’s not really a valid playbook to work from. But, as far as my dubious assertion the larger question would be timing: The Japanese economy has barely avoided recession after the revised GDP print was released on Monday, and while core inflation remains above 2% as it has for the past year, it’s also been softening rather dramatically of late.
As a matter of fact, the Fed may welcome such a scenario in U.S. Core CPI which has only pushed down by 0.3% over the past six months. In Japan, the fall in core inflation has been faster of late, with core CPI falling by 0.8% since the release last October. This further brings to question why ‘now’ would be the best time to hike interest rates and delve into the unknown of what happens when carry trades bail in unison.
Japan Core CPI Since Jan, 2021

Chart prepared by James Stanley
BoJ Risks
In my view one of the reasons that they’ve avoided the risk of leaving negative rates was the possible consequence. After decades of deflation and disinflation, the ‘three pillars’ approach from Shinzo Abe finally brought some hope into the equation. At the core of that push was currency weakness via the Yen and this is one reason you can see so many up-trends starting in USD/JPY, EUR/JPY and GBP/JPY 12 years ago.
It's been the more recent dynamics that have brought more hope to Japan, with the Nikkei finally setting a fresh all-time-high and trading above the level that had last printed in 1990, before the start of the ‘lost decades’ for the Japanese economy.
With Yen-weakness remaining so prominent, particularly as other trade partners lifted rates, carry trades have bloomed across the FX-landscape. USD/JPY hit a fresh 32-year high in 2022, and GBP/JPY has just set a fresh eight-year high. EUR/JPY trades at a 16-year high, and at the core of those moves is the carry trade, where investors can sell Yen (at negative rates) and buy another currency with a positive rate that had been moving higher; and the very act of others pushing that same theme helped to form aggressive bullish trends in each of those pairs.
And the inflation that’s been seen in Japan of late emanates from that currency weakness.
But like we saw in Q4 of 2022 and then again in Q4 of last year, those carry trades don’t necessarily have a wide risk profile, and the simple thought of change could cause a quick and abrupt reversal to trend. And from that additional consequence could be seen as a stronger Yen could further dampen inflation, putting the BoJ, and the Japanese economy, right back into the same conditions they were in before Shinzo Abe had come into the picture.
This is at least part of the reason the BoJ hasn’t touched rates since before Covid, and it’s also probably a reason why they may want to wait before doing so as a change from policy will motivate Yen-shorts to close positions and the Yen-strength that emanates from that could create some forceful moves across markets. This could lead to a deeper and faster fall with inflation and given that private consumption is already in a draw-down, well there could be repercussion there, too, further reinforcing recessionary dynamics.
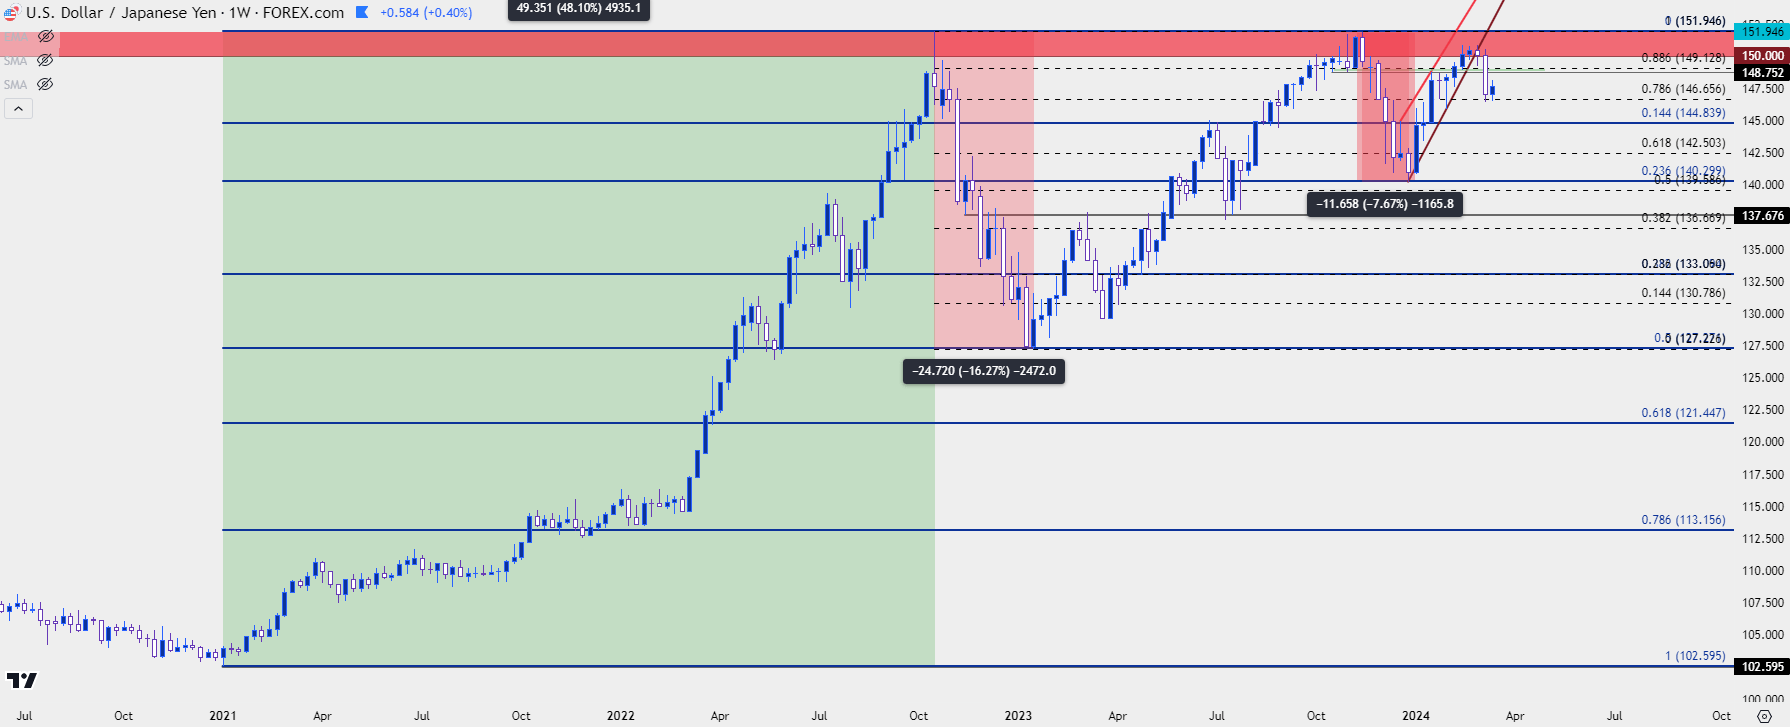
On the below chart, I’m looking at the weekly chart of USD/JPY, and we can see how impactful those reversals have been over the past two years. And keep in mind – this was as the carry was aggressively tilted to the long side of the pair, so traders holding shorts would have to pay negative carry. The reversal in Q4 of 2022 amounted to 2,472 pips and the Q4, 2023 episode amounted to 1,165 pips.
But, again, in both cases the carry remained positive and there remained a driver to bring bulls back to the table.
USD/JPY Weekly Price Chart
 Chart prepared by James Stanley, USD/JPY on Tradingview
USD/JPY
I had looked into the matter around the Yen a few weeks ago as I had a building bearish case for USD/JPY. The backdrop there was more concerned with USD, however, as a fall in the USD could similarly motivate carry traders to bail out of long positions, thus leading to sharp bearish moves.
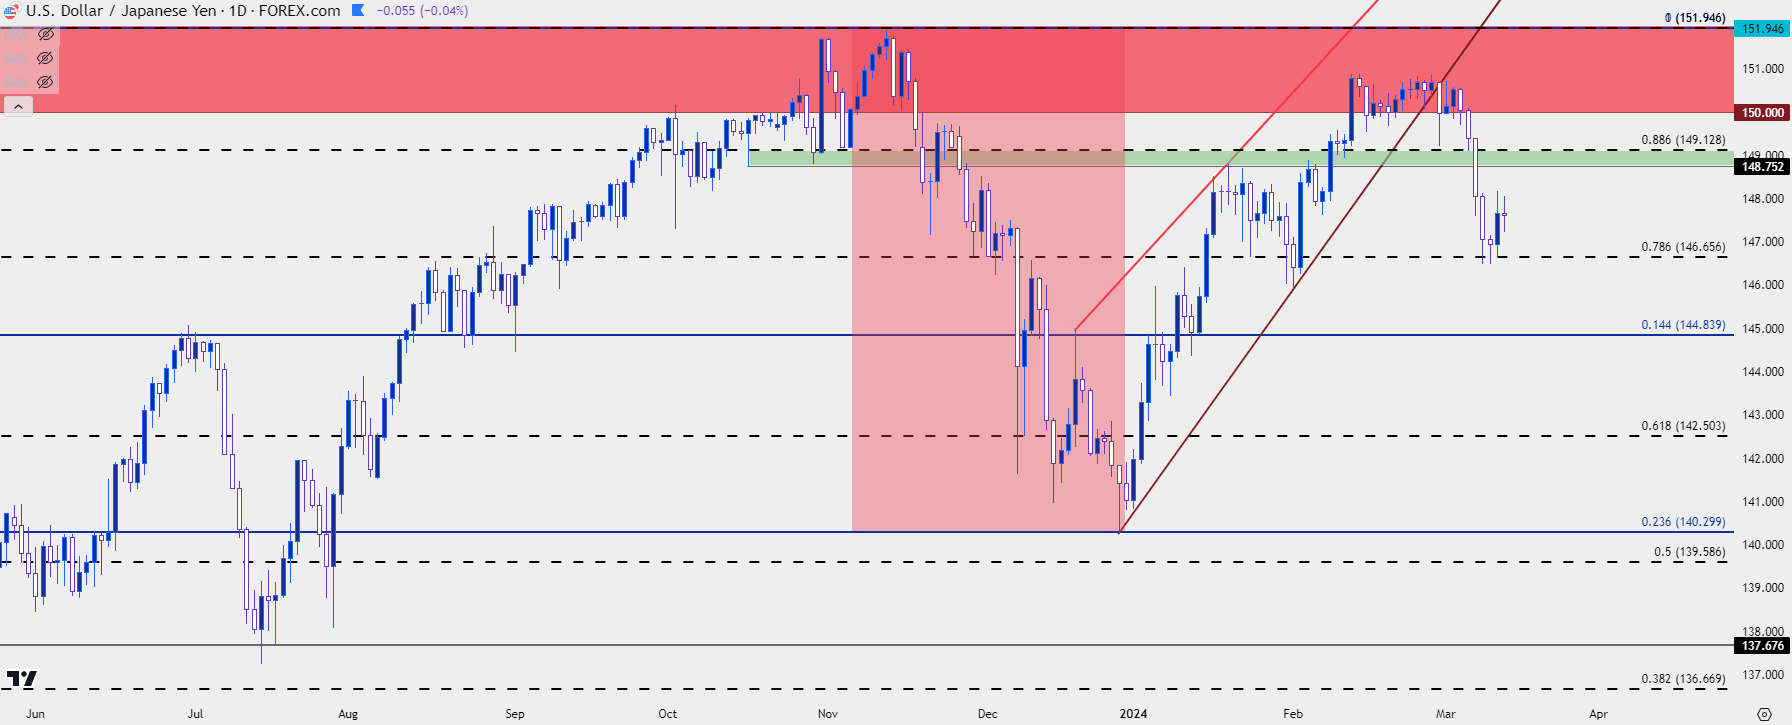
And that’s happened to a degree as price had shed more than 300 pips since that article was published, down to the low that was set last week.
But – this pales in comparison to the 2,472 reversal in 2022 or the 1,165 pip reversal in 2023; and while price has broken below the rising wedge, which further indicates bearish tendencies, the lack of USD-weakness so far this week has allowed that positive carry in USD/JPY to lead to a deeper pullback.
But – the key matter here is that it looks like the U.S. will not be seeing higher rates anytime soon as the Fed remains dovish. And the Japanese Finance Ministry has remained very watchful of the USD/JPY exchange rate, again threatening intervention as price moved towards the same 152.00 levels that’s evoked their ire in each of the past couple of years. Those two factors can be enough to modulate bullish aspirations and that’s something that could lead-in to greater reversal tendency.
Rate cuts out of the U.S., or rate hikes out of Japan could similarly make that positive carry on the long side of USD/JPY a less attractive prospect, further motivating carry traders to bail.
And at that point, like with any other crowded trade, it becomes the ‘smoke in the theater’ scenario where the exit door is only so wide, and many are unwilling to wait, so they bail quickly leading to a sharp sell-off in the pair.
In USD/JPY, because the Fed has been so dovish and because they’ve talked up rate cuts so aggressively, this can retain some bearish attraction to the pair. From the below chart, we can see price holding support at the 78.6% Fibonacci retracement of the 2022-2023 sell-off, and there’s lower-high resistance potential around the 148.78-149.13 zone before the 150 level would come back into play.
USD/JPY Daily Price Chart
 Chart prepared by James Stanley, USD/JPY on Tradingview
EUR/JPY
Again, I do not know if the BoJ will go down what seems a radical route but neither does anyone else, and much what we’re hearing or seeing here is speculative. This also may be a balloon leaked by the BoJ to gauge market tolerance for such a move but we’re delving in quite a bit of unknown territory here given just how stretched the Bank of Japan has been.
But like we saw in the 2022 pullback and again in 2023, the carry trade came right back as rate policy remained tilted to the long side of those pairs.
As I talked about a couple of weeks ago, there could be scope for continuation elsewhere given that ECB appears to be trying to avoid the rate cut topic and, in the U.K., inflation remains well above expectations and the BoJ can’t really consider cuts at this point. So, if we do see Yen-weakness remain or return, there could be bullish scope in each of those pairs with perhaps GBP/JPY carrying a bit more attraction in that theme, as I had discussed in yesterday’s webinar.
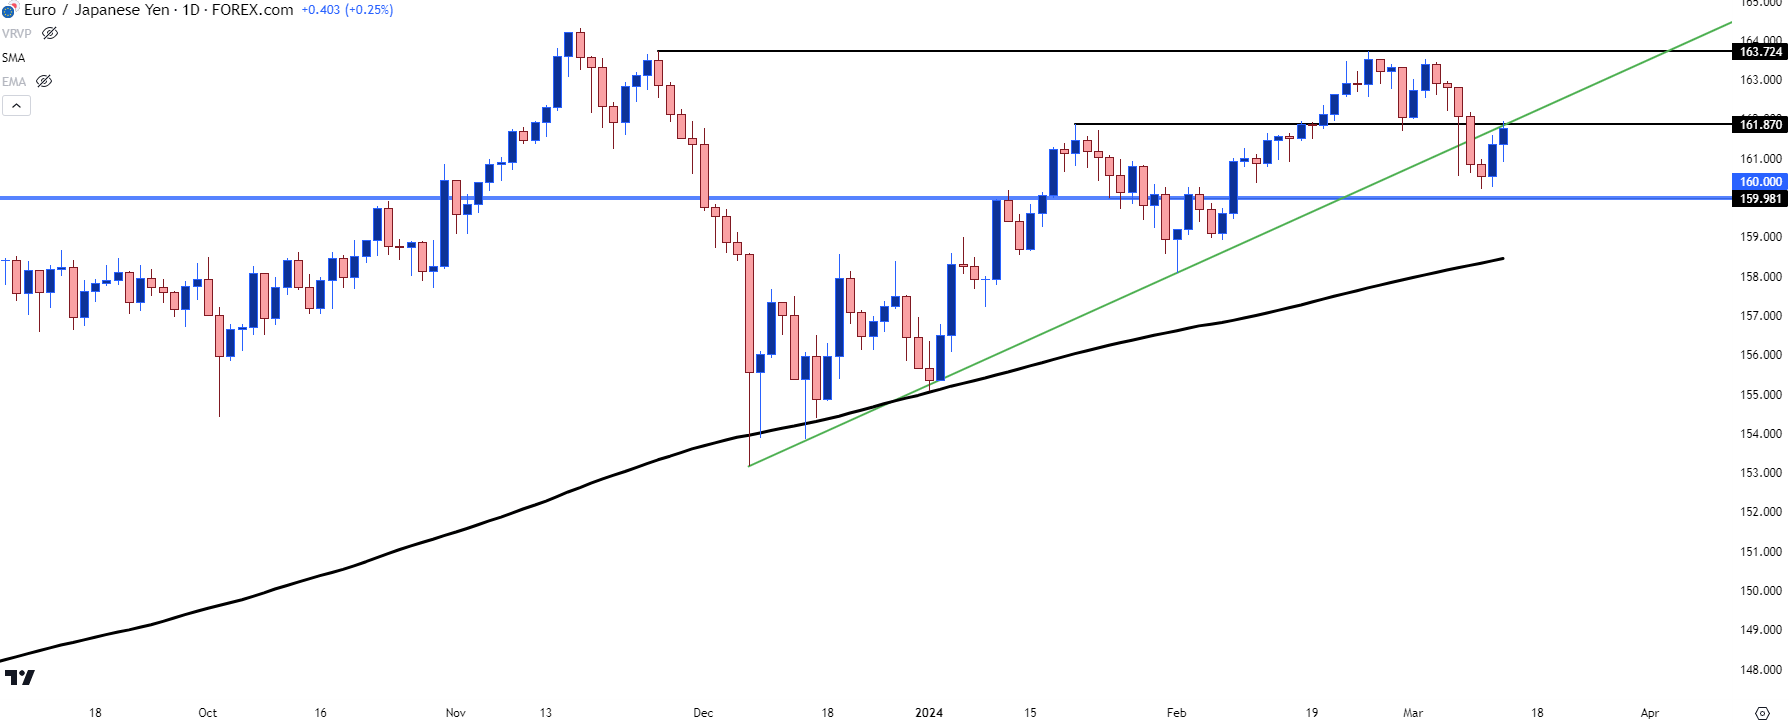
In EUR/JPY, the case is a bit less clear but the technical picture could offer some feedback. EUR/JPY continues to trade above the 160.00 psychological level; but there’s also been a breach of a bullish trendline and as of this writing, it’s helping to hold lower-high resistance. If bears can hold that – and then push a break of the 160.00 handle, the picture could grow more attractive for reversal potential. But, at this point, price is well-elevated beyond the 200-day moving average which did a good job of holding the lows over three separate occasions in December and January.
EUR/JPY Daily Price Chart
 Chart prepared by James Stanley, EUR/JPY on Tradingview
GBP/JPY
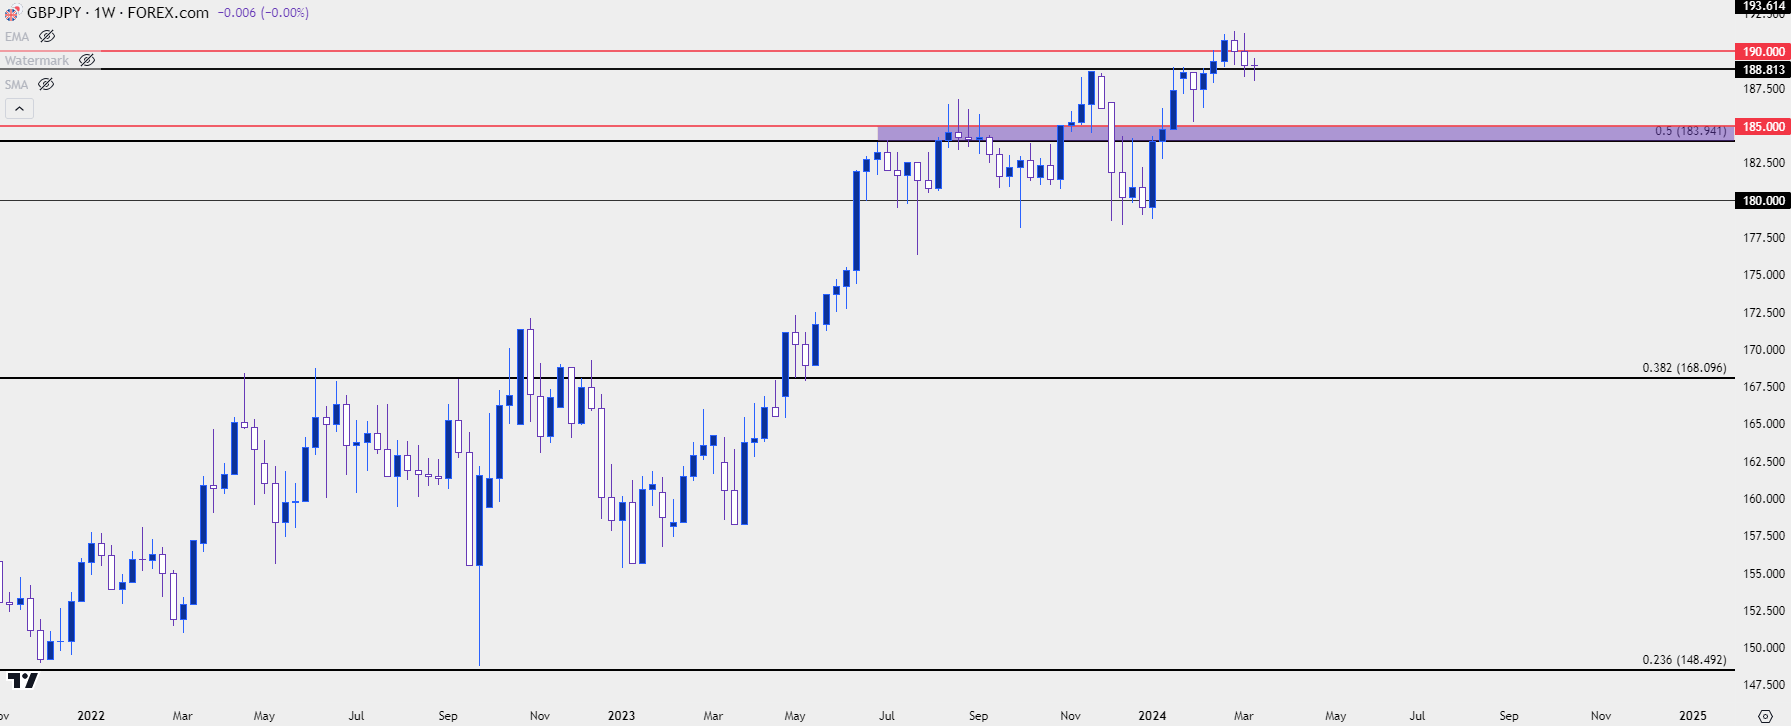
The bullish case can be perhaps a bit more optimistic in GBP/JPY. While the pair has pulled back over the past two weeks, that’s also on the heels of a fresh eight-year high. And, so far, price has held support this week around prior resistance at the 188.81 level.
If the BoJ ends up not touching policy next week or perhaps even in April, and if Yen-weakness returns in a rebound type of scenario, then GBP/JPY could retain some attraction given how strong GBP has been so far this year, both against USD and JPY.
GBP/JPY Weekly Price Chart
 Chart prepared by James Stanley, GBP/JPY on Tradingview
--- written by James Stanley, Senior Strategist


