
Japanese Yen Talking Points:
- The Bank of Japan remains an outlier on policy amongst major global central banks after having just pushed their first rate hikes since 2017 a few months ago.
- The big question right now is whether the BoJ feels comfortable enough to hike rates again and tonight’s meeting would be a key opportunity to signal an oncoming rate hike in July. There’s been wide-ranging speculation that the BoJ may soon slow bond buying
- In USD/JPY expectations are highly important as the currency remains very near multi-decade highs as driven by the carry trade over the past four years. With the Fed scaling back cut expectations at yesterday’s FOMC, JPY could be vulnerable to further losses should the topic of rate hikes remain avoided.
- USD/JPY is noisy, but for Yen-bulls, EUR/JPY may present a more amenable backdrop while Yen-bears may find more conducive setups in GBP/JPY or AUD/JPY, further investigated below.
- I’ll be discussing these themes in-depth in the weekly webinar. It’s free for all to register: Click here to register.
USD/JPY remains very near multi-decade highs as we move into the Bank of Japan rate decision later tonight.
It’s not without effort from the BoJ, however, as the bank intervened to defend the 160.00 spot in USD/JPY with a reported $62 billion spent on intervention. It did create a sharp move through the May open, with USD/JPY dropping all the way down to re-test support at prior resistance at the 152.00 handle. But bulls remained undeterred and with the carry positive on the long side and negative on the short side, the trend continued to scale-higher for much of last month.
At this point, it looks like $62 billion was burned into thin air, but as a thought exercise – imagine where the spot rate in USD/JPY would be without that intervention in late-April? Given the rate divergence in the pair along with the return of USD-strength as rate cuts have been getting priced-out, we could easily be looking at a 170.00 or 175.00 situation.
And the reason for that remains the rate divergence in the pair: That’s what’s on center stage right now as we move into the BoJ rate decision later tonight. And the pair remains very near that same 160.00 spot that the Bank of Japan was ordered to defend by the Finance Ministry in late-April.
USD/JPY Weekly Price Chart
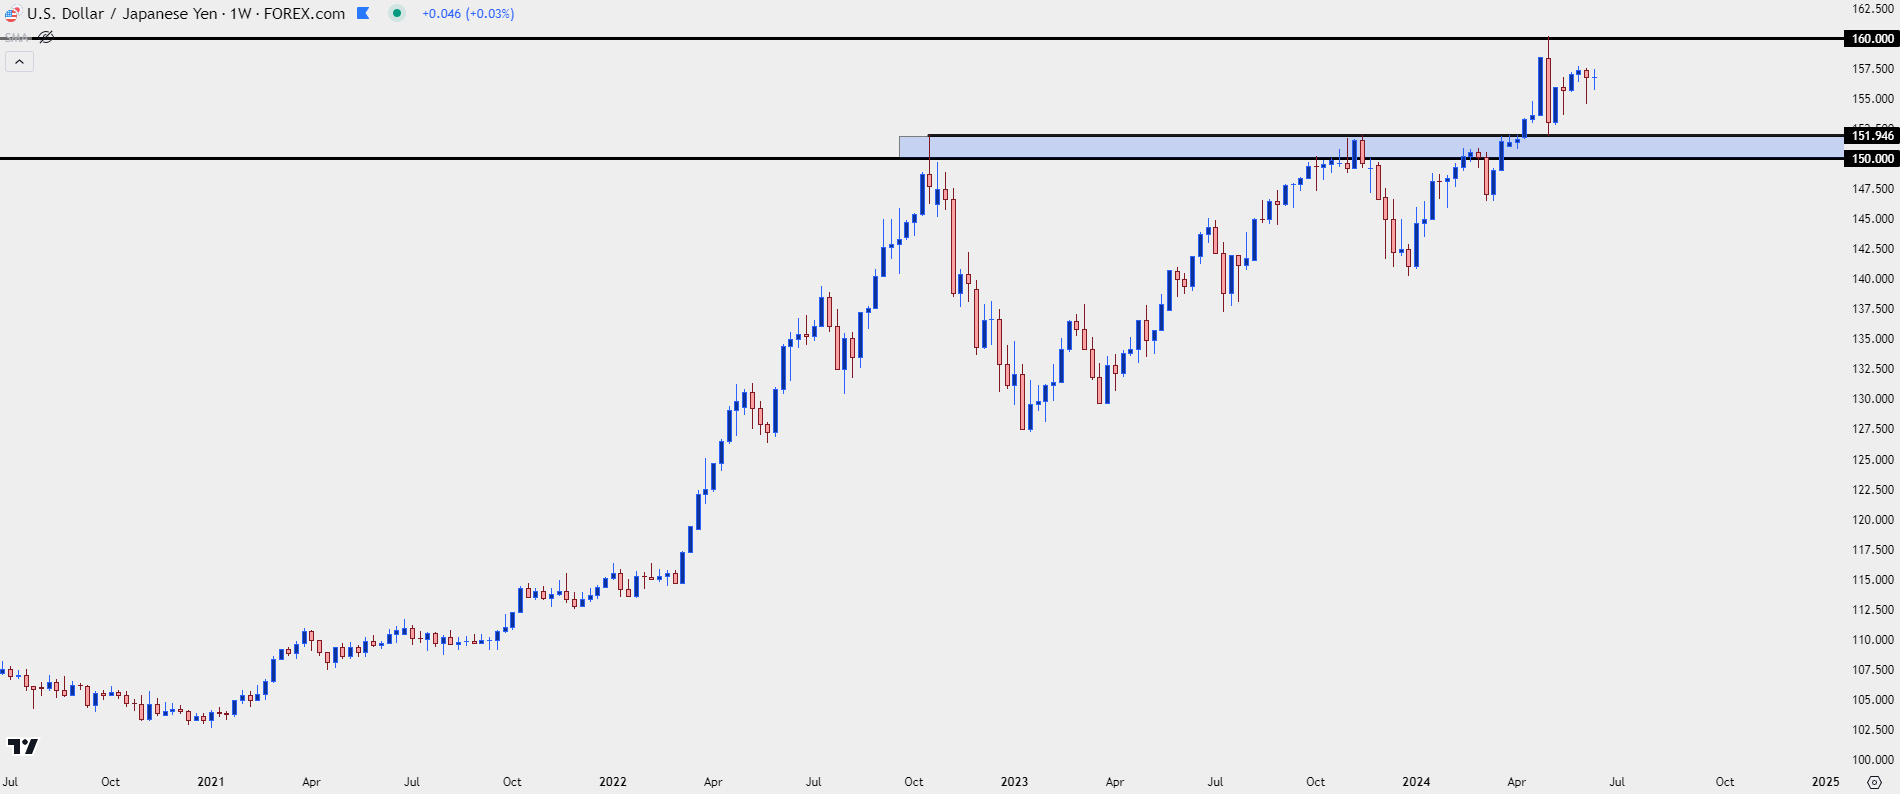 Chart prepared by James Stanley, USD/JPY on Tradingview
JPY: Band Aids v/s Structural Change
In the FX market carry can be a major driver of trends. And the reason for that is fairly logical as investors are incentivized to buy the higher-yielding currency while selling the lower-yielding currency. This can allow for daily rollover payments, which then serves as a form of incentivization to others to buy the trend in order to capture the carry.
As more investors and traders do this, demand rises, and then so does price to reflect that greater demand. That can lead into a symbiotic scenario where investors trading the carry are also able to ride a trend as pushed by that rate differential.
And if rates keep diverging, such as they did between the US and Japan in 2022 and 2023, well there can be even more reason for bulls to jump into the trend.
This is the carry trade and when it’s at work with a strong trend, it can be a beautiful thing.
But – and this is an important but – it’s not always linear. We’re talking about markets here, and investors and traders are constantly trying to look around-the-next-corner for what might be on the horizon.
Carry trades can quickly become crowded, and like any crowded market or trade, simple whiffs or hints of change can drive an exodus. This is what happened in Q4 of 2022 and 2023, with USD/JPY retracing more than 2,400 pips in the former instance and more than 1,000 in the latter. The big driver in each of those scenarios were US CPI prints, coming in below expectations and fueling hopes that the Fed would soon be shifting policy.
With that lower-than-expected inflation fueling hopes for lower rates out of the US, the incentive for holding long carry was diminished, and then we can see the ‘crowded theater, starting to smell of smoke’ phenomenon, and that’s whey traders can rush for the exits in effort of avoiding a stampede out of the crowded side of the market. That’s why we saw 50% of the 2021-2022 trend erased in three short months after it had taken 21 months to build. Support soon showed at the 50% retracement of that prior bullish move and bulls loaded up again through much of last year. The second instance in 2023 was briefer, with price posing a 23.6% pullback before support appeared ahead of year-end.
But, as I had written in March after the BoJ’s rate hike, that 152.00 level was vulnerable and there were likely a plethora of stops sitting just above it – and when triggered, those stops add demand to the market which can fuel a breakout move. This happened after the US CPI report on April 10th, which illustrated that the Fed may not be so close to rate cuts and ultimately, that’s what brought bulls back in to the long side of USD/JPY.
USD/JPY Daily Price Chart
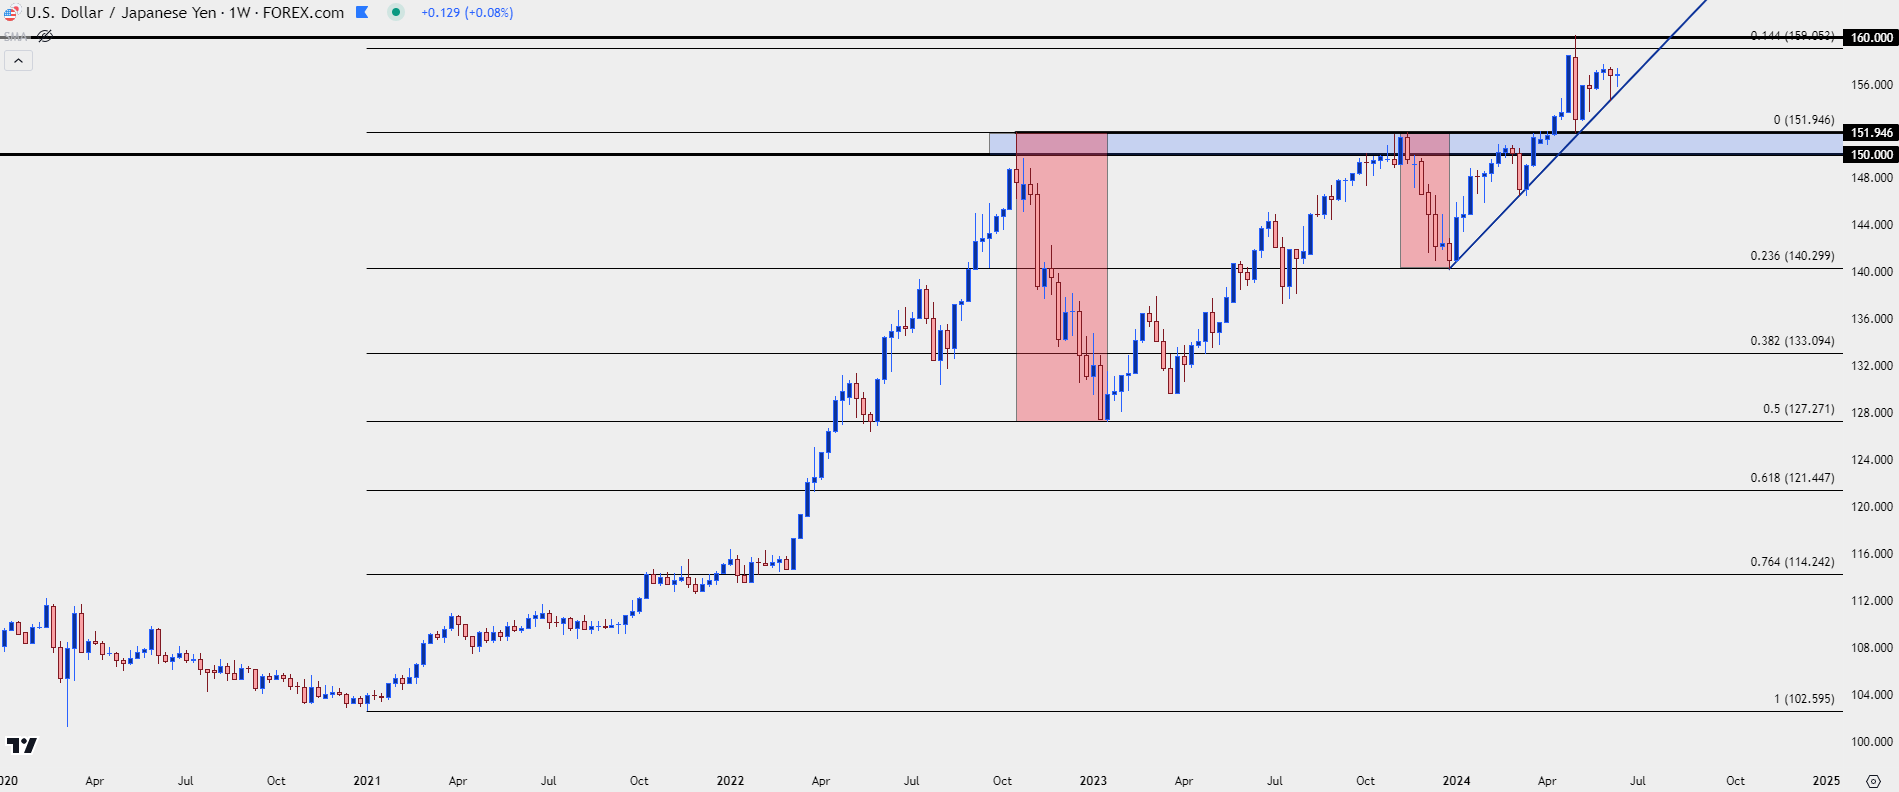 Chart prepared by James Stanley, USD/JPY on Tradingview
A Growing Case for Change But How Motivated is the Bank of Japan?
Japan has a demographic conundrum. And that’s fairly well known, as the Japanese population is expected to contract by as much as 50% by the year 2100. With declining birth rates and an aging populace, policymakers are already fighting an uphill battle.
From an economic standpoint that presents a conundrum for growth: If the population declines by 20% over the next 30 years, GDP-per-capita must increase by 25% over that time simply for GDP to remain the same. And that’s a no growth scenario, so if Japan wants organic growth, then GDP-per-capita would need to increase by 30% or more. And this would be in a backdrop with fewer domestic consumers to sell products to, which would mean that inflation would need to increase by even more to offset that decline in the population.
These are difficult societal trends to reverse, and it may have a role as to why the Bank of Japan has been so accepting of risk on the monetary side while keeping rates in negative territory for much of the past few years, even as other major central banks have hiked rates.
This also explains the massive increase in the Bank of Japan’s portfolio as years of QE have purchased a large portion of the Japanese Government Bond market. With percolating rumors that the BoJ may announce a shift there, it could be seen as a sign that the bank is looking to slowly, and carefully, attempt to tighten and reign in policy.
The bigger question is whether that would be enough to frighten carry traders out of long positions, in a manner like what was seen in November of each of the past two years. And for that, I simply refer to the chart.
Much like we saw on the way up, with the 152 level leading to a mass of stop orders on short positions, which, when triggered led to a strong bullish breakout that eventually ran to the 160.00 level; there are likely a plethora of stops below the 150.00 handle. And if those get triggered, stop orders on long positions are sells, which could add more supply into the market and lead-in to a breakdown-like scenario.
I see that as a lower-probability scenario at the moment given the response to the FOMC rate decision yesterday, which helped to keep USD bulls backing the bid in DXY. But tonight’s BoJ rate decision can begin to lay the groundwork for such, so that if a below-expected inflation report comes in that gives hope for near-term rate cuts in the US, that reversal scenario in USD/JPY could look a bit more attractive.
USD/JPY Daily Price Chart
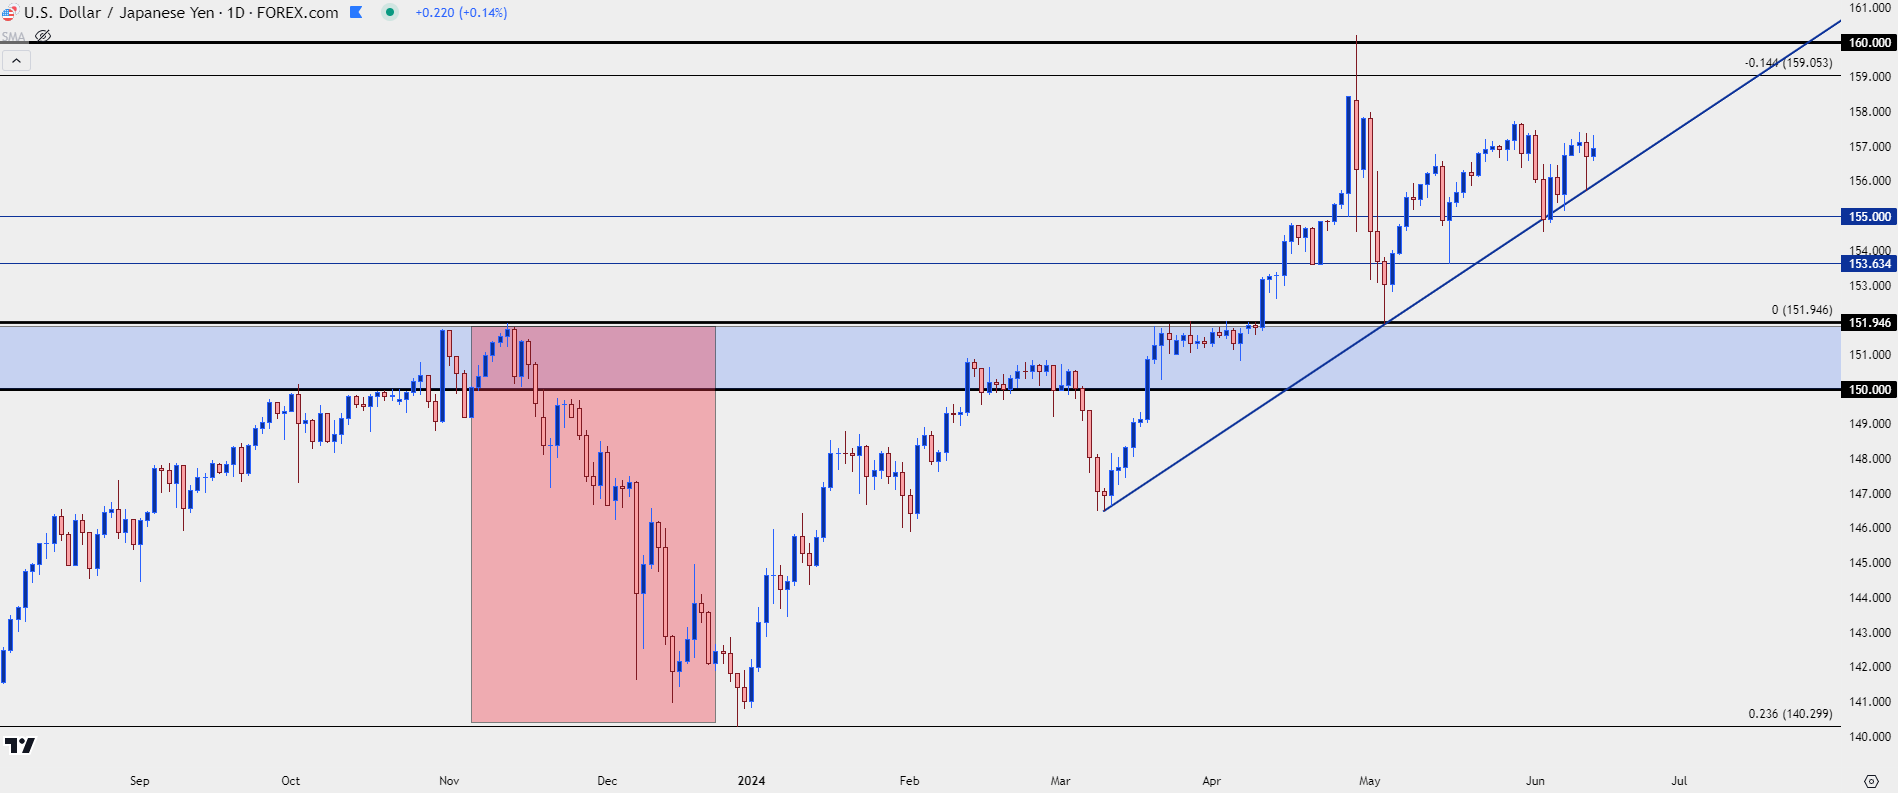 Chart prepared by James Stanley, USD/JPY on Tradingview
EUR/JPY
While the US seems a bit further away from rate cuts after yesterday’s FOMC meeting and Friday’s NFP report, Europe has already begun cutting rates and for those looking for Yen-strength, EUR/JPY may present a bit more opportunity than what was looked at above.
EUR/JPY has struggled to hold above the 170.00 psychological level despite a couple of different tets above, including another failure this morning. That failure has led to the build of a bearish outside bar and this points to support potential as taken from a bullish trendline connecting December and March swing lows.
If bulls fail to hold there, there’s a swing of resistance-turned-support at 167.39 that remains of interest, and if bears can push below that, we could have the early makings of a short-side trend starting to build.
EUR/JPY Daily Price Chart
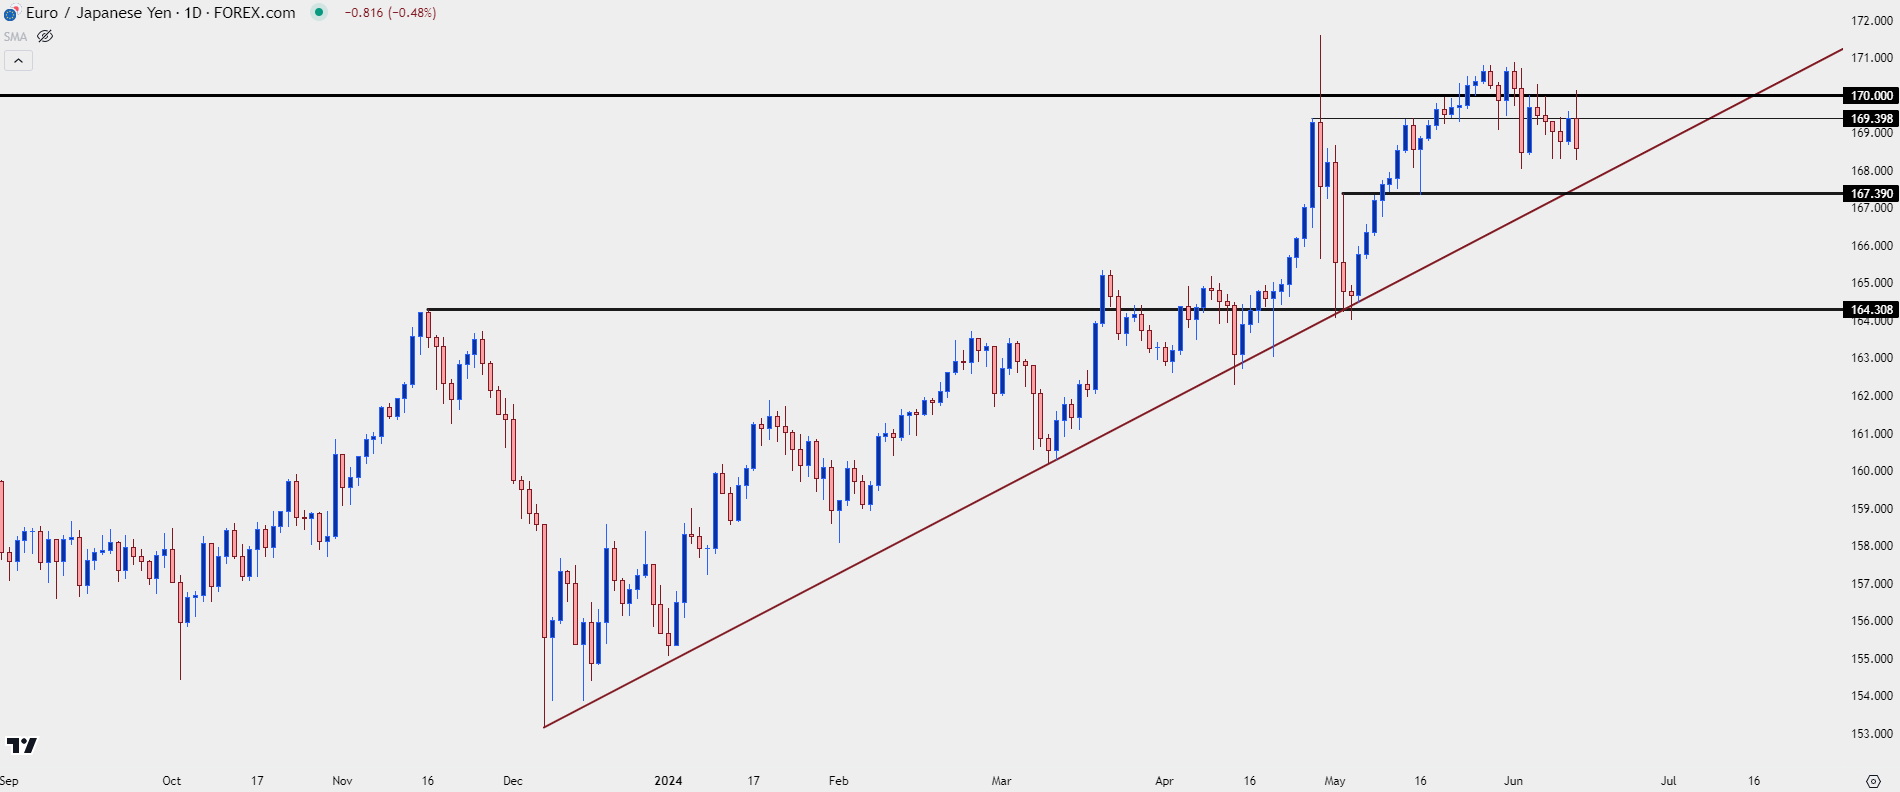 Chart prepared by James Stanley, EUR/JPY on Tradingview
GBP/JPY
Given the breakdown in EUR/GBP since the ECB’s rate cut, there’s been a clear shift amongst the two currencies. And a culprit behind that is inflation, as core CPI in the UK remains higher than that of the US. And while it seems like the Bank of England really wants to cut rates as soon as they can, they find themselves in a similar spot as the Fed, constrained by elevated inflation.
As such, GBP/JPY may present one of the cleaner cases for Yen-weakness continuation. The pair has continued to try to gain acceptance over the 200.00 psychological level and there remains an ascending triangle formation has built with the recovery from the intervention-fueled pullback.
GBP/JPY Daily Price Chart
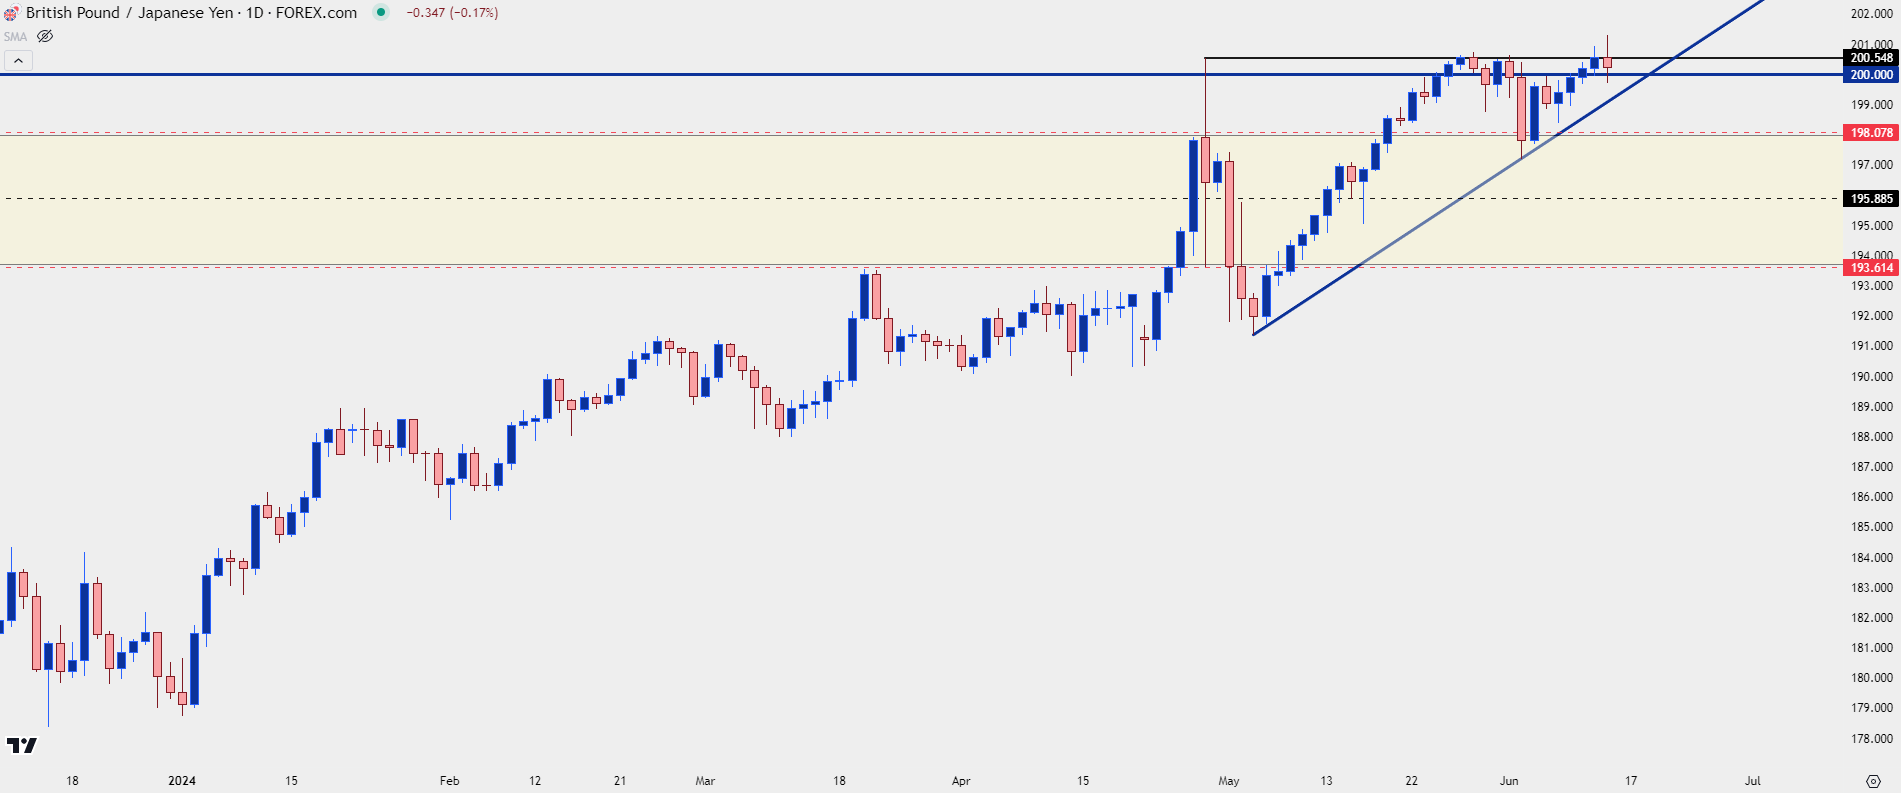 Chart prepared by James Stanley, GBP/JPY on Tradingview
AUD/JPY
AUD/JPY presents an interesting case: The pair isn’t quite as strong as GBP/JPY nor is it as weak as EUR/JPY or even USD/JPY. But, there’s been struggle at a spot on the chart that has some historical reference with the 105.00 level. This price was last in-play back in 2013, and it was brief, as it helped to set a top before a 45% retracement that developed over the next seven years.
And, for the past three months, it’s kept bulls at bay as the pair has continuously stalled before a re-test of the big figure.
AUD/JPY Monthly Price Chart
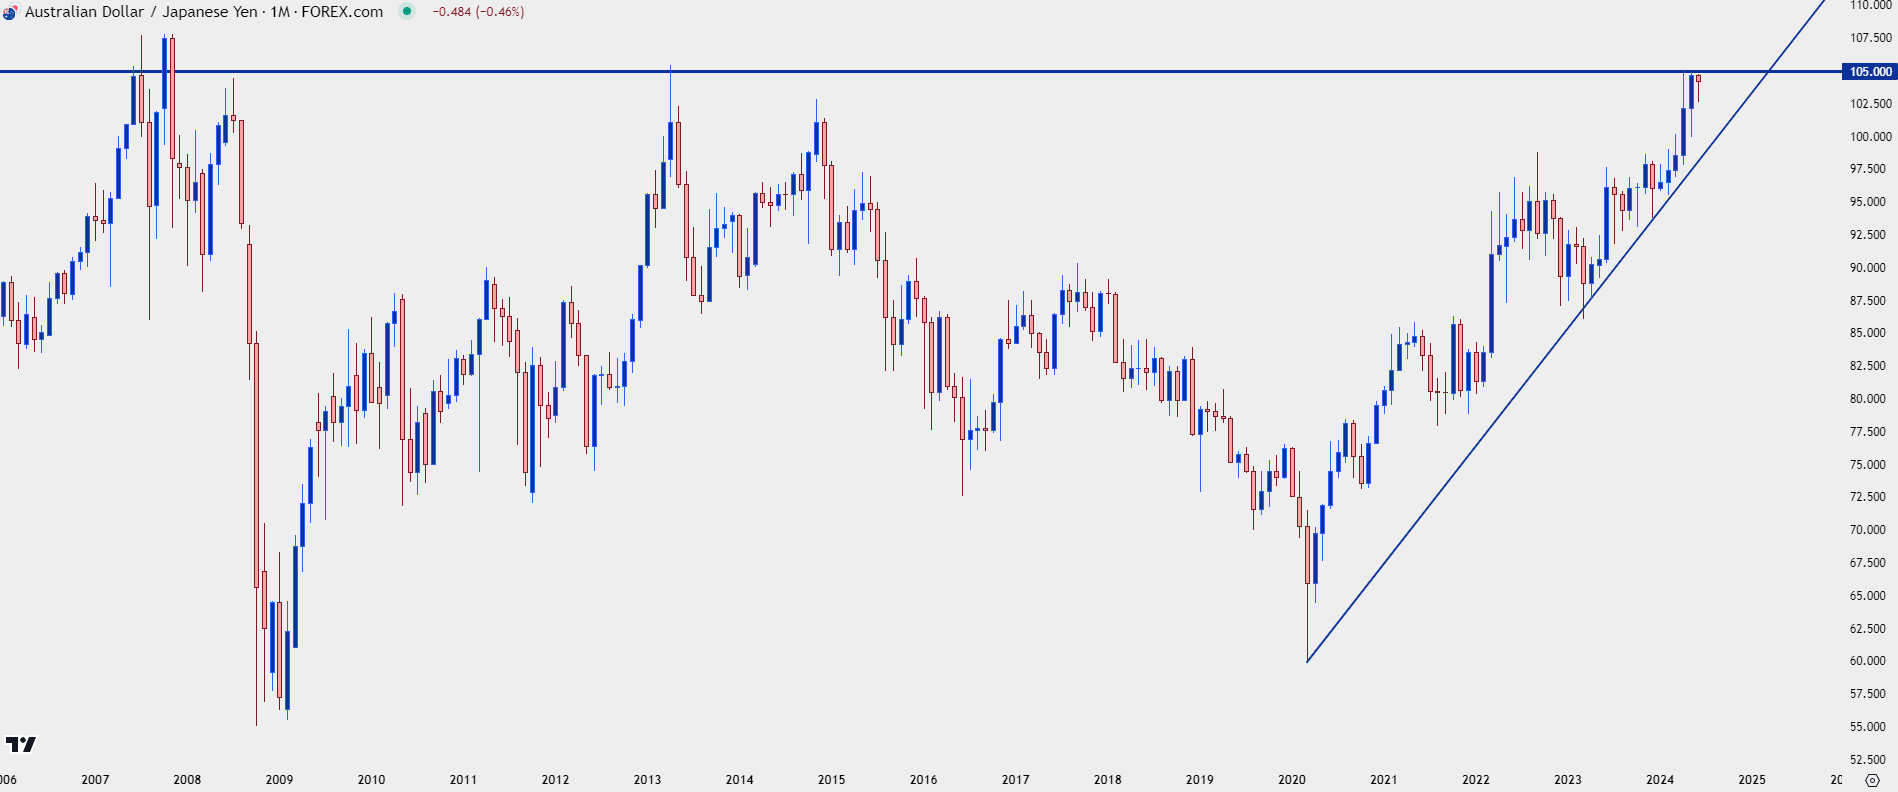 Chart prepared by James Stanley, AUD/JPY on Tradingview
On the Daily chart below, we can see impact from that 105.00 level as bulls have held lower-highs while not wanting to dare a re-test of the big figure. But, on the other side, bulls have also been showing increasing anticipation, as highlighted by the upward-sloping trendline. This creates an ascending triangle formation, often approached with aim of bullish breakout. And that can keep AUD/JPY as an attractive venue for scenarios of Yen-weakness around tonight’s rate decision.
AUD/JPY Daily Price Chart
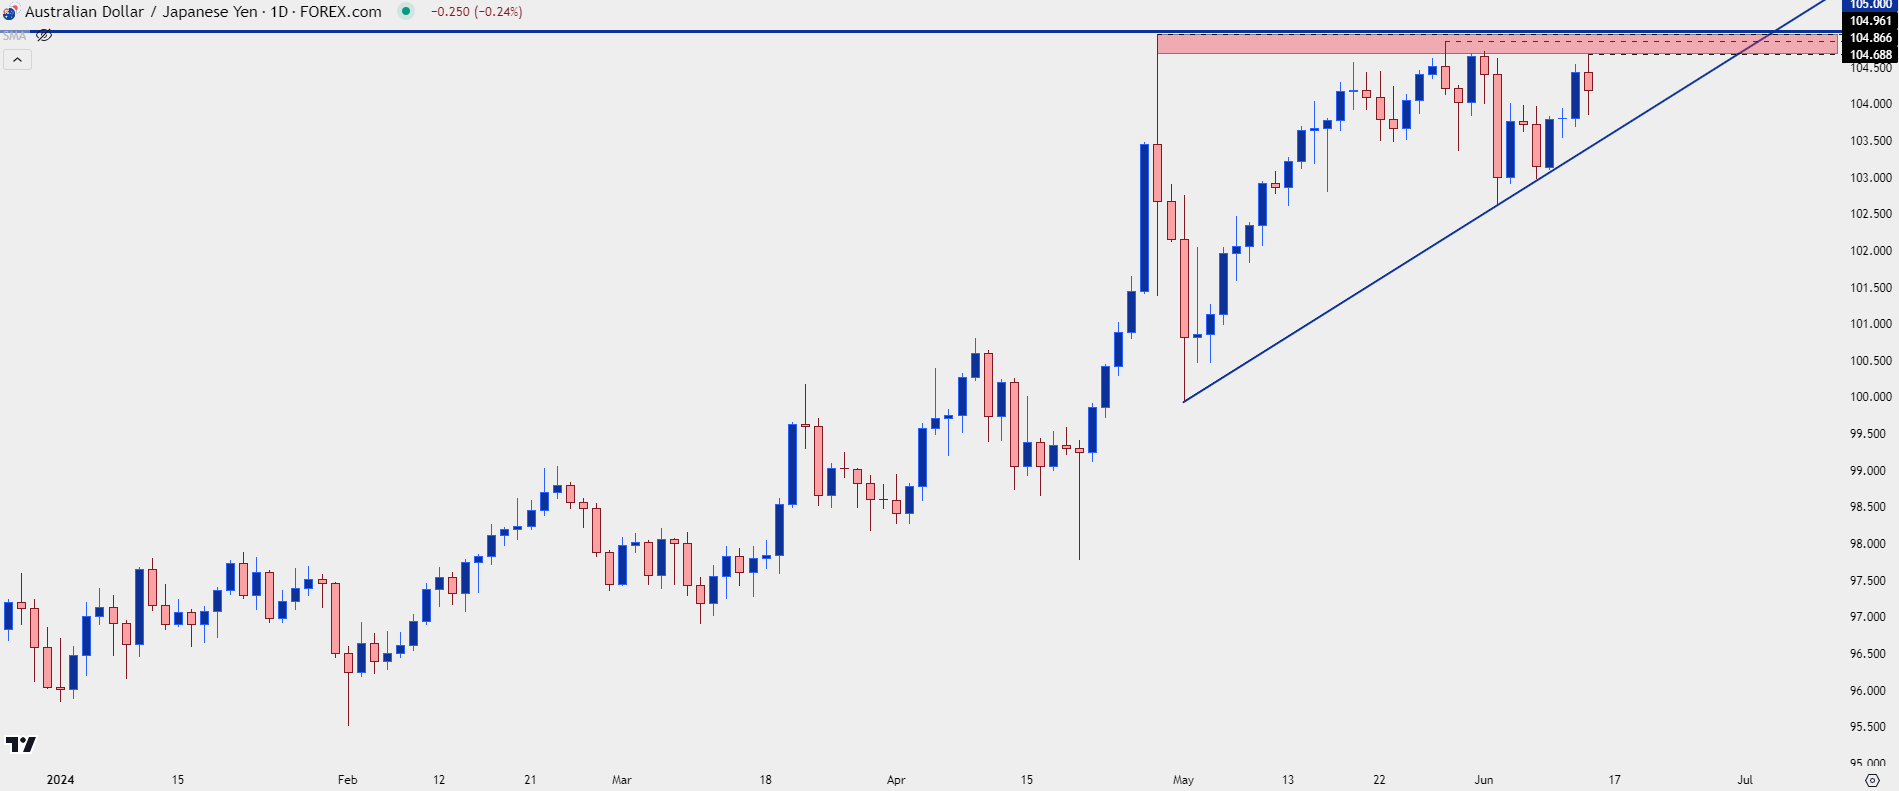 Chart prepared by James Stanley, AUD/JPY on Tradingview
--- written by James Stanley, Senior Strategist


