Japanese Yen technical outlook: USD/JPY short-term trade levels
- Japanese Yen breakout approaching initial resistance
- USD/JPY risk for near-term pullback- broader outlook remains constructive
- Resistance 135.49, 136.66-137.65, 139.58– support 134.19, 132.87 (key) 131.10
The Japanese Yen has been under pressure for the past few weeks with USD/JPY rallying back into the January highs. Although the broader outlook remains constructive, the threat for a near-term pullback rises while below a key resistance pivot just higher. These are the updated targets and invalidation levels that matter on the USD/JPY short-term technical charts.
Discussing this USD/JPY price setup and more in the Weekly Strategy Webinars beginning February 27th.
Japanese Yen Price Chart – USD/JPY Daily
 Chart Prepared by Michael Boutros, Sr. Technical Strategist; USD/JPY on TradingView
Technical Outlook: The Japanese Yen fell more than 6.4% against the US Dollar since the January lows in USD/JPY. A breakout of the October downtrend early in the month is now probing the objective 2023 opening-range highs around 134.77. The immediate advance may be vulnerable here near-term with the broader outlook constructive while above median-line
Japanese Yen Price Chart – USD/JPY 240min

Chart Prepared by Michael Boutros, Sr. Technical Strategist; USD/JPY on TradingView
Notes: A closer look at the Yen price action shows USD/JPY trading within the confines of an ascending channel with price now approaching initial resistance at the 100% extension of the January advance at 135.48- risk for possible topside exhaustion into this zone.
Weekly-open support rests at 134.19 with medium-term bullish invalidation now raised to the lower parallel / February opening-range highs at 132.87- an area of interest for possible downside exhaustion IF reached. A break below this threshold would be technically damaging and would threaten another accelerated decline towards yearly-open support at 131.10.
A topside breach exposes a critical resistance zone at 136.66-137.65- a region defined by the 38.2% retracement at of the October decline, the 200-day moving average, and the November swing lows. A breach / daily-close above this level is needed to fuel the next leg higher in price towards 139.58.
Bottom line: USD/JPY has broken the monthly opening-range highs and while the trade remains constructive, the immediate advance may be vulnerable here. From at trading standpoint, a good zone to reduce portions of long-exposure / raise protective stops - losses should be limited to 132.87 IF price is heading higher with a close above 137.65 needed to mark resumption of the uptrend.
Review my latest Japanese Yen weekly technical forecast for a longer-term look at the USD/JPY trade levels.
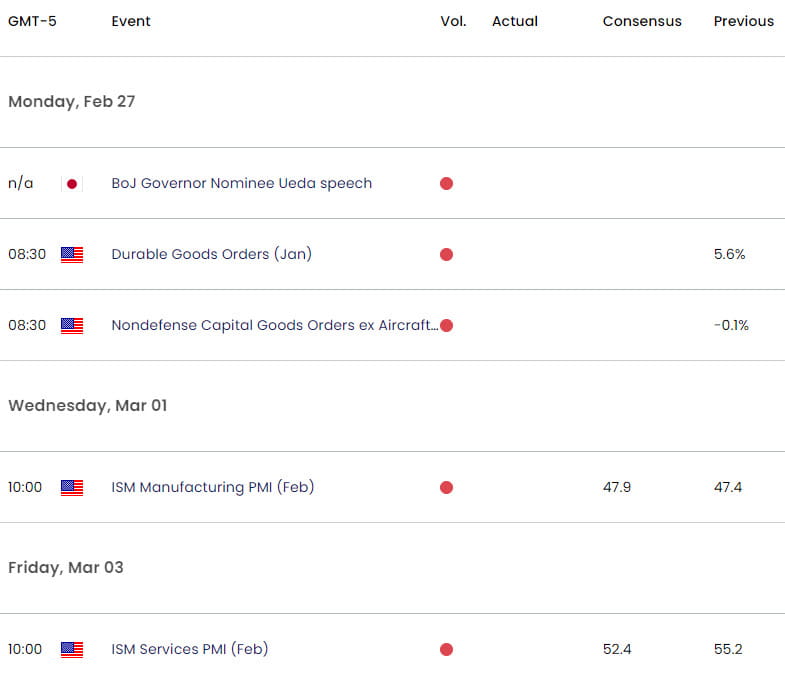
Key Economic Data Releases

Economic Calendar - latest economic developments and upcoming event risk.
Active Short-term Technical Charts
- Gold short-term price outlook: XAU/USD grasps at support
- Australian Dollar short-term outlook: AUD/USD trend support in focus
- Canadian Dollar short-term outlook: USD/CAD Bulls Emerge
- Euro short-term technical outlook: EUR/USD decision time
--- Written by Michael Boutros, Sr Technical Strategist with FOREX.com
Follow Michael on Twitter @MBForex


