Japanese Yen technical outlook: USD/JPY short-term trade levels
- Japanese Yen losses halted major pivot zone
- USD/JPY risk for larger correction within uptrend
- Resistance 134.75-135.06, 136, 136.66-137.29- support 133.03/35, ~132.30s, 131.74
Despite a range of more than 3.4% in the Japanese Yen, USD/JPY is up just 0.65% month-to-date after rebounding off yearly uptrend support. The rally stalled at a technical resistance zone and while the outlook is still constructive, the risk for a larger correction remains while below the yearly high-week close. These are the updated targets and invalidation levels that matter on the USD/JPY short-term technical charts into the close April.
Discussing this USD/JPY price setup and more in the Weekly Strategy Webinars on Monday’s at 8:30am EST.
Japanese Yen Price Chart – USD/JPY Daily

Chart Prepared by Michael Boutros, Sr. Technical Strategist; USD/JPY on TradingView
Technical Outlook: In my last Japanese Yen short-term outlook I noted that we were, “looking for possible an exhaustion low / price inflection early in the month. Ultimately, losses should be limited to 130.56 IF the January rally is to remain viable.” USD/JPY registered an intraday low at 130.62 before rebounding off uptrend support with the rally extending more than 3.3% off the monthly lows.
The rally has been testing a pivotal resistance zone this week at 134.75-135.06- a region defined by the 100% extension of the late-March advance, the 61.8% Fibonacci retracement of the March range, the objective January swing high, and the yearly high-week close. A breach / close above this threshold is needed to fuel the next leg higher in price.
Japanese Yen Price Chart – USD/JPY 240min

Chart Prepared by Michael Boutros, Sr. Technical Strategist; USD/JPY on TradingView
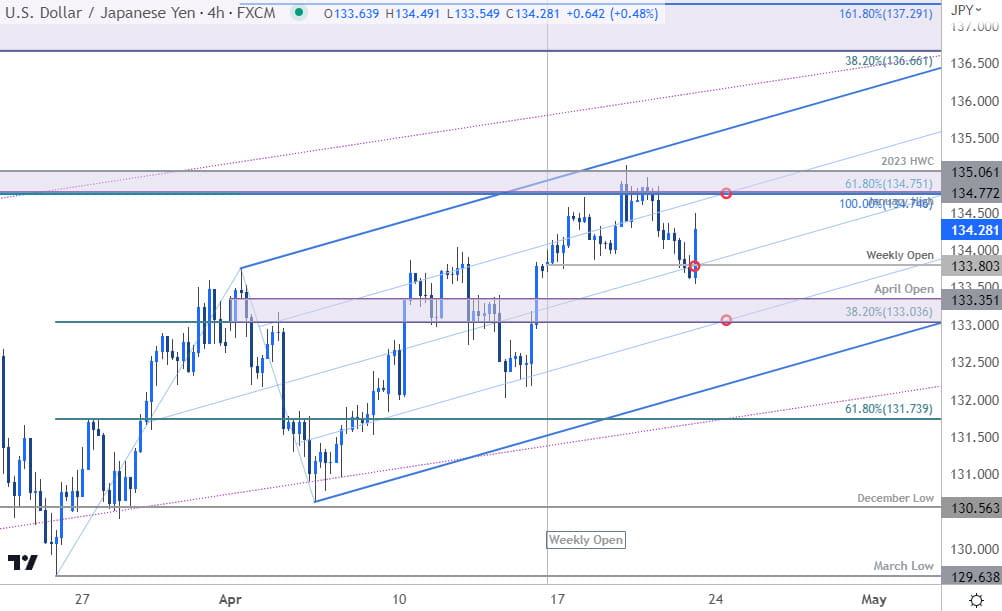
Notes: A closer look at Yen price action shows USD/JPY continuing to trade within the confines of an ascending pitchfork with price marking an outside-reversal candle after a failed attempt to break below the weekly open / opening-range lows today at 133.70/80. Losses should be limited to the 38.2% retracement / monthly open at 133.03/35 IF price is heading higher on this stretch
A topside breach exposes the upper parallel (currently ~135.60s) and the 136-handle. Critical resistance remains at 136.66-137.29 where the 38.2% retracement of the October decline, the 200-DMA, the yearly high-day close and 1.618% extension converge- look for a larger reaction there IF reached.
A break below this formation would threaten a test of yearly trend support which converges on the 61.8% retracement at 131.73. We’ll reserve this threshold as our broader bullish invalidation level.
Bottom line: The USD/JPY rally is now testing a key technical pivot zone. From a trading standpoint, the focus is on a breakout of the weekly opening-range for guidance with the outlook constructive while within this formation. Review my latest Japanese Yen weekly technical forecast for a longer-term look at the USD/JPY trade levels.
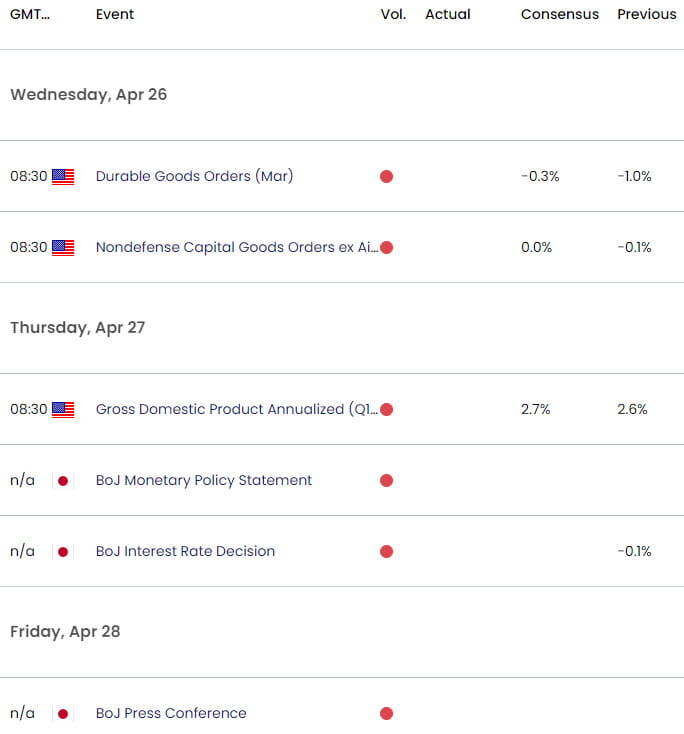
Key Economic Data Releases

Economic Calendar - latest economic developments and upcoming event risk.
Active Short-term Technical Charts
- Canadian Dollar short-term outlook: USD/CAD bulls emerge at support
- British Pound short-term outlook: GBP/USD threatens correction
- Euro short-term outlook: EUR/USD trend correction on the horizon
- US Dollar short-term outlook: USD collapses to yearly low- DXY levels
- Gold short-term price outlook: XAU/USD bulls run out of breath
- Australian Dollar short-term outlook: AUD/USD stalls at resistance
--- Written by Michael Boutros, Sr Technical Strategist with FOREX.com


