USD/JPY, JPY, Japanese Yen Talking Points:
- The week has started with a bullish breakout for the USD/JPY pair as US rates push higher.
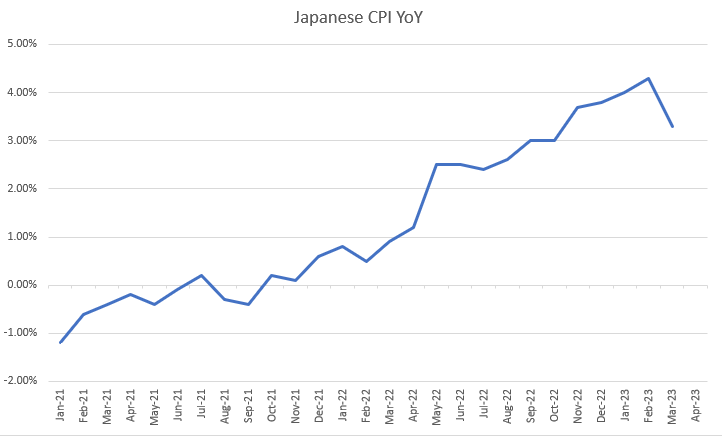
- On Thursday we get Japanese inflation data and this could be a key driver for the Yen and the USD/JPY pair. Last month saw Japanese CPI fall to 3.3% from a prior print of 4.3%, alleviating worries of building inflation for the economy of Japan.
- I’ll be discussing these themes in-depth in the weekly webinar on Tuesday at 1PM ET. It’s free for all to register: Click here to register.
USD/JPY has broken out to a fresh monthly high to start this week’s trade, testing above the resistance portion of an ascending triangle formation that I had discussed on Friday. Ascending triangles are often approached with the aim of bullish breakout and with that now taking place, the next item of interest is the 135.00 psychological level which provided resistance when being tested mid-March.
That prior test of 135.00 yielded to a strong bearish response, which then drove USD/JPY prices down to the 130.00 psychological level for a test two weeks later. But support held at the big figure and led to a quick push up to 133.76. That resistance held and prices pulled back but that led to a higher-low, around the 130.79 area, and after another test of 133.76 another higher-low developed around 132.21 before prices returned to resistance at the end of last week’s trade.
USD/JPY Four-Hour Price Chart
 Chart prepared by James Stanley, USD/JPY on Tradingview
USD/JPY Longer-Term
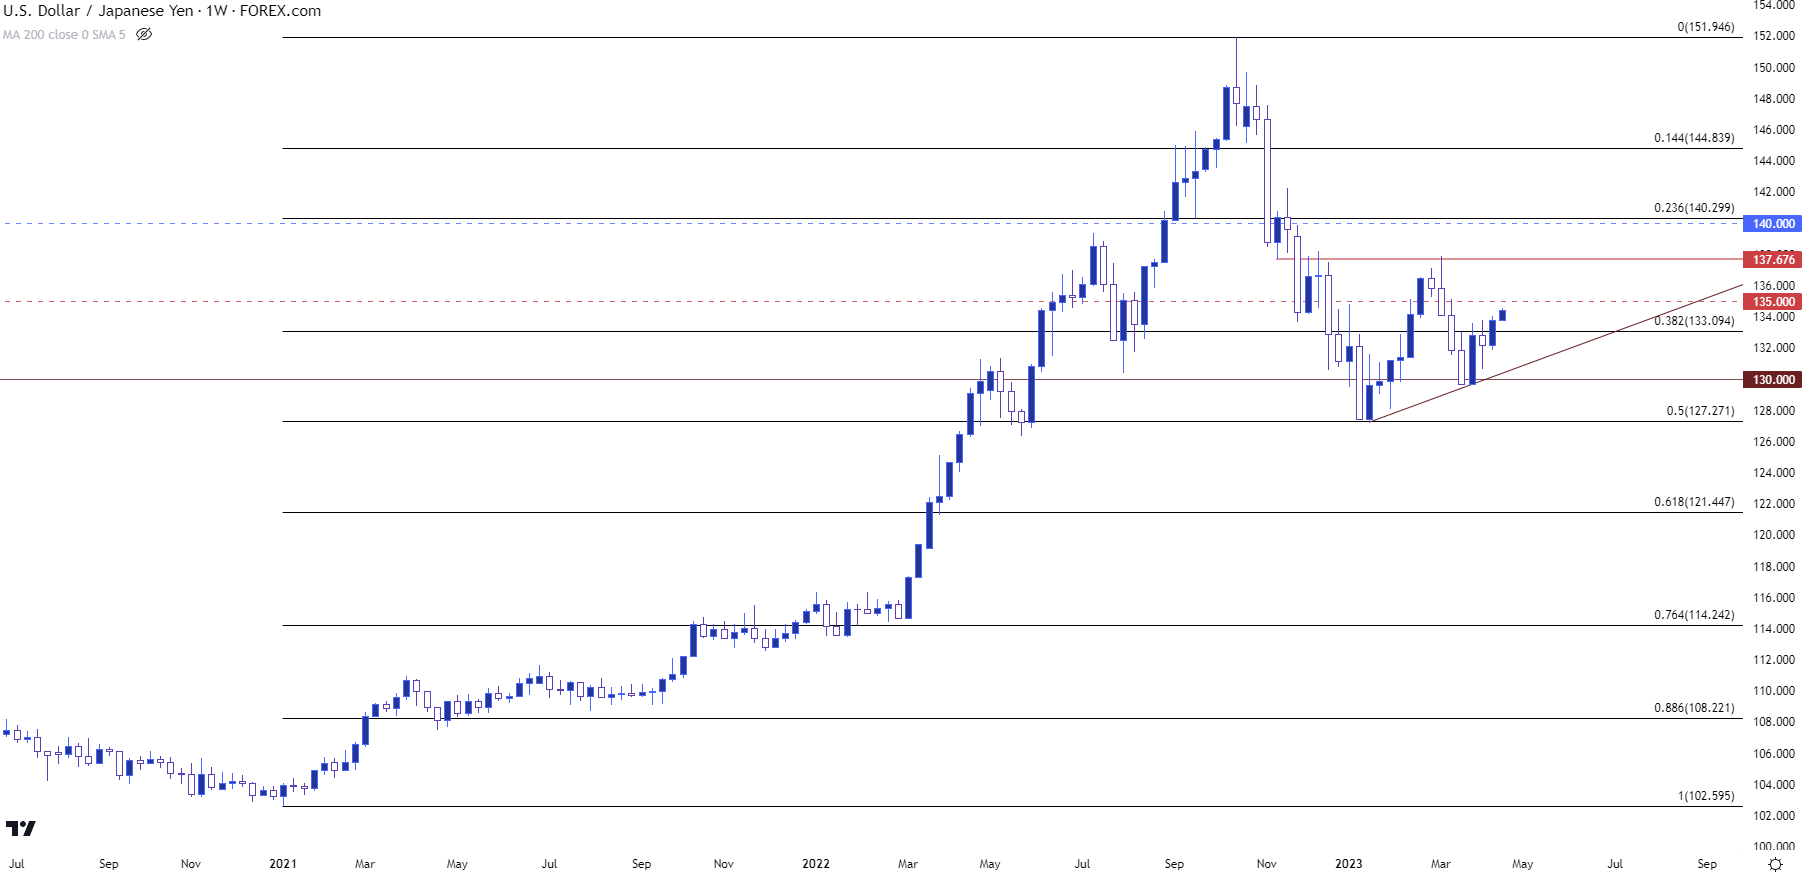
Taking a step back to the weekly chart highlights this recent bullish scenario following a strong trend in 2022 that quickly began to reverse in Q4. In Q1 of this year, the 50% mark of the 2021-2022 major move came into play to help hold the low at 127.27. That led to a bounce that brought on more than 1,000 pips until resistance showed up at 137.68. The corresponding pullback led to that 130.00 test in the middle of last month, and prices have been tilting-higher since.
It was March 23rd when we got the last Japanese CPI report, and this showed a 3.3% reading against the prior month’s print of 4.3%. Reasonably, this gives some room for Yen-weakness as a lower level of inflation in Japan bring on less impetus for the Japanese central bank to move away from their extremely passive monetary policy.
Japanese CPI YoY Since Jan, 2021

Chart prepared by James Stanley
And more recently US rates have started to push-higher, which can keep the pair as one of the more attractive venues for USD-strength from a fundamental perspective as the Bank of Japan is one of the few central banks not actively talking up tighter policy options.
This could change, of course, and given the fact that prices retraced 50% of a move in three months that took 18 months to build highlights how crowded the trade had become last year. But, after a 50% retracement with recent evidence of bulls making a re-appearance, there could be some bullish scope particularly if USD-strength continues to show on the back of higher US rates.
On a longer-term basis, the big level of note above 135.00 is that same area that caught the highs in March, just inside of the 138.00 area, after which the next major spot if resistance is around the 140.00 handle.
USD/JPY Weekly Chart
 Chart prepared by James Stanley, USD/JPY on Tradingview
--- written by James Stanley, Senior Strategist


