Japanese Yen Technical Forecast: USD/JPY Weekly Trade Levels
- Japanese Yen surges 7.6% in five-week rally - USD/JPY reverse off multi-decade highs
- USD/JPY losses accelerate into key technical support post BoJ– NFP on into August open
- Resistance 151.95, 154.34/89, 157.25 (key)– Support 148.54-149.60 (key), 146.42, 144.90
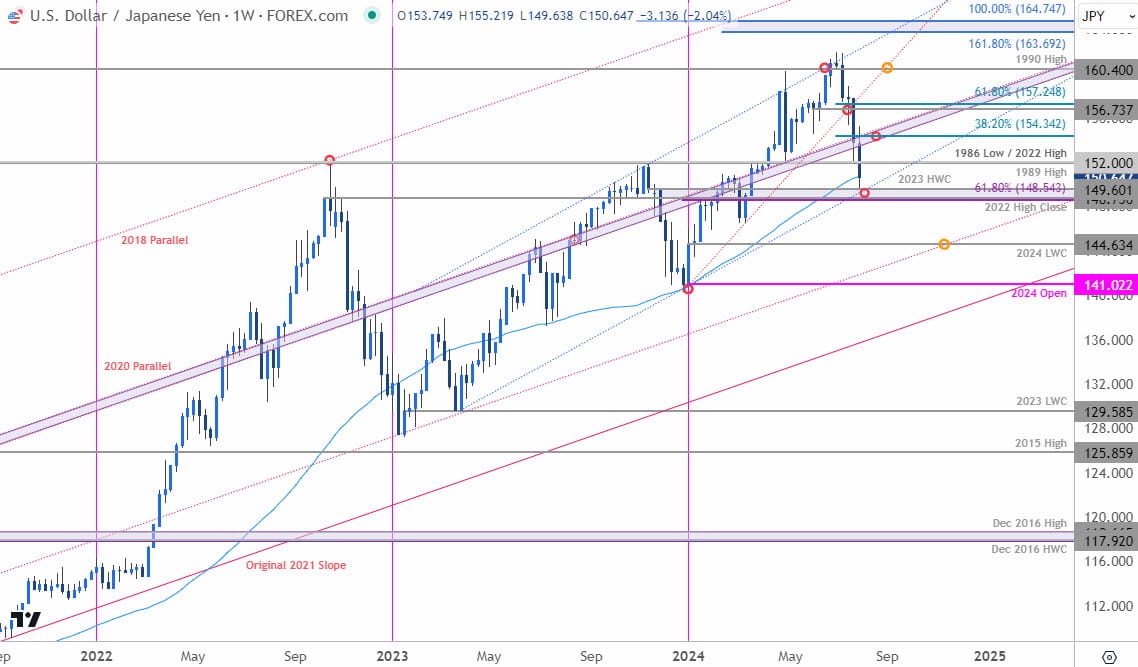
The Japanese Yen is poised to close a fifth consecutive weekly advance against the US Dollar with USD/JPY marking its largest single-month loss since November (off nearly 6.3%). A reversal off multi-decade highs is now testing major technical support hurdles and the last line of defense for the 2023 uptrend. Battle lines drawn on the USD/JPY weekly & daily technical charts heading into August.
Review my latest Weekly Strategy Webinar for an in-depth breakdown of this Yen setup and more. Join live on Monday’s at 8:30am EST.
Japanese Yen Price Chart – USD/JPY Weekly

Chart Prepared by Michael Boutros, Sr. Technical Strategist; USD/JPY on TradingView
Technical Outlook: In my last Japanese Yen Technical Forecast we noted that a, “break of the monthly opening-range in USD/JPY takes price into yearly uptrend support. From at trading standpoint, the bulls would need to defend today’s low for the late-December advance to remain viable. Rallies should be limited to the objective monthly open IF price is heading lower here with a close below 157.37 needed to suggest a larger correction is underway.”
A break below support the following week has fueled a decline of 7.6% off the yearly high with today’s BoJ rate hike taking price into a critical support zone at 148.54-149.60- a region defined by the 61.8% Fibonacci retracement of the December rally, the 2022 high close, and the 2023 high-week close (HWC). Note that the 2023 trendline (blue) converges on this threshold over the next few weeks and further highlights its technical significance- we’re looking for a reaction here into the August open.
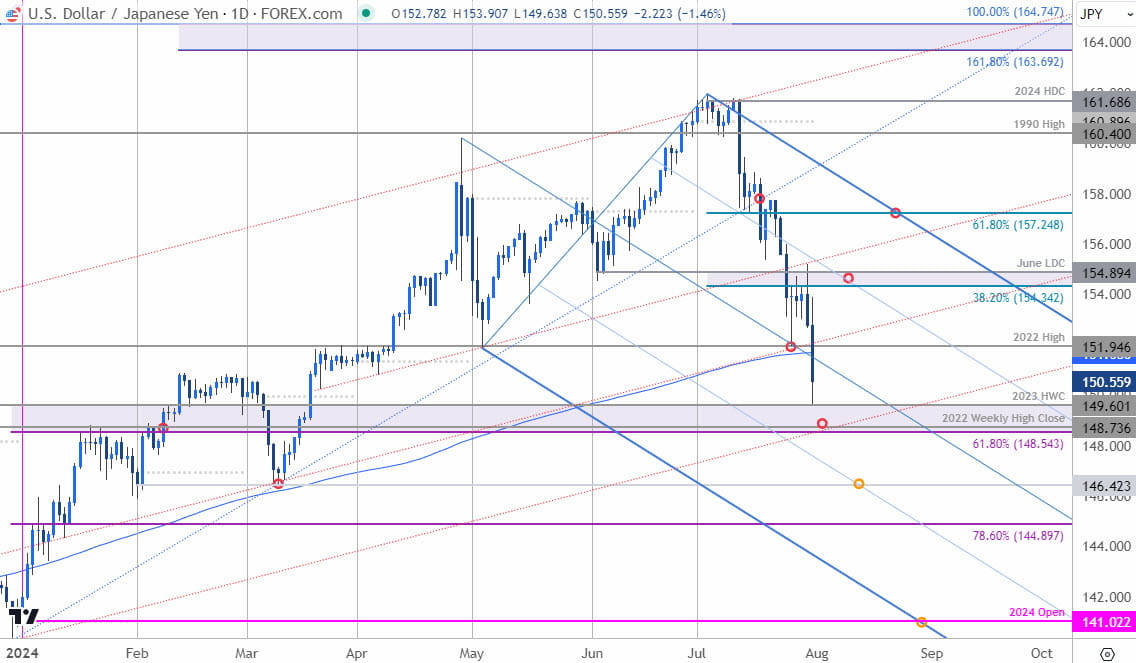
Japanese Yen Price Chart – USD/JPY Daily

Chart Prepared by Michael Boutros, Sr. Technical Strategist; USD/JPY on TradingView
A closer look at the daily chart shows USD/JPY trading within the confines of a proposed descending pitchfork formation with today’s decline threatening a break below the median-line. Initial resistance is now eyed with the 2022 high at 151.95 and is backed by the 38.2% retracement / June low-day close (LDC) at 154.34/89. Medium-term bearish invalidation now set to 157.25.
A break / close below this key support pivot is needed to invalidate the March uptrend / mark downtrend resumption towards subsequent objectives at the February LDC at 146.42 and the 78.6% retracement near 144.90.
Bottom line: The USD/JPY breakdown is testing major technical support into the August open with the NFPs still on tap into the weekly close. Form a trading standpoint, a good zone to reduce short-exposure / lower protective stops – rallies should be limited to 154.90 IF price is s heading lower on this stretch with a close below 148.54 needed to fuel the next leg lower. Stay nimble into the August opening-range and watch the weekly closes here for guidance.
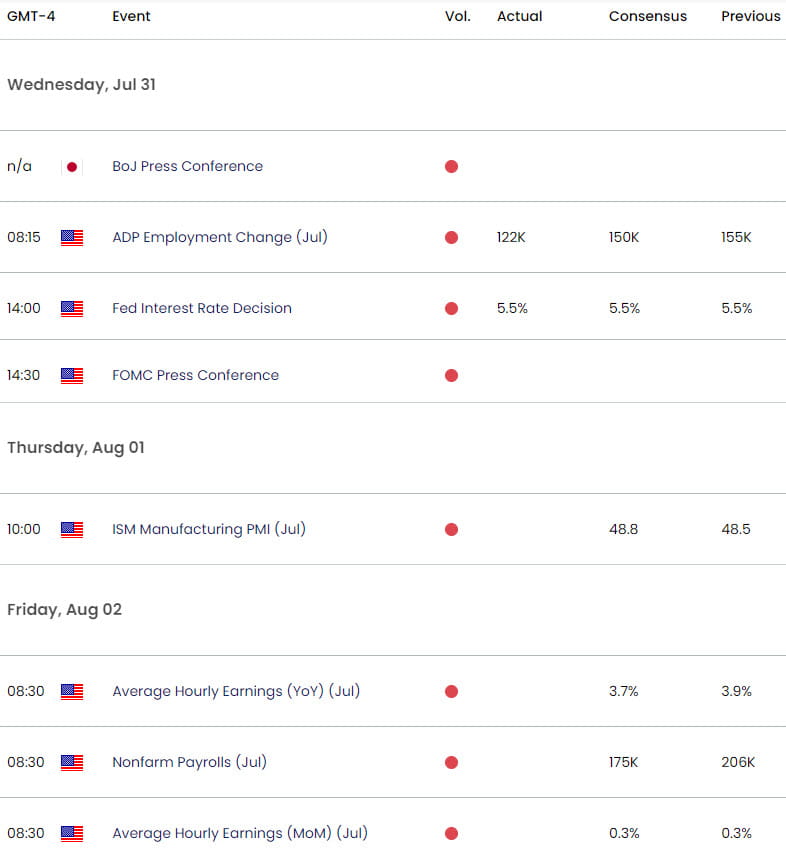
USD/JPY Key Economic Data Releases

Economic Calendar - latest economic developments and upcoming event risk.
Active Weekly Technical Charts
- Euro (EUR/USD)
- British Pound (GBP/USD)
- Crude Oil (WTI)
- Gold (XAU/USD)
- Australian Dollar (AUD/USD)
- Canadian Dollar (USD/CAD)
- US Dollar Index (DXY)
--- Written by Michael Boutros, Sr Technical Strategist with FOREX.com
Follow Michael on X @MBForex


