Japanese Yen Technical Forecast: USD/JPY Weekly Trade Levels
- Japanese Yen set to snap four-week losing streak– USD/JPY poised to erase June gains
- Break of July opening-range takes USD/JPY into 2024 trend support
- Resistance 160.26/40, 161.68, 163.69-164.74 – Support 157.37, 154.89 (key), 153.66
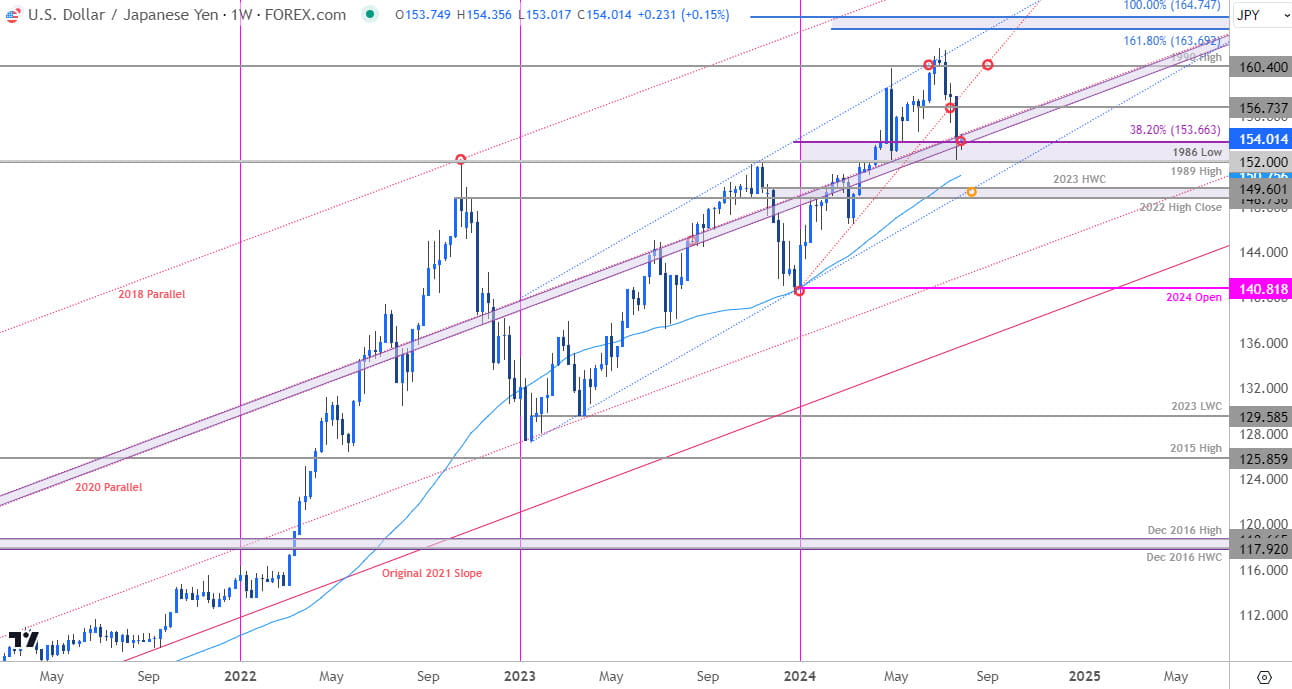
The Japanese Yen is set to snap a four-week losing streak with USD/JPY plunging 2.8% off multi-decade highs. Weaker-than-expected US inflation data sparked the largest single-day decline since May with a break below the July opening-range putting a bearish tone on price in the days ahead. That said, immediate decline is now testing multi-month uptrend support and the battle lines are drawn for the bulls. These are the levels that matter on the USD/JPY weekly & daily technical charts.
Review my latest Weekly Strategy Webinar for an in-depth breakdown of this Yen setup and more. Join live on Monday’s at 8:30am EST.
Japanese Yen Price Chart – USD/JPY Weekly

Chart Prepared by Michael Boutros, Sr. Technical Strategist; USD/JPY on TradingView
Technical Outlook: In last month’s Japanese Yen Technical Forecast we noted that USD/JPY was poised for a breakout as the June opening-range took shape just below resistance. We noted that, “From a trading standpoint, losses would need to be limited to the weekly lows for the December advance (blue trendline) to remain viable.” USD/JPY briefly registered an intraday low at 155.72 three-days later before breaking decisively higher with price marking a fresh multi-decade high at 161.95 into the July open.
The advance exhausted into uptrend resistance (blue) with today’s softer-than-expected US inflation print (CPI) sparking a massive sell-off. As of this report, USD/JPY has already marked the largest weekly range/decline since the April BoJ intervention, and the focus is on this pullback from uptrend resistance with key weekly support at the June low-week reversal close at 156.73.
Japanese Yen Price Chart – USD/JPY Daily

Chart Prepared by Michael Boutros, Sr. Technical Strategist; USD/JPY on TradingView
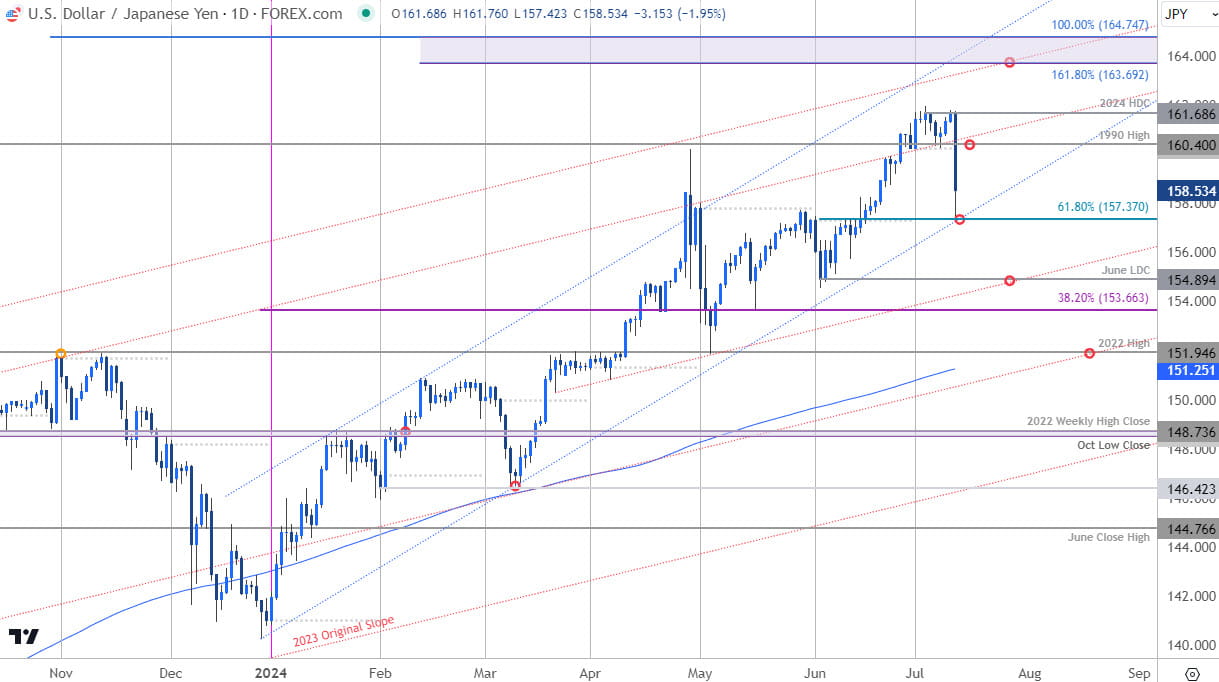
A closer look at the USD/JPY daily chart shows a breakout of the July opening-range with the decline already testing initial support today at the 61.8% Fibonacci retracement of the June rally at 157.37. The immediate focus is on a breakout of today’s range with a close below threatening a larger correction towards the June low-day close at 154.89- look for a larger reaction there IF reached. Longer-term, bullish invalidation now raised to the 200DMA / 2022 high at 151.25/94.
Initial resistance is now eyed at the July open / 1990 high at 160.26/40 with a breach / daily close above the 2024 high-day close at 161.68 needed to mark uptrend resumption. The next major level of resistance on the topside is eyed at the highlighted Fibonacci confluence near 163.69/74.
Bottom line: A break of the monthly opening-range in USD/JPY takes price into yearly uptrend support. From at trading standpoint, the bulls would need to defend today’s low for the late-December advance to remain viable. Rallies should be limited to the objective monthly open IF price is heading lower here with a close below 157.37 needed to suggest a larger correction is underway. Keep in mind we also get the release of the US Produce Price Index (PPI) tomorrow- watch the weekly closes here for guidance.
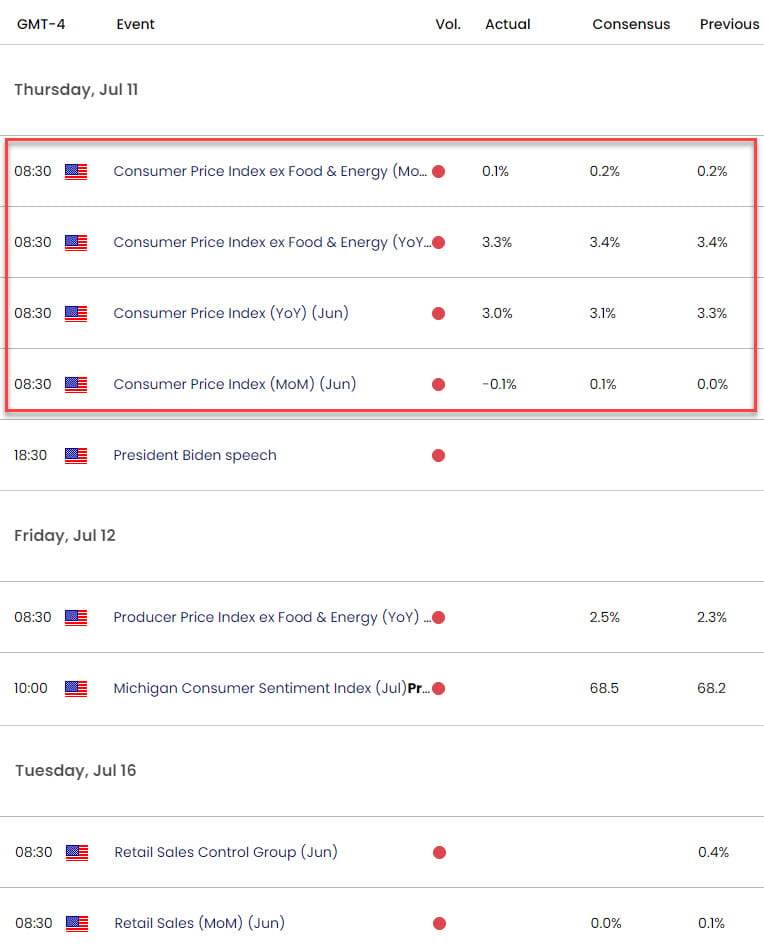
USD/JPY Key Economic Data Releases

Economic Calendar - latest economic developments and upcoming event risk.
Active Weekly Technical Charts
- US Dollar Index (DXY)
- Euro (EUR/USD)
- Gold (XAU/USD)
- British Pound (GBP/USD)
- Crude Oil (WTI)
- Australian Dollar (AUD/USD)
- Canadian Dollar (USD/CAD)
--- Written by Michael Boutros, Sr Technical Strategist with FOREX.com
Follow Michael on X @MBForex


