Japanese Yen Technical Forecast: USD/JPY Weekly Trade Levels
- Japanese Yen losses persist as Treasury yields breakout to fresh yearly highs
- USD/JPY pivots above key technical barrier- October opening-range breakout pending
- Resistance 151.90-152, 153.93, 157.62/80- Support 147.69-148.73, ~146.50s, 145
The Japanese Yen losses have continued to persist with USD/JPY holding near the yearly highs after rallying more than 18% off the January low. While a breach above a key technical zone keeps the focus higher, the advance has lacked conviction in recent weeks with USD/JPY continuing to contract within the October opening-range and we’re looking for a breakout in the days ahead to clear the way. These are the updated targets and invalidation levels that matter on the USD/JPY weekly technical chart.
Review my latest Weekly Strategy Webinar for an in-depth breakdown of this Yen setup and more. Join live on Monday’s at 8:30am EST.
Japanese Yen Price Chart – USD/JPY Weekly

Chart Prepared by Michael Boutros, Sr. Technical Strategist; USD/JPY on TradingView
Technical Outlook: In last month’s Japanese Yen Technical Forecast, we noted that USD/JPY was testing a, “major resistance threshold at 147.69-148.73 – a region defined by the 2022 high-week close & the high-close. The immediate advance may be vulnerable into this zone with a breach / close above needed to fuel the next leg higher in price.” The rally broke through this threshold into the close of September with price testing this same region as support for the past three-weeks.
A few factors to note here: the pivot above resistance did not offer the immediate accelerated rally that tends to occur during major breakouts and at the same time, weekly momentum is just now creeping into the overbought condition. That said, yields on US Treasuries continue to climb this week and may offer a tailwind here in the days ahead.
Initial resistance objectives are eyed at the 1989 high / 1986 low at 151.90-152 and is backed by the upper parallel / 2.272% Fibonacci extension of the yearly advance at 153.93- look for a larger reaction there IF reached with a breach / close above needed to clear the way towards 157.62/80.
Support steady at 147.69-148.73 and is backed closely by the 2020 parallels (currently ~146.50s). Broader bullish invalidation now raised to the 145-pivot zone – losses below this threshold could see the yearly advance unravel back towards the 52-week moving average.
Bottom line: USD/JPY has pivoted above a key technical barrier with the monthly opening-range preserved between 147.69-150.15– look to the breakout for immediate guidance here. From a trading standpoint, losses should be limited to the 2020 parallel IF price is heading higher here with a breach / close above the October opening-range high needed to fuel the next leg in price. I’ll publish an updated Japanese Yen Short-term Outlook once we get further clarity on the near-term USD/JPY technical trade levels.
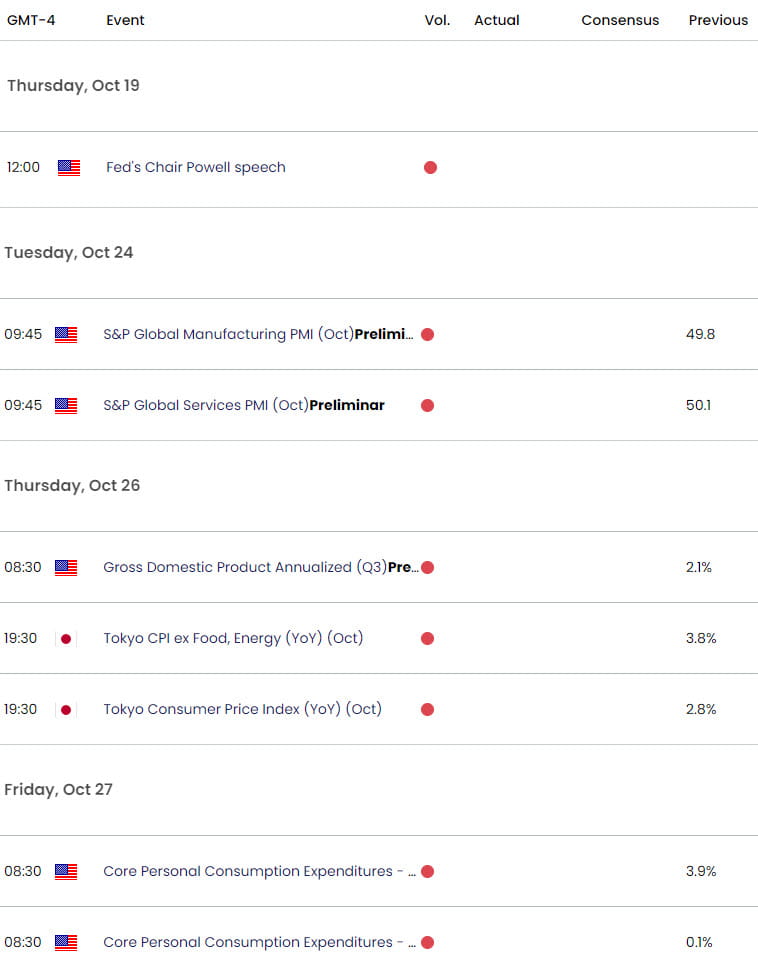
USD/JPY Key Economic Data Releases

Economic Calendar - latest economic developments and upcoming event risk.
Active Weekly Technical Charts
- Australian Dollar (AUD/USD)
- Crude Oil (WTI)
- US Dollar (DXY)
- Gold (XAU/USD)
- Euro (EUR/USD)
- Canadian Dollar (USD/CAD)
- British Pound (GBP/USD)
--- Written by Michael Boutros, Sr Technical Strategist with FOREX.com
Follow Michael on Twitter @MBForex


