Japanese Yen, USD/JPY Talking Points:
- USD/JPY is back-below the 155.00 handle after an intervention following the FOMC rate decision yesterday.
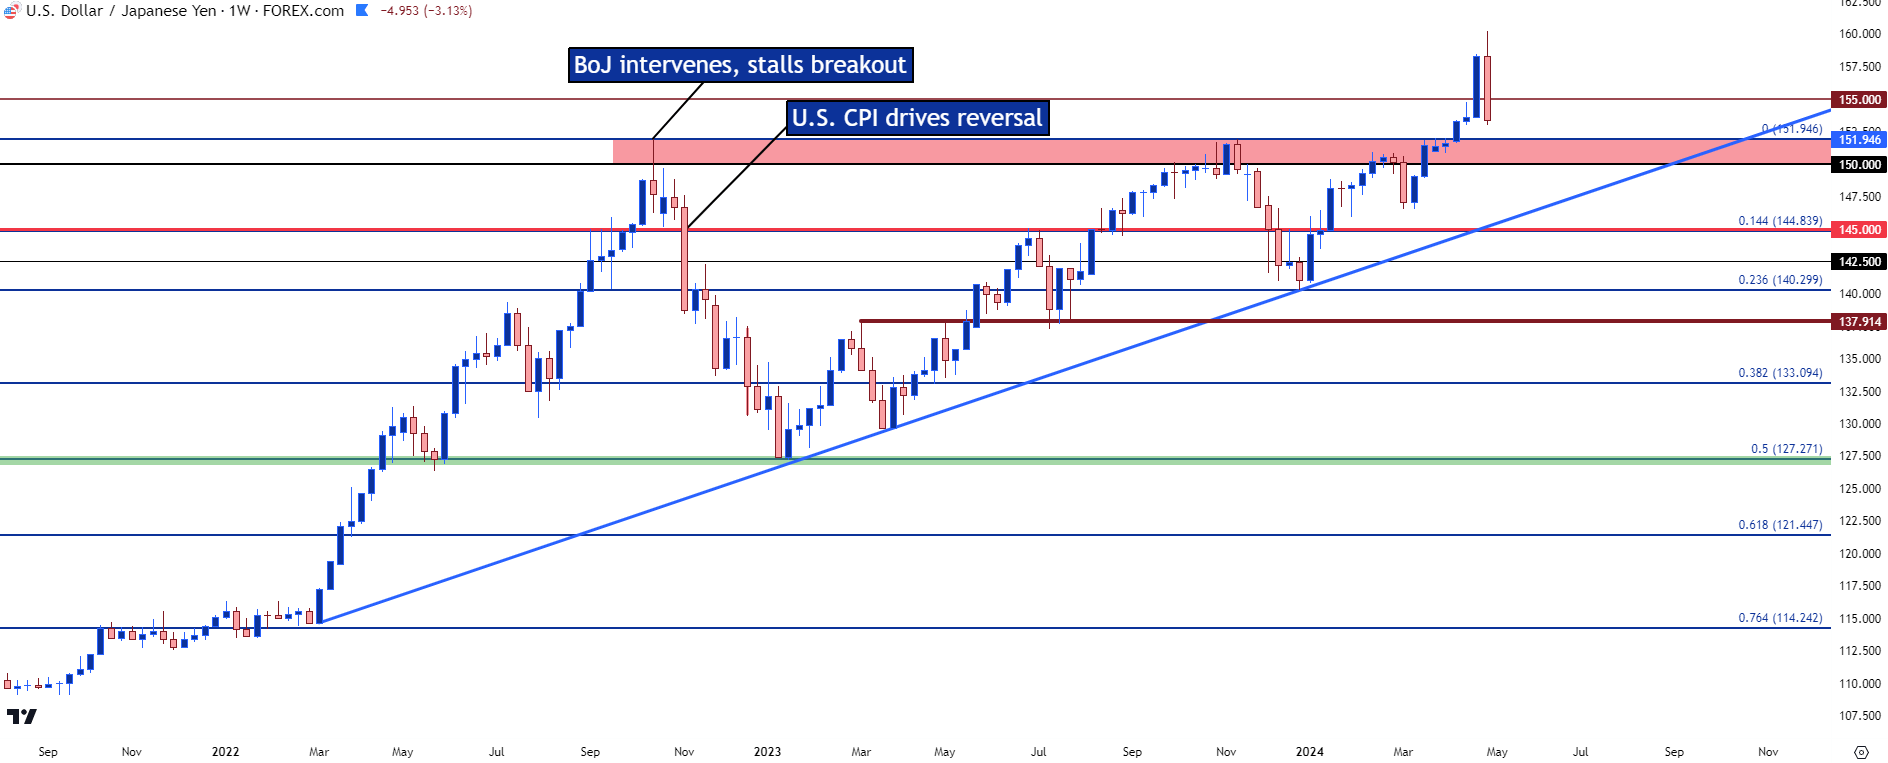
- The big question now is whether we’re on the verge of USD-weakness, which could help to extend the sell-off in the pair. This would be like what we saw in 2022, when the BoJ stepped into intervene when USD/JPY was trading above the 150.00 level. In that instance, intervention was enough to stall the trend, but the reversal in the pair hit the next month, on the back of a lower-than-expected CPI report. Tomorrow brings NFP and then the next U.S. CPI report is on May 15th.
- I’ll be discussing these themes in-depth in the weekly webinar. It’s free for all to register: Click here to register.
It seems the Bank of Japan didn’t want to wait around for another test of the 160.00 handle.
Following yesterday’s FOMC meeting, USD/JPY plunged in a very quick manner. Initially, I was skeptical of this being intervention related for a couple of reasons. The main one being that price hadn’t yet re-tested the 160.00 handle, which is what the BoJ had defended earlier in the week. But, also of issue was timing as the plunge in the pair began to show after the conclusion of the FOMC meeting, when it was still very-early morning in Japan.
Since then, the Wall Street Journal has reported that it likely was intervention based on money market data, and from the chart, it looks as though a number of longs may have been stopped out along the way as multiple higher-low supports have been taken-out.
But, the main quandary remains, and this is something I wrote about last Thursday, highlighting how the BoJ was getting backed further-and-further into a corner. As this week opened, USD/JPY spiked higher until, eventually, the BoJ took a stand with an intervention designed to defend the Yen.
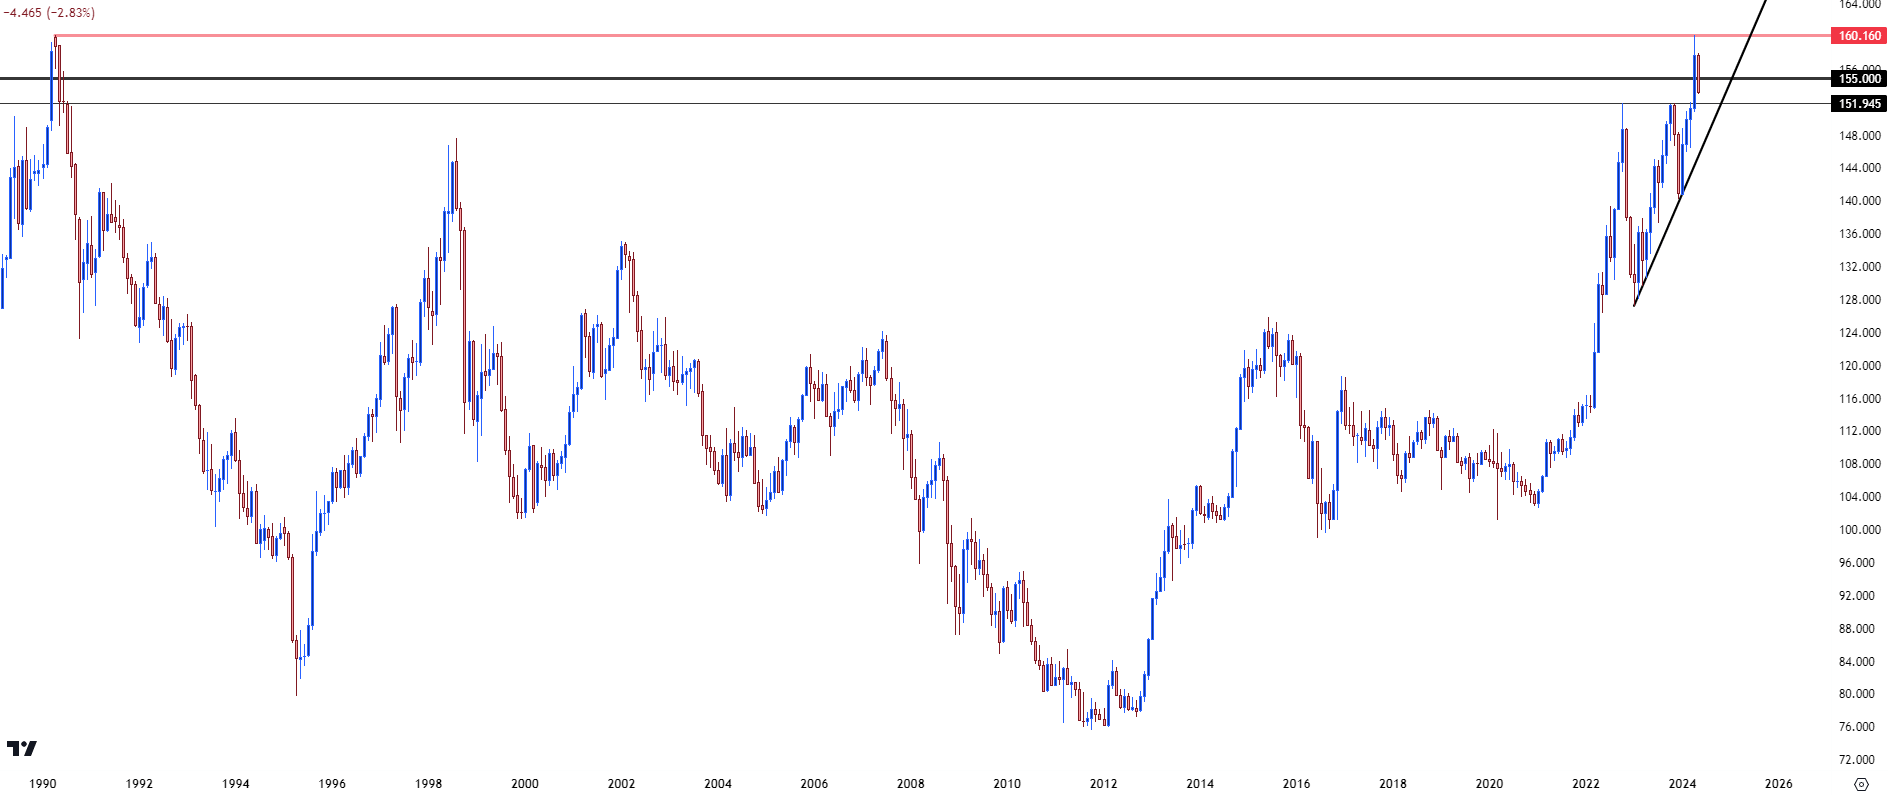
The move yesterday seems to be the BoJ now going on the offensive, rather than waiting for USD-strength to drive another test of the 160.00 level that, until this week, hadn’t traded since the year 1990.
USD/JPY Monthly Price Chart: 160.00 Revisit
 Chart prepared by James Stanley; data derived from Tradingview
USD/JPY and Fundamental Flows
One of the main points I had written about in that prior article is that, without a change in monetary policy at the Bank of Japan, the risk is that the pair simply re-ascends after the heavy hand of intervention takes a step back. With the rate divergence between the U.S. and Japan so wide, there’s continued incentive for investors to borrow cheap JPY and then buy higher-yielding assets, such as the USD. And, in a currency pair, that rate divergence is clearly delineated in the daily rollover debits or credits or debit; and for USD/JPY currently, this means that longs are earning rollover while shorts are paying. This prods motivation on both sides of the matter: If the move stalls, then shorts have to take on negative carry, which costs money. Mean while bulls can still earn rollover even with price stalled and that can bring an inherent bias to the matter on that basis alone.
As a case in point we can draw back to 2022 when a similar, albeit less developed problem had presented itself. USD/JPY had already put in a sizable move and the Ministry of Finance started talking about intervention potential when the pair was trading at the 145.00 handle. It took about a month but, eventually, bulls drove up to fresh highs and in short order the move exploded higher, with USD/JPY testing above the 150.00 level.
That’s around the time the BoJ was ordered to act and they intervened on a Friday, helping to push price back-down to support around prior resistance. That held for a few weeks, but what ultimately drove the reversal was a USD-related item, showing on November 10th in the form of a U.S. CPI release. Softer-than-expected inflation drove rate hike bets out of the USD.
But perhaps the larger item is carry traders that had held on for the ride up were now faced with the very real prospect of watching unrealized profits go up in smoke. And while the rollover on long positions remained tilted towards bulls, it mattered little if the trade was losing more in principal than it was accruing in carry.
That sell-off lasted for a little more than two months until, eventually, support showed up at the 50% mark of that prior up-trend. And then most of last year was bulls clawing the move back, driving right back to the 150.00 and then 152.00 levels.
USD/JPY Weekly Price Chart
 Chart prepared by James Stanley, USD/JPY on Tradingview
USD/JPY Current Stance
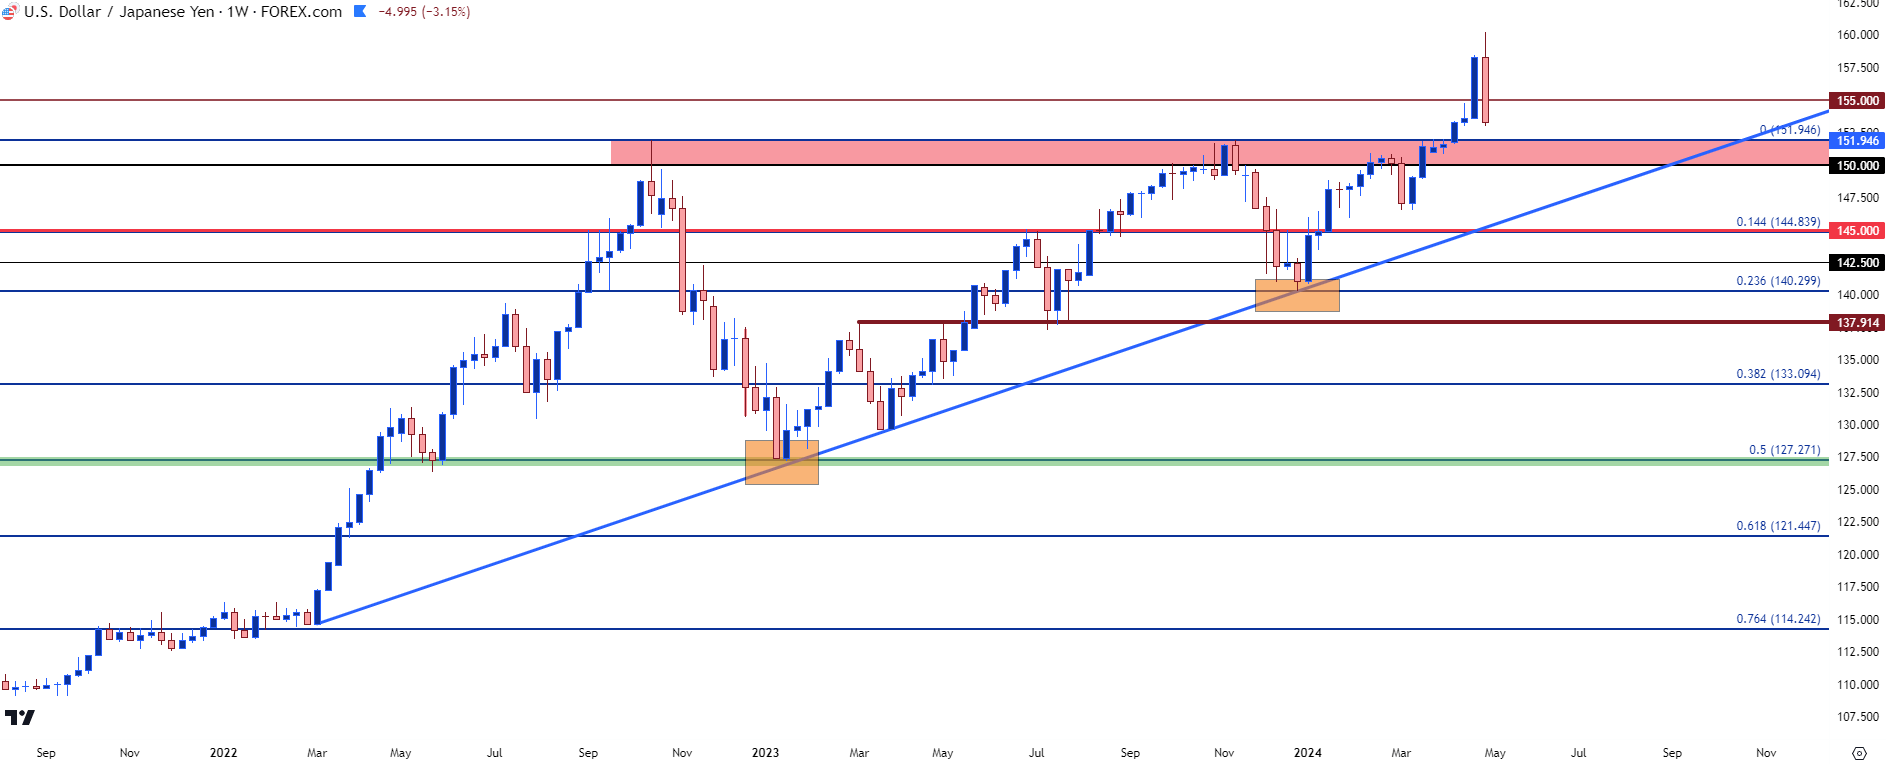
This year’s episode has seemed to be a bit more active and this is related to last year’s retracement from 152.00. While the pullback that started in Q4 of 2022 ran for a couple of months and 2,400+ pips, the Q4 2023 pullback found support ahead of the 2024 open, and bulls went right back to work.
The 152.00 breakout was clean, all factors considered. I had talked about the backdrop to that in March, highlighting the likelihood of stops sitting above that 152.00 level, which could act as a springboard to the next breakout. Stops on short positions are ‘buy to cover’ logic, and usually execute ‘at best.’ And if there’s no sellers standing at the ready to offer liquidity at those prices, well then, the demand from buy orders will keep driving prices higher until, eventually, someone is willing to offer.
This explains breakouts and it explains how stops get slipped. In USD/JPY, this was a slingshot move that showed just after the U.S. CPI report that was released in April, and as I had noted back in March, the next major line in the sand was 155.00.
Notably, the BoJ did not defend 155.00, and last week saw bulls starting to press the matter with a breakout that continued to run into the end of the week.
This week began with that 160.00 test and that’s the point where the BoJ finally stepped-in, creating a large move back down to the 155.00 handle. But it didn’t take long for bulls to load back in and push all the way back up to 158.00. This was likely at least part of the reason why the BoJ was standing at the ready to intervene, fearful that the continued rate divergence between the U.S. and Japan would simply lead to another 160.00 test. And rather than wait around on the back foot while being backed further into a corner, the bank jumped at the opportunity to be a bit more proactive.
As I noted above, this surprised me for a couple of reasons but one of the primary reasons is displayed right here: The BoJ had shown passiveness until yesterday’s intervention, when they suddenly got more aggressive. This is something that could potentially blow up on them, but there’s also a scenario where it could end up working out quite well, but they will probably need some help on the data front.
Like we saw in 2022, intervention on its own wasn’t a big-picture reversal driver. It can back bulls off the bid and it could run stops sitting underneath higher-lows, which could lead to more selling pressure as that supply comes into the market. But with rate divergence so wide, once the BoJ backs off, there’s motive for bulls and a deterrence for bears on the basis of that carry relationship.
From a rollover perspective, it can literally be stated that it pays to be a bull, and it costs to be a bear. So, for bears to control price, there likely needs to be another reason or driver to attract more sellers and to keep those sellers holding short, even when paying rollover.
In 2022 the big reason for the reversal was a similar reversal theme in the USD. The U.S. Dollar reversed in November and December of that year and as carry traders looked at the prospect of principal losses on the back of broad-based USD weakness, they were compelled to close positions for fear of larger losses.
And there was even a similar scenario last year, also in November, and also driven by a below-expected CPI report. The Fed had sounded more-dovish at the rate decision earlier that month and when inflation surprised on the downside, a similar fear of a USD reversal allowed for a sell-off in USD/JPY. But, this time, bulls didn’t sit back for as long, as that sell-off spanned a smaller move and support showed at the 23.6% retracement of the same Fibonacci study from which the 50% mark caught the lows earlier in the year.
USD/JPY Daily
 Chart prepared by James Stanley, USD/JPY on Tradingview
The BoJ May Be the Most Hopeful USD Bear At the Moment
While it seems pretty clear that the Fed doesn’t want to hike rates, they’re also not quite in a position to cut. And from the side of the BoJ, they just hiked rates for the first time since 2007 and given the dynamics of their YCC policy, rate hikes could come along with a series of repercussions. So, hurriedly hiking rates in Japan in a manner similar to what the Fed did in 2022 seems a distant prospect.
What could drive the sell-off would be an impending fear of a larger USD-reversal, and this would likely need some backing from data as we’ve seen DXY charge-higher this year even with the backdrop of a dovish FOMC. In that camp, however, is the fact that USD is trading near the resistance side of a range that’s been in-play for 16 months; and if sellers can tilt prices back down to support that could, potentially, give more motivation for USD/JPY carry to unwind.
US Dollar Weekly Price Chart
 Chart prepared by James Stanley; data derived from Tradingview
USD/JPY Backdrop
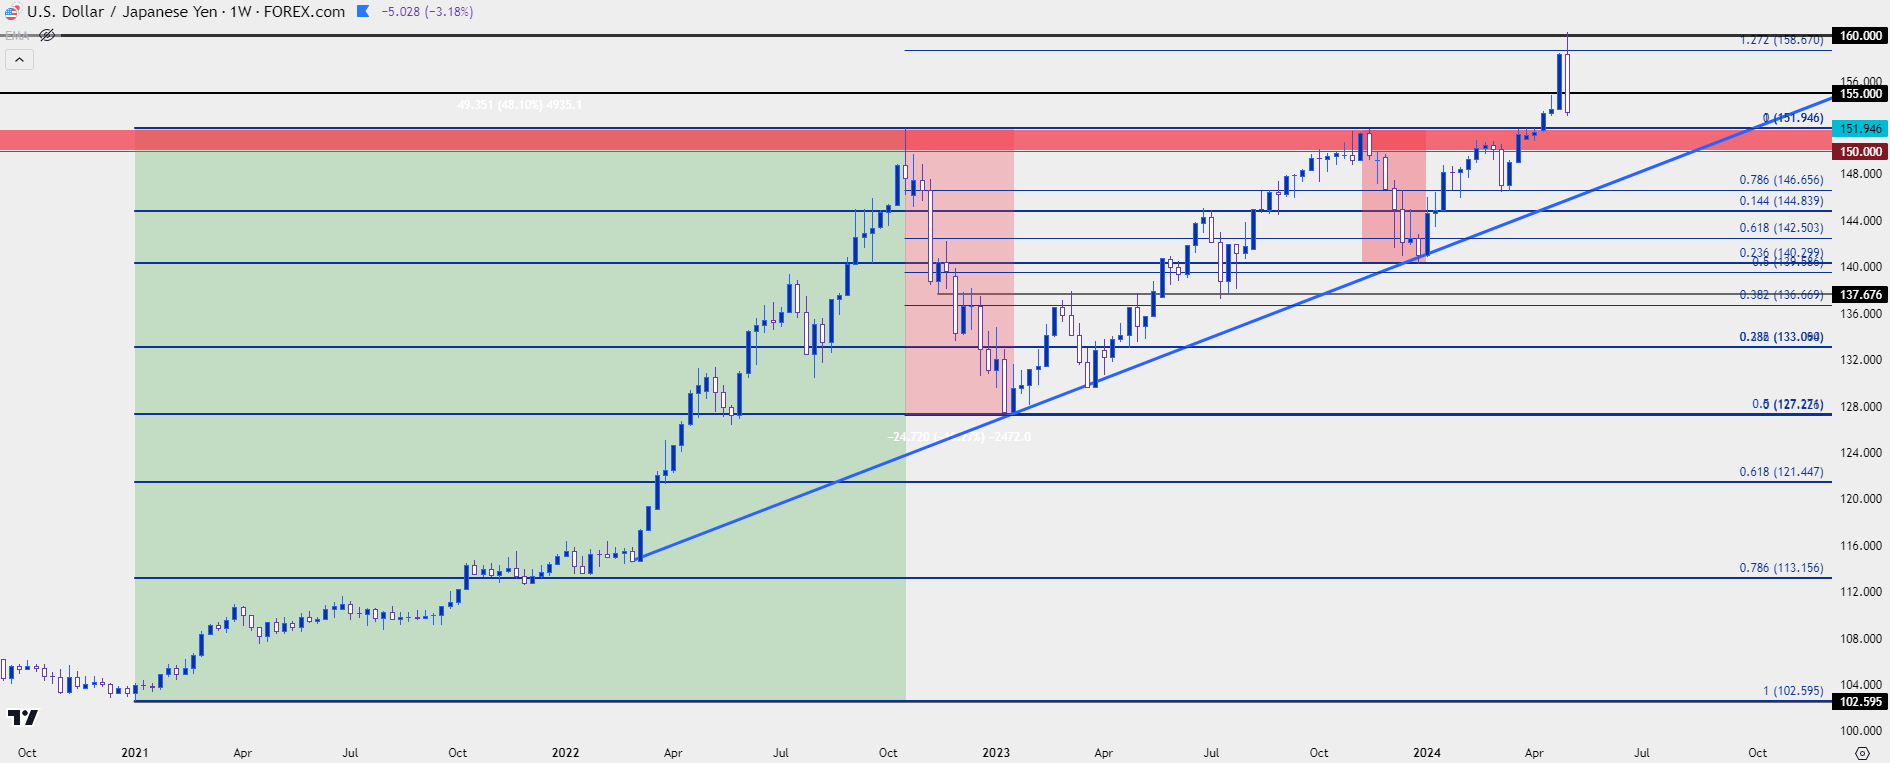
At this point, there hasn’t yet been a test of support at prior resistance in the 150-152 area. Bulls were so aggressive on the initial breakout that they never allowed for a pullback there. But – if USD weakness can continue to show and this would likely have some drive from tomorrow’s NFP report, then that zone becomes a spot of interest to see if bulls take a stand. And, if they don’t, that means we’re probably seeing a larger, more broad-based sell-off in the US Dollar. And at that point, the pullback could run deeper as carry traders are faced with the prospect of watching unrealized profits get wiped out.
USD/JPY Weekly Price Chart
 Chart prepared by James Stanley, USD/JPY on Tradingview
--- written by James Stanley, Senior Strategist


