Japanese Yen Talking Points:
- The Japanese Yen has continued to show weakness against the U.S. Dollar following last week’s USD/JPY breakout to fresh 34-year highs.
- The bullish breakout in USD/JPY was driven by another hotter-than-expected CPI report out of the U.S. but given the Japanese Finance Ministry’s prior defense of the 150.00, the natural question is whether they’ll order the BoJ to intervene again. It’s not an easy task as the BoJ would need to spend finite FX reserves to buy a currency that their own monetary policy is pushing-lower, and with rollover still tilted aggressively to the long side of USD/JPY, there’s also the question as to how well an intervention would work, or whether price would just jump right back to prior resistance, such as we’ve seen over the past two years.
- For a summary on the current backdrop, the below video produced by Matt Weller explains the dynamic around USD/JPY and the Bank of Japan:
After two years of resistance around the 152.00 level, USD/JPY has finally broken out, and that’s just a portion of the change that’s been seen around Japanese markets over the past month.
In March, the Bank of Japan hiked rates for the first time since 2007. This was a moderate move that helped to bank to leave behind the negative rate regime as they moved from -0.1% to 0.1%. But it wasn’t enough to cause unwind of the carry trade that’s built in the pair since early-2021, just as U.S. inflation began to push higher.
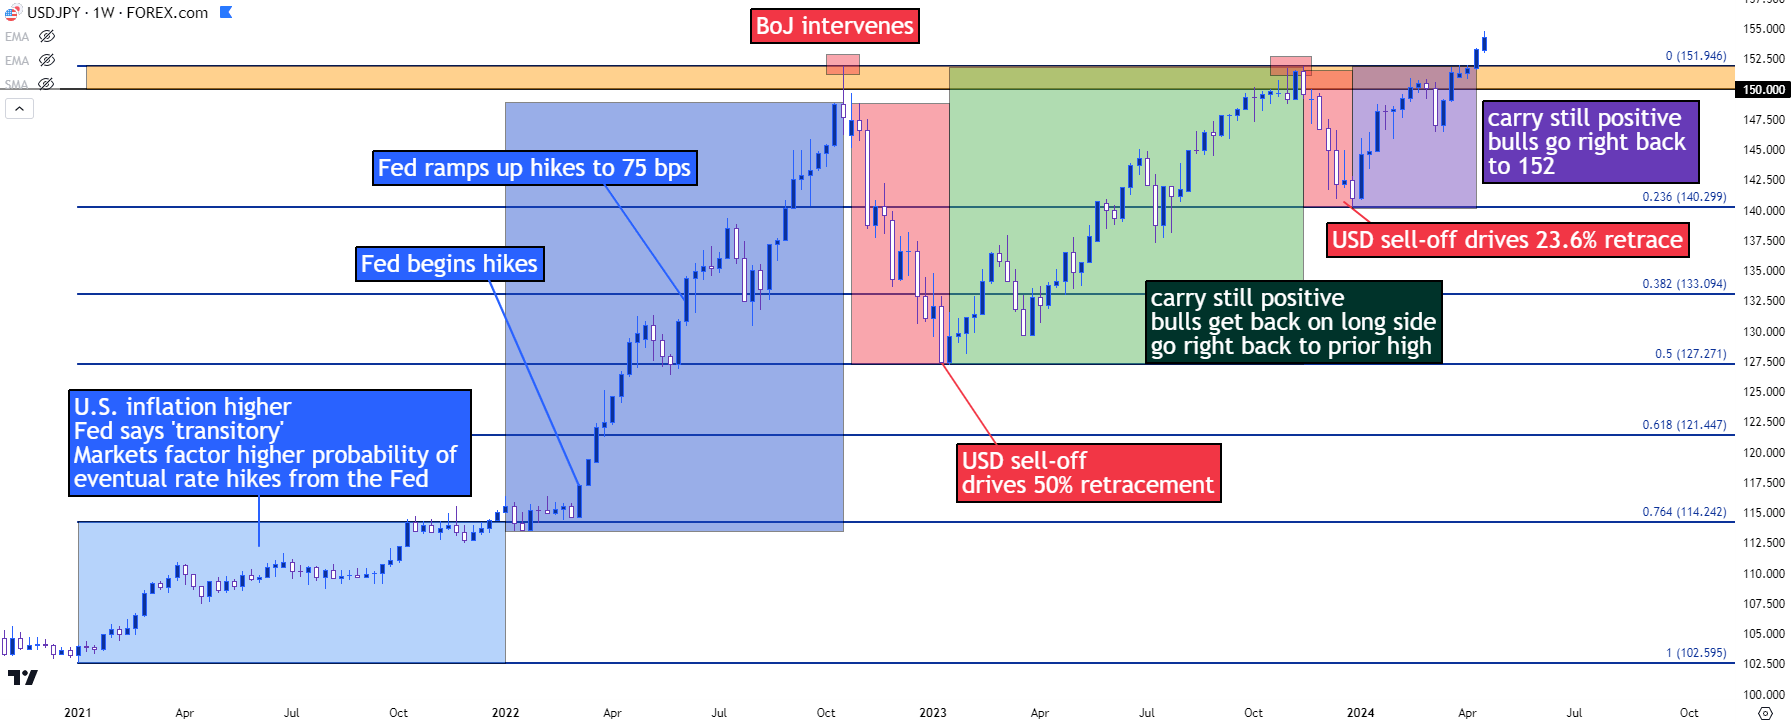
Rates are an incredibly forceful driver across global markets, and in the FOREX market, there’s a direct drive as taken from the rollover that can be earned or paid at the end of the day based on rates behind the economies represented in the pair. The carry trade can be impactful because investors can borrow a weaker currency at a lower rate and then invest in a stronger currency with a higher rate. And as demand drives the side of the pair with the higher rate, a trend develops, which further draws in more demand that can allow for even higher-highs. But, more than the rate itself, it’s rate expectations that’s driving price action in such matters. As we can see below, the USD/JPY trend began in 2021 as U.S. inflation was moving higher, and then it started to heat up in March of 2022 as the Federal Reserve began to hike rates.
The move began to drive even more aggressively after the Fed ramped up to 75bp hikes in June of that year, and this was happening as the Bank of Japan remained in negative rate territory. As more investors piled into the trade, more were encouraged to follow, and this led to a very one-sided scenario as the pair vaulted up to 145.00 in September of 2022. That’s around the time the Japanese Finance Ministry started to ring the alarm bells, warning that ‘one-sided moves in the currency were undesirable.’
That helped the pair to stall for about a month at 145.00, but with a strong trend intact and with rollover still positive on the long side, bulls were undeterred, and that led to a fast breakout up to the 150.00 handle, at which point the BoJ sprang into action to intervene, using FX reserves to buy Japanese Yen in the open market and effectively buying a currency that their very own monetary policy was punishing with a negative rate regime.
USD/JPY Weekly Price Chart
 Chart prepared by James Stanley, USD/JPY on Tradingview
The sell-off after that intervention was intense as the pair gave back more than 2400 pips in three months. But, when the door opened into 2023 trade and the Fed was still seeing strong inflation and a strong labor market – and there were few signs that any change may be afoot around the BoJ, support played-in off the 50% mark of that bullish move.
And then bulls went right back at it, pushing the pair higher as driven by a potent combination of positive rollover on the long side and a strong trend as driven by the growing rate dichotomy between the two economies. By October, USD/JPY was already back at the same 150.00 level.
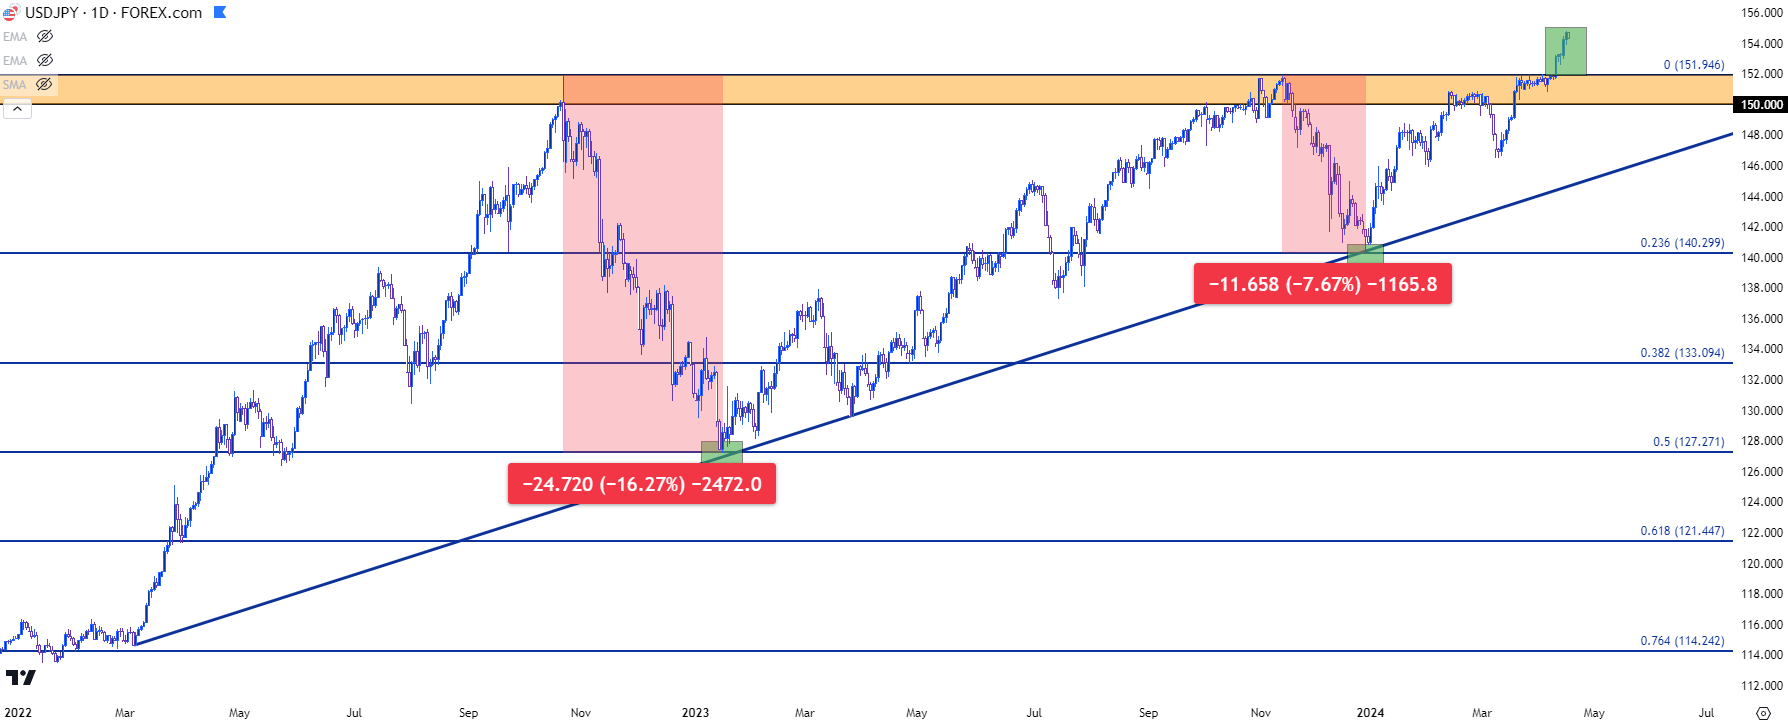
This time, however, the thought was that the BoJ would defend the 152.00 level as that’s very near the spike-high from the year before. There were even veiled threats from the Japanese Finance Ministry when the pair traded above 150.00 last year, but before a breakout could show up, there was a similar drive of USD-weakness that appeared after the CPI report that was released in November.
Once again, resistance at 152.00 held and prices pulled back, and USD/JPY continued to sell-off into the end of the year. But this time the carry trade didn’t unwind as much as it did in 2022, and that led to a higher-low at the 23.6% Fibonacci retracement of the same 2021-2022 major move. That higher-low also confirmed a bullish trendline, which created an ascending triangle formation with horizontal resistance and a series of higher-lows. Those formations are often approached with aim of bullish breakout, and that’s what came into play last week.
USD/JPY Daily Price Chart
 Chart prepared by James Stanley, USD/JPY on Tradingview
USD/JPY Goes Breakout – Push to 155.00
It didn’t take long for bulls to push USD/JPY back into the 150-152 zone in 2024. After the Q4, 2023 low was set in the final few days of trade last year, both the U.S. Dollar and USD/JPY started to drive-higher, and those themes remain in-play today.
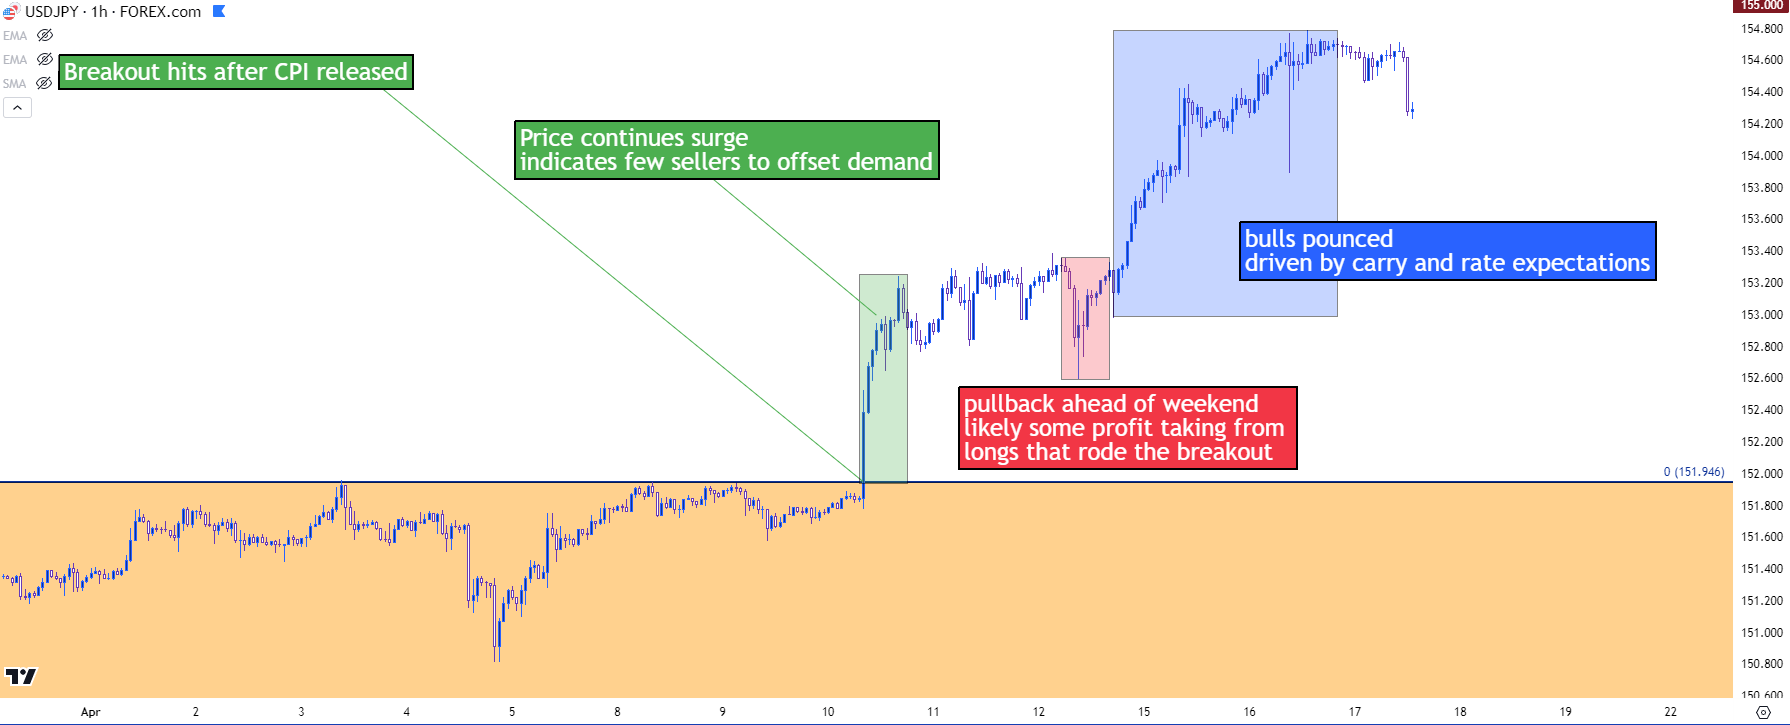
On the U.S. side, rate cut expectations have diminished as U.S. data has remained strong, which has helped to keep the positive rollover tilted to the long side of the pair. I discussed this dynamic shortly after the rate hike, highlighting the possibility of bullish breakouts on the basis of the market structure in USD/JPY. With a resistance level such as we had, just inside of the 152.00 handle, there were likely a plethora of stops on short positions lodged above that price. Stops on short positions are ‘buy to cover’ logic, and stop orders usually execute ‘at best,’ meaning the actual execution may be far beyond the level that the stop was placed.
This is something that will be determined by market dynamics, because if there aren’t sellers willing to offer the pair and there’s more and more demand coming online from the triggered stops, price can continue to ascend until, eventually, sellers step in to provide liquidity. This is both why stops can get slipped and why breakouts can extend.
This is what happened last week after the CPI report.
USD/JPY Hourly
 Chart prepared by James Stanley, USD/JPY on Tradingview
USD/JPY What’s Next?
Before the breakout, I had highlighted 155.00 as a level of interest and this was largely drawn from recent history. The saga at 145.00 in 2022 showed that the Japanese Finance Ministry was willing to offer verbal intervention at the 145.00 level, but it wasn’t until bulls tested their resolve with a bullish breakout to 150.00 that they ordered the BoJ to act.
And as I had looked at in the webinar before the breakout, there was even similar price structure at 152 that had showed at 145 a couple of years earlier, as bulls were persistently bidding the currency right up to the line of resistance.
Since the breakout, we’ve already heard from the Finance Ministry with similar comments that such moves in the currency market were undesirable and that they stand by to act. But the timing may be ill-suited to intervention at this point, and there’s a few reasons for this. One big one is the fundamental backdrop and the still-positive carry on the pair. If the BoJ was ordered to intervene and they were able to push the pair down to 145.00 or 140.00, would that be enough to reverse the move? The past two pullbacks over the past two years were helped along by U.S. Dollar weakness, but that's now showing now, so it questions how impactful any interventions might be.
Because if the carry is still positive, we may very well see what we’ve seen over the past couple of years, where currency traders can use that move as a pullback to buy the carry trade at a relatively cheaper level until price re-ascends up to the Finance Ministry's 'line in the sand.'
It seems for any lasting change, there would need to be an alteration in the fundamental backdrop between the two economies, and one of those key drivers of pullbacks over the past couple of years was broader-USD weakness on the hope that the Fed would soon be moving into rate cuts. That seems less likely given the pace of U.S. data so far this year and markets are now pricing-down rate cuts from the Fed for 2024. So, the natural next question is whether there might be more change afoot on the monetary policy-front from the Bank of Japan?
So, either of those factors appear to carry bearish potential for the USD/JPY pair, but really, this will probably be a matter of market dynamics as we’ve seen over the past couple of years.
There was extreme rate divergence between the U.S. and Japan in both 2022 and 2023, but the reason those sell-offs from 152.00 were so intense was the prospect of carry traders watching unrealized profits going up in smoke as the USD sold-off. This is a symptom of a crowded trade and that likely remains a factor today; so when the tides do change or start to show the promise of change on the monetary policy divergence between the United States and Japan, there could be an impactful reversal.
But, until then, traders are still getting positive rollover for buying the bullish trend and there’s been little friction as we’ve only heard verbal threats of intervention since the breakout hit last week.
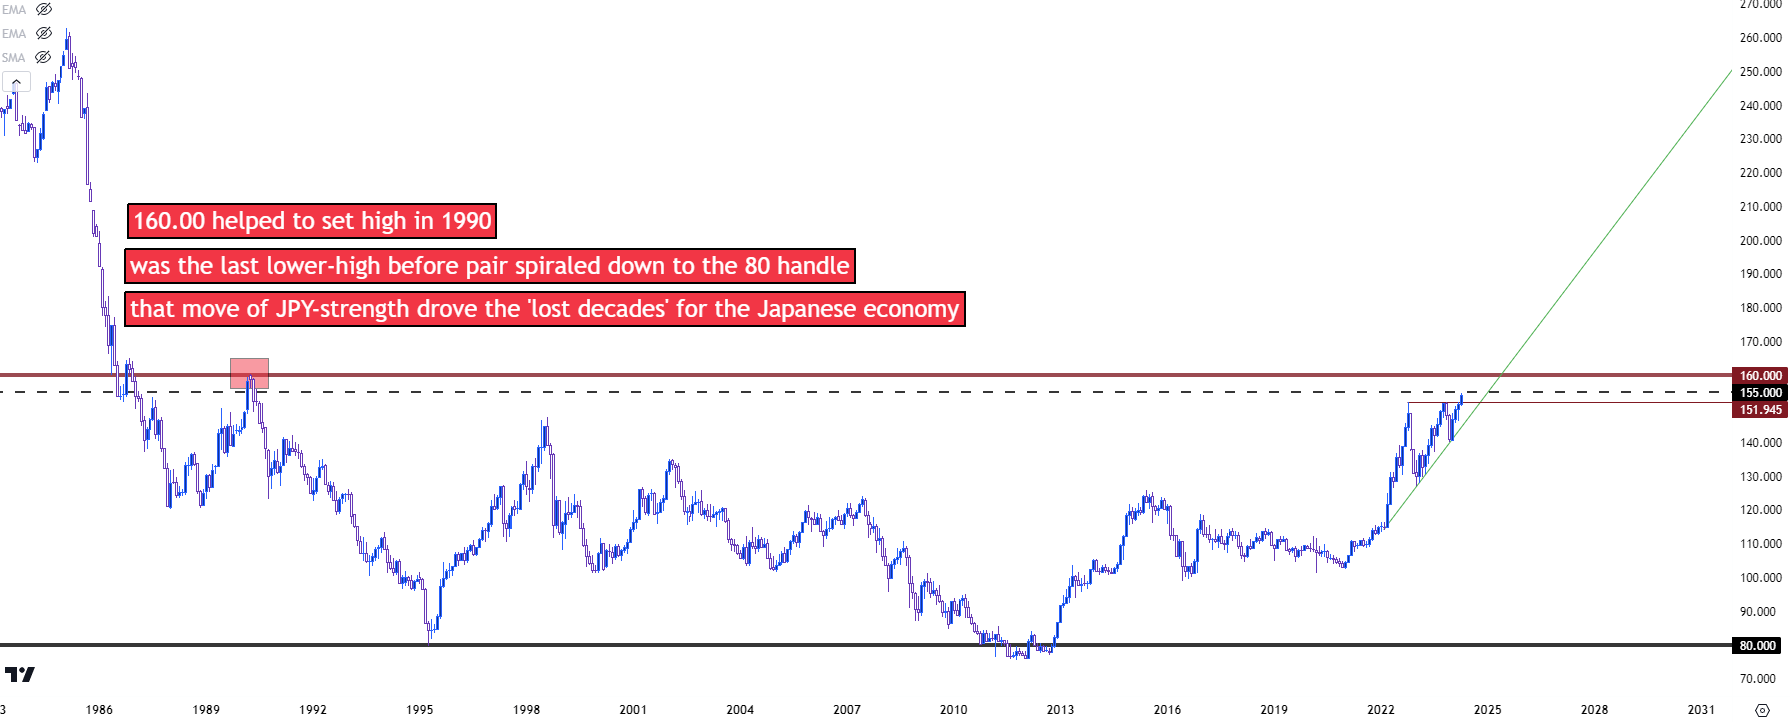
So, the big question remains as to whether the BoJ will be ordered to spring to action on a test above the 155.00 level. On a historical basis, there’s also scope for 160.00 as this was a significant swing-high in 1990 that hasn’t been re-tested since. If there’s no intervention at 155.00 then the next major spot of interest is at that 160.00 handle, and if the move happens quickly, that could motivate the Finance Ministry to order an intervention to stall the sell-off in JPY. A 160 print would likely elicit some fear from Japanese policymakers given its historical scope, as that was the last lower-high before the pair went into a 20-year sell-off, eventually bottoming in 2012.
There is one other factor to consider, however, and that’s the potential for the USD breakout to reverse, and this is a scenario that should at least be entertained as the Fed has been persistently dovish for much of this year. If the Core PCE print later in April comes out soft, that could give USD bulls cause for concern and that could temper the bullish breakout in DXY, which could have impact on USD/JPY.
Because with any crowded trade, there’s the ‘smoke in a crowded theater’ scenario to consider, where the exit door is only so wide and if you sit around and wait, it may already be too late. This is why those breakdowns in 2022 and 2023 moved so quickly while taking out so many supports along the way. Crowded trades in stretched markets can lead to strong and sizable reversals. But, for now, monetary policy is pushing on the long side of the pair and the main question is whether the BoJ is ordered to step in to stem the bleeding.
USD/JPY Monthly Price Chart
 Chart prepared by James Stanley, USD/JPY on Tradingview
--- written by James Stanley, Senior Strategist


